AMTD
7, 5381–5422, 2014Synergistic aerosol estimation from simulated Sentinel-3
data
W. H. Davies and P. R. J. North
Title Page
Abstract Introduction
Conclusions References
Tables Figures
◭ ◮
◭ ◮
Back Close
Full Screen / Esc
Printer-friendly Version Interactive Discussion
Discussion
P
a
per
|
Discus
sion
P
a
per
|
Discussion
P
a
per
|
Discussion
P
a
per
|
Atmos. Meas. Tech. Discuss., 7, 5381–5422, 2014 www.atmos-meas-tech-discuss.net/7/5381/2014/ doi:10.5194/amtd-7-5381-2014
© Author(s) 2014. CC Attribution 3.0 License.
This discussion paper is/has been under review for the journal Atmospheric Measurement Techniques (AMT). Please refer to the corresponding final paper in AMT if available.
Synergistic angular and spectral
estimation of aerosol properties using
CHRIS/PROBA-1 and simulated
Sentinel-3 data
W. H. Davies and P. R. J. North
College of Science, Swansea University, Singleton Park, Swansea, SA2 8PP, UK
Received: 25 April 2014 – Accepted: 15 May 2014 – Published: 3 June 2014
Correspondence to: W. H. Davies ([email protected])
AMTD
7, 5381–5422, 2014Synergistic aerosol estimation from simulated Sentinel-3
data
W. H. Davies and P. R. J. North
Title Page
Abstract Introduction
Conclusions References
Tables Figures
◭ ◮
◭ ◮
Back Close
Full Screen / Esc
Printer-friendly Version Interactive Discussion
Discussion
P
a
per
|
Discus
sion
P
a
per
|
Discussion
P
a
per
|
Discussion
P
a
per
|
Abstract
A method has been developed to estimate Aerosol Optical Depth (AOD), Fine Mode Fraction (FMF) and Single Scattering Albedo (SSA) over land surfaces using simulated Sentinel-3 data. The method uses inversion of a coupled surface/atmosphere radiative transfer model, and includes a general physical model of angular surface reflectance. 5
An iterative process is used to determine the optimum value of the aerosol properties providing the best fit of the corrected reflectance values for a number of view angles and wavelengths with those provided by the physical model. A method of estimating AOD using only angular retrieval has previously been demonstrated on data from the ENVISAT and PROBA-1 satellite instruments, and is extended here to the synergistic 10
spectral and angular sampling of Sentinel-3 and the additional aerosol properties. The method is tested using hyperspectral, multi-angle Compact High Resolution Imaging Spectrometer (CHRIS) images. The values obtained from these CHRIS observations are validated using ground based sun-photometer measurements. Results from 22 image sets using the synergistic retrieval and improved aerosol models show an RMSE 15
of 0.06 in AOD, reduced to 0.03 over vegetated targets.
1 Introduction
Limited understanding of atmospheric aerosol composition, distribution and function contributes the largest uncertainty to current estimates of Radiative Forcing (RF) and thereby to the uncertainty in future climate predictions (IPCC, 2013). The World Me-20
teorological Organization (WMO) established the Global Climate Observing System (GCOS) in 1992 to focus on satellite observations in order to provide better aerosol products leading to a reduction in climate uncertanty. GCOS has a target accuracy of 0.01 for AOD and 0.02 for SSA (GCOS, 2006). In this paper we aim to use re-cent improvements in the definition of common aerosol components (Holzer-Popp 25
AMTD
7, 5381–5422, 2014Synergistic aerosol estimation from simulated Sentinel-3
data
W. H. Davies and P. R. J. North
Title Page
Abstract Introduction
Conclusions References
Tables Figures
◭ ◮
◭ ◮
Back Close
Full Screen / Esc
Printer-friendly Version Interactive Discussion
Discussion
P
a
per
|
Discus
sion
P
a
per
|
Discussion
P
a
per
|
Discussion
P
a
per
|
Optical Depth (AOD), Fine Mode Fraction (FMF) and Single Scattering Albedo (SSA) should be possible using synergistic retrieval from new satellite observations.
In summarising the drivers of climate change, the Intergovernmental Panel on Cli-mate Change (IPCC) found that there is a negative RF from most aerosols with a total aerosol effect of between−1.9 and−0.1 W m−2 (IPCC, 2013). However, the effect of 5
aerosols is highly variable – aerosols that scatter have a cooling or negative forcing ef-fect whereas absorbing aerosols have a warming or positive forcing effect (Bergstrom et al., 2002). SSA is the ratio of scattering to total extinction. SSA determines whether the radiative forcing of aerosols is negative or positive whereas the phase function and the AOD determine the magnitude of the forcing. A low value of SSA implies a high level 10
of absorption, and conversely a high value of SSA implies a high degree of scattering and a low level of absorption (Dubovik et al., 2002). In addition to the direct effect, the value of SSA can also have an impact on cloud formation. The INDOEX experi-ment demonstrated that solar absorption by aerosols reduced day time cloud coverage over the Indian Ocean (Ackerman et al., 2000). According to Kazadzis et al. (2010), 15
SSA may be the most significant uncertainty in current modelling of how aerosol forc-ing affects the climate. Recent reviews of retrieval of aerosol properties from existing satellites are found in Kokhanovsky and DeLeeuw (2009), Kokhanovsky et al. (2010), de Leeuw et al. (2013) and Holzer-Popp et al. (2013).
As part of the Global Monitoring for Environment and Security (GMES) programme, 20
the European Space Agency (ESA) is expected to launch the first two Sentinel-3 satel-lites before the end of 2015 (ESA-Earth-Online, 2014). The Sea and Land Surface Temperature Radiometer (SLSTR) and Ocean and Land Colour Instrument (OLCI) on Sentinel-3 are an improvement on the Advanced Along Track Scanning Radiometer (AATSR) and the Medium Resolution Imaging Spectrometer (MERIS) on the ENVISAT 25
AMTD
7, 5381–5422, 2014Synergistic aerosol estimation from simulated Sentinel-3
data
W. H. Davies and P. R. J. North
Title Page
Abstract Introduction
Conclusions References
Tables Figures
◭ ◮
◭ ◮
Back Close
Full Screen / Esc
Printer-friendly Version Interactive Discussion
Discussion
P
a
per
|
Discus
sion
P
a
per
|
Discussion
P
a
per
|
Discussion
P
a
per
|
spectral and angular information from MERIS and AATSR on ENVISAT (North et al., 2008, 2010), and OLCI and SLSTR on Sentinel-3 (North and Heckel, 2012).
Here we develop and test an experimental method for estimating AOD, FMF and SSA from simulated Sentinel-3 and real CHRIS data. The method explores the synergistic use of both SLSTR and OLCI using the multi-angle method and a spectral method re-5
spectively to provide more constraints for the retrieval (North et al., 2008). The method is tested using the 6S radiative transfer model (Vermote et al., 1997a) to generate sim-ulated Sentinel-3 Top Of Atmosphere (TOA) radiances. Real CHRIS data are used to simulate Sentinel-3 data, and ground based sun-photometer measurements are used to validate the method. Unless stated otherwise, all AOD values are at 0.55 µm and all 10
SSA values are at 0.87 µm.
2 Satellite instruments
2.1 SLSTR/Sentinel-3
Like AATSR, SLSTR is a dual-angle instrument with a nadir view and an oblique view at an angle of approximately 55◦ through the atmosphere. However on SLSTR the
15
oblique view is to the rear to allow both SLSTR and OLCI to have a clear view to the sun for calibration purposes. It has a nadir swath of 1400 km and a dual view swath of 740 km. There is an improved spatial resolution of 500 m in the visible and Short Wave InfraRed (SWIR) channels and an additional band useful for aerosol retrieval centered at 2.25 µm. There is also an additional channel centered at 1.375 µm but this 20
AMTD
7, 5381–5422, 2014Synergistic aerosol estimation from simulated Sentinel-3
data
W. H. Davies and P. R. J. North
Title Page
Abstract Introduction
Conclusions References
Tables Figures
◭ ◮
◭ ◮
Back Close
Full Screen / Esc
Printer-friendly Version Interactive Discussion
Discussion
P
a
per
|
Discus
sion
P
a
per
|
Discussion
P
a
per
|
Discussion
P
a
per
|
2.2 OLCI/Sentinel-3
OLCI is a push-broom instrument with 21 spectral channels covering the same range as MERIS with a spatial resolution of 300 m. Only 18 bands are used in the retrieval – the bands centred at the following wavelengths are excluded because of atmospheric absorption: 764.375 nm, 767.5 nm and 940 nm. The bands used are listed in Table 1. 5
There is an improved global coverage compared to MERIS of less than 4 days over ocean and less than 3 days over land (assuming only 1 satellite). The swath of 1270 km overlaps with SLSTR which facilitates synergistic retrieval and is tilted westwards to mit-igate contamination from sun-glint. Calibration is performed at the southern terminator crossing with dark current calibration and radiometric calibration in the first orbit in se-10
quence and then in the following orbit dark current calibration and spectral calibration (Donlon et al., 2012).
2.3 CHRIS/PROBA-1
CHRIS is a multi-angle instrument which acquires images at a high spatial resolution (17 or 34 m), and is a hyper-spectral instrument offering a subset of 18 to 62 spectral 15
bands in the optical region between 400 and 1050 nm. CHRIS acquires up to 5 images of the target area with a swath width of 13 km. The viewing zenith angles are nominally given as 55◦and 36◦ in the backwards and forwards direction, and at nadir. There are a range of modes of data that can be selected for specific applications (Davies et al., 2010). In this data set, only modes 1 and 5 are used – mode 5 for the Gilching site and 20
mode 1 for all the other target sites. The 18 bands used are listed in Table 1.
The reliability of the radiance measurements from the CHRIS instrument are de-pendent on a number of sources of uncertainty. This uncertainty in the satellite values, combined with the uncertainty in the retrieval process is transmitted through to errors in the properties that are to be estimated. One such source of instrument uncertainty is re-25
AMTD
7, 5381–5422, 2014Synergistic aerosol estimation from simulated Sentinel-3
data
W. H. Davies and P. R. J. North
Title Page
Abstract Introduction
Conclusions References
Tables Figures
◭ ◮
◭ ◮
Back Close
Full Screen / Esc
Printer-friendly Version Interactive Discussion
Discussion
P
a
per
|
Discus
sion
P
a
per
|
Discussion
P
a
per
|
Discussion
P
a
per
|
earth’s rotation and calibration errors on inertia ratio and wheel axis which affect the accuracy of the pointing during the acquisition (Davidson and Vuilleumier, 2004). Ra-diometric uncertainties for this push-broom instrument come from the response of the Charge Coupled Device (CCD), the telescope and the spectrometer. There is also the effect of instrument temperature on the width of the slit (Gómez-Chova et al., 2008). 5
Other causes of calibration problems are the mirror distortions which affect the spatial resolution, temperature related changes in the prism refractive index, and non uniform response from the Solar Calibration Device (SCD) (Cutter and Lobb, 2004). An exam-ple CHRIS image over Lake Argyle, Australia is displayed in Fig. 1.
3 Retrieval method
10
3.1 Overview
The retrieval is an iterative process: (1) The TOA Radiance measurements are trans-formed using 6S (Vermote et al., 1997a), along with an estimated value for the aerosol properties, to estimate surface reflectance. (2) An error metric is calculated based on fit of this surface reflectance set (Rsurf) to a model of idealised land surface angular and
15
spectral variation. (3) The aerosol estimate is refined, and steps 1 and 2 repeated until convergence, based on minimisation of the error metric.
3.2 Multi-angle model
The model – Eq. (1), is developed and justified in North et al. (1999). The inversion requires a minimum of two view angles, and a minimum of two wavelengths, but may 20
be applied to the full set of CHRIS viewing angles and any waveband set (Davies et al., 2010).
Rang(λ,θv)=(1−D(λ))P(θv)ω(λ)+
γω(λ)
AMTD
7, 5381–5422, 2014Synergistic aerosol estimation from simulated Sentinel-3
data
W. H. Davies and P. R. J. North
Title Page
Abstract Introduction
Conclusions References
Tables Figures
◭ ◮
◭ ◮
Back Close
Full Screen / Esc
Printer-friendly Version Interactive Discussion
Discussion
P
a
per
|
Discus
sion
P
a
per
|
Discussion
P
a
per
|
Discussion
P
a
per
|
where
g=(1−γ)ω(λ)
λis the wavelength,θvthe view direction,ω(λ) the Lambertian scattering albedo,P(θv)
the aggregate single scattering phase function,D(λ) is the fraction of downwelling dif-5
fuse light and γ represents the probability of escape from the surface without further scattering. The set of free parametersω(λ) andP(θv) are found by inversion.
3.3 Spectral model
Here we extend the method to make use of spectral information in addition to angular. For single angle viewing we use a spectral signature to isolate the aerosol scatter-10
ing from the surface reflectance. We identify a set of surfaces with known reflectance and assuming an atmospheric profile, we fit the atmospherically corrected surface re-flectance with the assumed target rere-flectance. Similar approaches have been used in aerosol retrieval for CHRIS (Guanter et al., 2005) and for MERIS (North et al., 2008; von Hoyningen-Huene et al., 2011).
15
The assumed target reflectance is represented as a linear mixture of a set of spectra:
Rspec(λ)=cvgρvg(λ)+cvdρvd(λ)+cvoρvo(λ)+csρs(λ)+caρa(λ) (2)
wherecvgis the fractional coverage of green vegetation andρvg is the corresponding
surface reflectance of the input spectra and is a function of wavelength. Similarly,cvd
20
and ρvd are the fractional coverage and spectra for dry grass, cvo and ρvo for other vegetation,csandρsfor soil andcaandρafor arid soil (Baldridge et al., 2009; Vermote
et al., 1997a). The OLCI spectra are listed in Table 3, and CHRIS spectra in Table 4. The metric for the single angle spectral retrieval is given by Eq. (3).
Espec=
P18
λ=1wλ[Rsurf(λ)−ρspec(λ)] 2
P18
λ=1wλ
AMTD
7, 5381–5422, 2014Synergistic aerosol estimation from simulated Sentinel-3
data
W. H. Davies and P. R. J. North
Title Page
Abstract Introduction
Conclusions References
Tables Figures
◭ ◮
◭ ◮
Back Close
Full Screen / Esc
Printer-friendly Version Interactive Discussion
Discussion
P
a
per
|
Discus
sion
P
a
per
|
Discussion
P
a
per
|
Discussion
P
a
per
|
where λ is the wavelength and wλ is the per-band weighting factor. The per-band
weighting factor values are normalised according to Eq. (4). By experiment, lowest error was found with a weighting of of 1.5/18 for the first wavelength, and a compen-sating 0.5/18 for the last (infra red) wavelength, and unity for all other wavelengths.
18
X
λ=1
wλ=1 (4)
5
3.4 Surface reflectance estimation
The estimated surface reflectance (Rsurf) is calculated from the TOA radiance
mea-surements at each iteration using a look-up table (LUT) of coefficients determined by 6S, and using aerosol properties determined under the ESA Aerosol CCI definitions 10
(de Leeuw et al., 2013).
3.4.1 Atmospheric LUT coefficients
The calculation to determine surface reflectance from top of atmosphere radiance uses Eqs. (5) and (6) (Vermote et al., 1997b).
y=xa·Itoa−xb (5)
15
Rsurf=y/[1.0+xc·y] (6)
where Itoa is the TOA radiance, Rsurf is the atmospherically corrected surface
re-flectance,xa, xb, and xc are calculated by 6S as part of the atmospheric correction process.xais the coefficient for converting between radiance and reflectance.xbis the
20
AMTD
7, 5381–5422, 2014Synergistic aerosol estimation from simulated Sentinel-3
data
W. H. Davies and P. R. J. North
Title Page
Abstract Introduction
Conclusions References
Tables Figures
◭ ◮
◭ ◮
Back Close
Full Screen / Esc
Printer-friendly Version Interactive Discussion
Discussion
P
a
per
|
Discus
sion
P
a
per
|
Discussion
P
a
per
|
Discussion
P
a
per
|
3.4.2 Uncertainty estimate
The uncertainty inRsurf is given by Eq. (7). From Eqs. (5) and (6) we get Eqs. (8) and
(9). Taking the derivative of Eq. (8) with respect toItoawe get Eq. (10) whereM is given
by Eq. (11).
δRsurf=
δR
surf
δItoa
δItoa (7)
5
Rsurf=
xaItoa−xb
1+xc(xaItoa−xb)
(8)
Itoa=
Rsurf
xa(1−xcRsurf)
+xxb
a
(9)
σsurf2 = x
2
a
M4σ 2
i (10)
M=1+xc(xaItoa−xb) (11)
10
Ifσi is the standard deviation of the error in the TOA radiance measurements then the fractional error inItoais given by Eq. (12) (βi has the value 0.05 for CHRIS).
βi = σi
Itoa
(12)
Substituting forσi we get Eq. (13).
15
σsurf2 =βi2x
2
a
M4I 2
toa (13)
3.4.3 Aerosol model set
AMTD
7, 5381–5422, 2014Synergistic aerosol estimation from simulated Sentinel-3
data
W. H. Davies and P. R. J. North
Title Page
Abstract Introduction
Conclusions References
Tables Figures
◭ ◮
◭ ◮
Back Close
Full Screen / Esc
Printer-friendly Version Interactive Discussion
Discussion
P
a
per
|
Discus
sion
P
a
per
|
Discussion
P
a
per
|
Discussion
P
a
per
|
a reference wavelength (0.55 µm) and three components of aerosol mixture (the fourth component is implicit since all four must sum to 100 %). The four components are non-spherical dust, sea salt, weakly absorbing and strongly absorbing (de Leeuw et al., 2013). A full grid of AOD and mixture values in steps of 20 % is used in a LUT based approach giving a total of 560 points. The log-normal parameters and their associated 5
mid-visible indices of refraction are listed in Table 2. Ten values of AOD are used from 0.01 to 0.46 in intervals of 0.05 – the range has been chosen to enclose that from the CHRIS data set. The retrieval process iterates through all the values in the grid, and the AOD/mix with the best fit is the solution.
For the CHRIS multi-angle viewing, the least-squares method is modified in order 10
to take account of the need to propagate the uncertainties through to the resulting estimates. The approach of Diner et al. (2008) is adopted for the modified error metric which is given by Eq. (15).
3.5 Retrieval of surface reflectance and aerosol
An iterative search for the optimum aerosol model and optical depth is performed, 15
by minimising the difference between the modeled and measured surface reflectance using a metric combining the angular and spectral constraints:
Rmod=Rang+kRspec (14)
For a given aerosol model, the Powell and Brent methods (Press et al., 1992) are used 20
to determine the parameters which minimise the constraint (15) such thatEmin is the
minimised value ofEmod.
Emod= 5
X
θv=1 18
X
λ=1
[Rsurf(λ,θv)−Rmod(λ,θv)] 2
σsurf2+σ mod2
(15)
whereλ is the wavelength andθv the view direction, and σsurf 2
is given by Eq. (13). 25
AMTD
7, 5381–5422, 2014Synergistic aerosol estimation from simulated Sentinel-3
data
W. H. Davies and P. R. J. North
Title Page
Abstract Introduction
Conclusions References
Tables Figures
◭ ◮
◭ ◮
Back Close
Full Screen / Esc
Printer-friendly Version Interactive Discussion
Discussion
P
a
per
|
Discus
sion
P
a
per
|
Discussion
P
a
per
|
Discussion
P
a
per
|
The error variance at each view angle/wavelength combination is given by Eq. (16).
σmod2 =1n
n
X
s=1
[Rsim(λ,θv,s)−Rmod(λ,θv,s)] 2
(16)
wheren=36, giving estimates of σmod2 for each view angle/wavelength combination. For synergistic retrieval, the spectral and angular retrievals are run separately as a first 5
iteration in order to calculate a normalising scaling factork giving equal weighting to anglar and spectral metrics.
3.6 Error estimate in AOD
Values of the error metric Emod bounding the minimum value are used to compute
a parabolic fit, represented by the coefficients in Eq. (17) (Diner et al., 2008). 10
ln (Emod)=A+Bτ+Cτ2 (17)
and the uncertainty (στ) in τbest – the value of AOD that minimises Emod is given by
Eq. (18) (Diner et al., 2008).
στ=
v u u tln
1+E1
min
C (18)
15
The uncertainty in the retrieved mixture is calculated using the associated SSA value. Eqs. (17) and (18) are used again but substituting SSA for AOD. The uncertainty val-ues for SSA are also used for the FMF estimates calculated from the same retrieved mixture.
AMTD
7, 5381–5422, 2014Synergistic aerosol estimation from simulated Sentinel-3
data
W. H. Davies and P. R. J. North
Title Page
Abstract Introduction
Conclusions References
Tables Figures
◭ ◮
◭ ◮
Back Close
Full Screen / Esc
Printer-friendly Version Interactive Discussion
Discussion
P
a
per
|
Discus
sion
P
a
per
|
Discussion
P
a
per
|
Discussion
P
a
per
|
4 Test datasets
4.1 Simulated data
Simulated data were generated to provide an initial test of the inversion. Simulated SLSTR and OLCI TOA radiances are generated by running 6S in forward mode using the 560 sets of AOD/mix, other parameters for the simulation are as follows with the 5
geometry taken from one of the CHRIS image sets: Solar Zenith Angle (SZA) – 15.1◦,
Solar Azimuth Angle (SAA) – 95.3◦, View Zenith Angle (VZA) – 7.25◦ for nadir, and 55◦ for the oblique view, View Azimuth Angle (VAA) – 316.12◦, month – 11, day – 9, atmosphere – Tropical, altitude – 150 m and surface type – lambertian vegetation. The bands are listed in Table 1. The AOD, FMF and SSA values from the retrieval 10
(Estimated AOD, FMF or SSA) are compared with the values from the generation of each TOA set (True AOD, FMF or SSA).
4.2 CHRIS data
Twenty two image sets were used from six different sites These are listed in Table 5 together with the number of image sets processed from that site, the type of land cover, 15
the aerosol model used in the original method, the date range of the sets and the range of AOD as measured by the photometers (Davies et al., 2010). A subset of 18 bands from CHRIS were chosen to correspond with a subset of the bands from OLCI and SLSTR, and are listed in Table 1.
This represents all available archived CHRIS data suitable for testing. Further image 20
sets were rejected for a variety of reasons: (i) no AERONET time/space coincidence; (ii) no acquisition of multi-angular data (iii) adequate meta-data for view geometry (iv) insufficient co-registered, cloud-free pixels visible in all views. (v) In addition, for testing FMF and SSA, the AOD at 440 nm must be>0.2. (vi) No retrieval was also made if the retrieval failed theEmin threshold test. (vii) For use of the spectral constraint, a further
AMTD
7, 5381–5422, 2014Synergistic aerosol estimation from simulated Sentinel-3
data
W. H. Davies and P. R. J. North
Title Page
Abstract Introduction
Conclusions References
Tables Figures
◭ ◮
◭ ◮
Back Close
Full Screen / Esc
Printer-friendly Version Interactive Discussion
Discussion
P
a
per
|
Discus
sion
P
a
per
|
Discussion
P
a
per
|
Discussion
P
a
per
|
threshold of mean NDVI>0.4 was used to isolated vegetated or partially vegetated scenes.
5 Results
5.1 AOD from simulated data
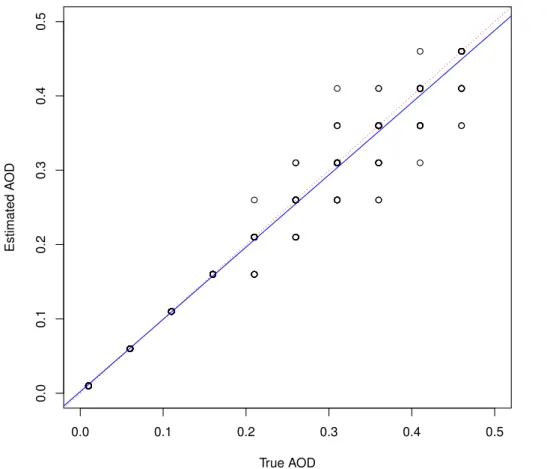
The AOD values retrieved from each of the 560 TOA radiance sets using the synergy 5
method are compared with the true values in Fig. 3. The red dotted line represents where the 1 : 1 relationship would be, and the blue solid line represents the fitted trend line. The RMSE between true and estimated values is 0.03 andr2is 0.97. The regres-sion coefficients are 0.97 for the slope and 0.002 for the offset.
The FMF value retrieved from each of the 560 TOA radiance sets using the syner-10
gistic retrieval method is compared with the true values in Fig. 4. The RMSE between true and estimated values is 0.11 andr2is 0.86. The regression coefficients are 0.93 for the slope and 0.04 for the offset.
The SSA values from the synergistic retrieval are compared with the true values in Fig. 5. The RMSE between true and estimated values is 0.02 andr2 is 0.77. The 15
regression coefficients are 0.88 for the slope and 0.11 for the offset.
An example of retrieved surface reflectance values from one of the 560 sets are displayed in Fig. 11, following successful aerosol retrieval. The simulated reflectances generated are marked in red and the retrieved reflectances are marked in blue, shown at all OLCI and SLSTR wavelengths.
20
5.2 AOD from CHRIS data
AMTD
7, 5381–5422, 2014Synergistic aerosol estimation from simulated Sentinel-3
data
W. H. Davies and P. R. J. North
Title Page
Abstract Introduction
Conclusions References
Tables Figures
◭ ◮
◭ ◮
Back Close
Full Screen / Esc
Printer-friendly Version Interactive Discussion
Discussion
P
a
per
|
Discus
sion
P
a
per
|
Discussion
P
a
per
|
Discussion
P
a
per
|
performed, where image sets are rejected if the mean NDVI is less than 0.4. A second set of results are displayed with 9 image sets where the mean NDVI is greater than 0.4. For comparison, the AOD estimates from the original method Davies et al. (2010), which uses a version of the angular constraint only, and a standard 6S model set (Vermote et al., 1997a) are also displayed in Fig. 2.
5
5.2.1 All sites
The AOD value for each of the CHRIS image sets using only the angular method is compared with the ground based photometer readings in Fig. 6. The RMSE between photometer and CHRIS retrievals is 0.07 andr2 is 0.58. The regression coefficients are 0.81 for the slope and 0.002 for the offset. The mean AOD for the CHRIS dataset 10
is 0.09 for the 22 image sets which compares with the photometer mean AOD of 0.11. The AOD value for each of the CHRIS image sets using only the spectral method is compared with the ground based photometer readings in Fig. 8. However over this dataset, no correlation is shown (r2is 0). The mean AOD for the CHRIS dataset is 0.13 for the 22 image sets which compares with the photometer mean AOD of 0.11.
15
The AOD value for each of the CHRIS image sets using the synergistic method is compared with the ground based photometer readings in Fig. 10. The RMSE between photometer and CHRIS retrievals is 0.06 andr2is 0.65 The regression coefficients are 0.90 for the slope and−0.008 for the offset. The mean AOD for the CHRIS dataset is 0.09 for the 22 image sets which compares with the photometer mean AOD of 0.11. 20
5.2.2 Vegetated sites
AMTD
7, 5381–5422, 2014Synergistic aerosol estimation from simulated Sentinel-3
data
W. H. Davies and P. R. J. North
Title Page
Abstract Introduction
Conclusions References
Tables Figures
◭ ◮
◭ ◮
Back Close
Full Screen / Esc
Printer-friendly Version Interactive Discussion
Discussion
P
a
per
|
Discus
sion
P
a
per
|
Discussion
P
a
per
|
Discussion
P
a
per
|
the offset. The mean AOD for the CHRIS dataset is 0.08 for the 9 image sets which compares with the photometer mean AOD of 0.09.
Using the spectral constraint only on this dataset shows The RMSE between pho-tometer and CHRIS retrievals is 0.06 andr2 is 0.44, shown in Fig. 9. The regression coefficients are 0.57 for the slope and 0.007 for the offset. The mean AOD for the 5
CHRIS dataset is 0.06 for the 9 image sets which compares with the photometer mean AOD of 0.09.
Results for the synergistic constraint are shown in Fig. 14. The RMSE between pho-tometer and CHRIS retrievals is 0.03 andr2is 0.89. The regression coefficients are 1.2 for the slope and−0.02 for the offset. The mean AOD for the CHRIS dataset is 0.08 for 10
the 9 image sets which compares with the photometer mean AOD of 0.09.
An example of the retrieved multi-angle surface reflectance values (672 and 868 nm) from one of the image sets that passes the NDVI threshold test is shown in Fig. 12. The image set lg41c8 was aquired over Lake Argyle, Australia on 5 June 2004. The SZA is 44◦and the Relative Azimuth (RA) ranges from−153◦to+9◦. The retrieved spectral 15
surface reflectance values (nadir view) from a second image set that passes the NDVI threshold test are displayed in Fig. 13, along with the fitted reflectance from the mixture model. The image set ln3a16 was aquired over Lanai, Hawaii on 10 November 2003. The percentage of the various surface types in the model that gave the best fit for this Region Of Interest (ROI) were as follows: 94 % green vegetation, 4 % soil and 2 % dry 20
grass. This ROI produced an overestimation of AOD (0.21 compared to an estimate of 0.06 from Aeronet). The spike is in the 760 nm oxygen absorption band.
5.3 FMF from CHRIS data
The FMF value for each of the CHRIS image sets, over the full dataset, calculated from the estimated mixture using the synergistic method is compared with the AERONET 25
estimates in Fig. 15. The RMSE between photometer and CHRIS retrievals is 0.49 and
AMTD
7, 5381–5422, 2014Synergistic aerosol estimation from simulated Sentinel-3
data
W. H. Davies and P. R. J. North
Title Page
Abstract Introduction
Conclusions References
Tables Figures
◭ ◮
◭ ◮
Back Close
Full Screen / Esc
Printer-friendly Version Interactive Discussion
Discussion
P
a
per
|
Discus
sion
P
a
per
|
Discussion
P
a
per
|
Discussion
P
a
per
|
with the photometer mean FMF of 0.59. Thresholding for high NDVI and optical depth yielded only 2 image sets suitable for testing – the image set from Gilching (gc) with the image id 415a resulted in an estimate for the FMF as 1.0±0.13, compared to the Aeronet estimate of 0.82±0.11. The image set from Mexico City (mc) with id 3ae3 gave a retrieved estimate of 1.0±0.49 compared to Aeronet estimate of 0.85±0.13.
5
5.4 SSA from CHRIS data
The SSA value for each of the CHRIS image sets, calculated from the estimated mix-ture using the synergistic method is compared with the AERONET estimates in Fig. 16, and shows no correlation, with an RMSE between photometer and CHRIS retrievals of 0.24. The mean SSA for the CHRIS dataset is 0.97 for the 19 image sets which com-10
pares with the photometer mean SSA of 0.80. Thresholding on high NDVI and optical depth yielded only one suitable site with Aeronet data, Mexico City (mc3ae3). Here the satellite retrieval estimated the SSA as 0.95±0.63 compared to the Aeronet estimate of 0.77±0.05.
6 Discussion
15
The results from the synergistic retrieval of AOD displayed in Fig. 10 show that this extended method is an improvement over the original method (Fig. 2) with an RMSE/r2
of 0.06/0.65 compared to 0.09/0.60 for the original method.
The results from the spectral retrieval of AOD displayed in Fig. 8 show that the ad-dition of spectral constraint does not provide useful information over all surface types. 20
AMTD
7, 5381–5422, 2014Synergistic aerosol estimation from simulated Sentinel-3
data
W. H. Davies and P. R. J. North
Title Page
Abstract Introduction
Conclusions References
Tables Figures
◭ ◮
◭ ◮
Back Close
Full Screen / Esc
Printer-friendly Version Interactive Discussion
Discussion
P
a
per
|
Discus
sion
P
a
per
|
Discussion
P
a
per
|
Discussion
P
a
per
|
The poor results from the retrieval of FMF and SSA on the full dataset are consistent with the expectation that the filtering out of both low AOD and low NDVI scenes is required for retrieval of further aerosol properties than AOD. It should also be noted that the lowest possible SSA for 100 % strongly absorbing is 0.74 whereas 4 of the Aeronet estimates of SSA in this data set are below this value. Further research is 5
recommended to identify CHRIS image sets that have a higher AOD and NDVI and to experiment with different values of refractive index for strongly absorbing aerosols. Finally it should be noted that only a subset of Sentinel-3 spectral bands were available from CHRIS, and improved results are expected by including wavebands beyond 1 µm.
7 Conclusions
10
A method for estimating AOD, FMF, SSA and their uncertainties from CHRIS/PROBA-1 images using Sentinel-3 bands for the spectral retrieval has been developed and tested on 22 image sets from 6 sites for AOD and FMF and 19 image sets from 5 sites for SSA. The method retrieves the mix of aerosol components using non-spherical dust, sea salt, weakly absorbing and strongly absorbing.
15
Estimates of AOD from this extended method with four unknowns and the improved aerosol models were compared to the AOD estimates using the standard 6S models with one unknown (Davies et al., 2010). The results are an improvement to the previous estimates with an RMSE of 0.06 andr2of 0.65 for the extended method, compared to 0.09 and 0.60 respectively for the previous method. The RMSE is 0.03 for the screened 20
image sets where the mean NDVI is greater than 0.4 and ther2is 0.89. AOD from the simulated data has an RMSE of 0.03 and anr2of 0.97.
Results from simulated data show an RMSE of 0.11 and r2 is 0.86 for FMF and an RMSE of 0.02 in SSA with an r2 of 0.77 from 560 TOA radiance sets, with re-sults improving at higher optical depth. However rere-sults from CHRIS data over the full 25
AMTD
7, 5381–5422, 2014Synergistic aerosol estimation from simulated Sentinel-3
data
W. H. Davies and P. R. J. North
Title Page
Abstract Introduction
Conclusions References
Tables Figures
◭ ◮
◭ ◮
Back Close
Full Screen / Esc
Printer-friendly Version Interactive Discussion
Discussion
P
a
per
|
Discus
sion
P
a
per
|
Discussion
P
a
per
|
Discussion
P
a
per
|
retrieval of aerosol properties. Further research is therefore recommended to examine the retrieval of aerosol propreties over higher AOD values and over vegetated surfaces, and to explore the performance using different models of aerosol aerosol properties and surface spectra.
The Supplement related to this article is available online at 5
doi:10.5194/amtd-7-5381-2014-supplement.
Acknowledgements. This work was supported by the NERC National Centre for Earth Obser-vation, and by the European Space Agency. The authors would also like to thank the following: the AERONET principal investigators and their stafffor establishing and maintaining the sites used in this investigation; ESA for providing the CHRIS data, and JeffSettle for discussion of
10
error estimation.
References
Ackerman, A. S., Toon, O. B., Stevens, D. E., Heymsfield, A. J., Ramanathan, V., and Wel-ton, E. J.: Reduction of tropical cloudiness by soot, Science, 288, 1042–1047, 2000. 5383 Baldridge, A. M., Hook, S. J., Grove, C. I., and Rivera, G.: The ASTER spectral library version
15
2.0, Remote Sens. Environ., 113, 711–715, 2009. 5387, 5404, 5405
Bergstrom, R. W., Russell, P. B., and Hignett, P.: Wavelength dependence of the absorption of black carbon particles: predictions and results from the TARFOX experiment and implications for the aerosol single scattering albedo, J. Atmos. Sci., 59, 567–577, 2002. 5383
Bevan, S. L., North, P. R., Los, S. O., and Grey, W. M.: A global dataset of atmospheric aerosol
20
optical depth and surface reflectance from AATSR, Remote Sens. Environ., 116, 199–210, 2012. 5383
Cutter, M. A.: CHRIS Data Format, Sira Technology Ltd., Kent, UK, 4.2 edn., 2005. 5402 Cutter, M. A. and Lobb, D. R.: Design of the compact high-resolution imaging
spectrome-ter (CHRIS), and future developments, available at: http://envisat.esa.int/pub/ESA_DOC/
25
AMTD
7, 5381–5422, 2014Synergistic aerosol estimation from simulated Sentinel-3
data
W. H. Davies and P. R. J. North
Title Page
Abstract Introduction
Conclusions References
Tables Figures
◭ ◮
◭ ◮
Back Close
Full Screen / Esc
Printer-friendly Version Interactive Discussion
Discussion
P
a
per
|
Discus
sion
P
a
per
|
Discussion
P
a
per
|
Discussion
P
a
per
|
Davidson, M. and Vuilleumier, P.: Note on CHRIS acquisition procedure and image geometry, available at: http://earth.esa.int/pub/ESA_DOC/CHRIS_acquisition-procedure_ image-geometry_rev1_3.pdf (last access: 25 April 2014), 2004. 5386
Davies, W. H., North, P. R. J., Grey, W. M. F., and Barnsley, M. J.: Improvements in aerosol optical depth estimation using multiangle CHRIS/PROBA images, IEEE T. Geosci. Remote,
5
48, 18–24, 2010. 5383, 5385, 5386, 5389, 5392, 5394, 5397
de Leeuw, G., Holzer-Popp, T., Bevan, S. L., Davies, W. H., Descloitres, J., Graigner, R. G., Griesfeller, J., Heckel, A., von Hoyningen Huene, W., Kinne, S., Klüser, L., Kolmonen, P., Litvi-nov, P., Martynenko, D., North, P. R. J., Ovigneur, B., Poulsen, C. A., Ramon, D., Schulz, M., Siddans, R., Sogacheva, L., Tanré, D., Thomas, G. E., Timo, H., Vountas, M., and Pinnock, S.:
10
Evaluation of seven European aerosol optical depth retrieval algorithms for climate analysis, Remote Sens. Environ., doi:10.1016/j.rse.2013.04.023, online first, 2013. 5383, 5388, 5390, 5403
Diner, D. J., Abdou, W., Ackerman, T. P., Crean, K., Gordon, H. R., Kahn, R. A., Martonchik, J. V., McMuldroch, S., Paradise, S. R., Pinty, B., Verstraete, M. M., Wang, M., and West, R. A.:
15
MISR Level 2 Aerosol Retrieval Algorithm Theoretical Basis, available at: http://eospso. gsfc.nasa.gov/eos_homepage/for_scientists/atbd/docs/MISR/atbd-misr-09.pdf (last access: 25 April 2014), 2008. 5390, 5391
Donlon, C., Berruti, B., Buongiorno, A., Ferreira, M.-H., Féménias, P., Frerick, J., Goryl, P., Klein, U., Laur, H., Mavrocordatos, C., Nieke, J., Rebhan, H., Seitz, B., Stroede, J., and
20
Sciarra, R.: The Global Monitoring for Environment and Security (GMES) Sentinel-3 mission, Remote Sens. Environ., 120, 37–57, 2012. 5383, 5384, 5385, 5402
Dubovik, O., Holben, B. N., Eck, T. F., Smirnov, A., Kaufman, Y. J., King, M. D., Tanré, D., and Slutsker, I.: Variability of absorption and optical properties of key aerosol types observed in worldwide locations, J. Atmos. Sci., 59, 590–608, 2002. 5383
25
ESA-Earth-Online: Sentinel-3, available at: http://earth.esa.int/web/guest/missions/ esa-future-missions/sentinel-3 (last access: 5 March 2014), 2014. 5383
GCOS, G. C. O. S.: Systematic Observation Requirements for Satellite-based Products for Cli-mate, available at: http://www.wmo.int/pages/prog/gcos/Publications/gcos-107.pdf (last ac-cess: 5 March 2014), 2006. 5382
30
AMTD
7, 5381–5422, 2014Synergistic aerosol estimation from simulated Sentinel-3
data
W. H. Davies and P. R. J. North
Title Page
Abstract Introduction
Conclusions References
Tables Figures
◭ ◮
◭ ◮
Back Close
Full Screen / Esc
Printer-friendly Version Interactive Discussion
Discussion
P
a
per
|
Discus
sion
P
a
per
|
Discussion
P
a
per
|
Discussion
P
a
per
|
Guanter, L., Alonso, L., and Moreno, J.: A method for the surface reflectance retrieval from PROBA/CHRIS data over land: application to ESA SPARC campaigns, IEEE T. Geosci. Re-mote, 43, 2908–2917, 2005. 5387
Holzer-Popp, T., de Leeuw, G., Griesfeller, J., Martynenko, D., Klüser, L., Bevan, S., Davies, W., Ducos, F., Deuzé, J. L., Graigner, R. G., Heckel, A., von Hoyningen-Hüne, W., Kolmonen, P.,
5
Litvinov, P., North, P., Poulsen, C. A., Ramon, D., Siddans, R., Sogacheva, L., Tanre, D., Thomas, G. E., Vountas, M., Descloitres, J., Griesfeller, J., Kinne, S., Schulz, M., and Pin-nock, S.: Aerosol retrieval experiments in the ESA Aerosol_cci project, Atmos. Meas. Tech., 6, 1919–1957, doi:10.5194/amt-6-1919-2013, 2013. 5382, 5383
IPCC: Climate Change 2013: The Physical Science Basis. Contribution of Working Group I
10
to the Fifth Assessment Report of the Intergovernmental Panel on Climate Change, edited by: Stocker, T. F., Qin, D., Plattner, G. K., Tignor, M., Allen, S. K., Boschung, J., Nauels, A., Xia, Y., Bex, V., and Midgley, P. M., Cambridge University Press, Cambridge, UK, New York, NY, USA, 2013. 5382, 5383
Kazadzis, S., Gröbner, J., Arola, A., and Amiridis, V.: The effect of the global UV irradiance
15
measurement accuracy on the single scattering albedo retrieval, Atmos. Meas. Tech., 3, 1029–1037, doi:10.5194/amt-3-1029-2010, 2010. 5383
Kokhanovsky, A. A. and DeLeeuw, G.: Satellite Aerosol Remote Sensing over Land, Springer Praxis Books, Heidelberg, 2009. 5383
Kokhanovsky, A. A., Deuzé, J. L., Diner, D. J., Dubovik, O., Ducos, F., Emde, C., Garay, M. J.,
20
Grainger, R. G., Heckel, A., Herman, M., Katsev, I. L., Keller, J., Levy, R., North, P. R. J., Prikhach, A. S., Rozanov, V. V., Sayer, A. M., Ota, Y., Tanré, D., Thomas, G. E., and Zege, E. P.: The inter-comparison of major satellite aerosol retrieval algorithms using sim-ulated intensity and polarization characteristics of reflected light, Atmos. Meas. Tech., 3, 909–932, doi:10.5194/amt-3-909-2010, 2010. 5383
25
North, P. and Heckel, A.: Sentinel-3 L2 Products and Algorithm Definition: SYN Algorithm Theoretical Basis Document S3-L2-SD-03-S02-ATBD, available at: https://earth.esa.int/ documents/247904/349589/SYN_L2-3_ATBD.pdf (last access: 28 May 2014), 2012. 5384 North, P., Brockmann, C., Fischer, J., Gomez-Chova, L., Grey, W., Heckel, A., Moreno, J.,
Preusker, R., and Regner, P.: MERIS/AATSR synergy algorithms for cloud screening, aerosol
30
AMTD
7, 5381–5422, 2014Synergistic aerosol estimation from simulated Sentinel-3
data
W. H. Davies and P. R. J. North
Title Page
Abstract Introduction
Conclusions References
Tables Figures
◭ ◮
◭ ◮
Back Close
Full Screen / Esc
Printer-friendly Version Interactive Discussion
Discussion
P
a
per
|
Discus
sion
P
a
per
|
Discussion
P
a
per
|
Discussion
P
a
per
|
North, P., Grey, W., Heckel, A., Fischer, J., Preusker, R., and Brockmann, C.: MERIS/AATSR Synergy: Land Aerosol and Surface Reflectance Algorithm Theoretical Basis Docu-ment (ATBD), available at: http://github.com/downloads/bcdev/beam-meris-aatsr-synergy/ synergy-land_aerosol-atbd.pdf (last access: 28 May 2014), 2010. 5384
North, P. R. J.: Estimation of aerosol opacity and land surface bidirectional reflectance from
5
ATSR-2 dual-angle imagery: operational method and validation, J. Geophys. Res., 107, doi:10.1029/2000JD000207, AAC4-1–AAC4-10, 2002. 5383
North, P. R. J., Briggs, S. A., Plummer, S. E., and Settle, J. J.: Retrieval of land surface bidi-rectional reflectance and aerosol opacity from ATSR-2 multi-angle imagery, IEEE T. Geosci. Remote, 37, 526–537, 1999. 5386
10
Press, W. H., Teukolsky, S. A., Vetterling, W. T., and Flannery, B. P.: Numerical Recipes in C, The Art of Scientific Computing (Second Edition), Cambridge University Press, Cambridge, 1992. 5390
Vermote, E. F., Tanré, D., Deuzé, J. L., Herman, M., and Morcette, J. J.: Second simulation of the satellite signal in the solar spectrum, 6S: an overview, IEEE T. Geosci. Remote, 35,
15
675–686, 1997a. 5384, 5386, 5387, 5394, 5404, 5405
Vermote, E. F., Tanré, D., Deuzé, J. L., Herman, M., and Morcette, J. J.: Second simulation of the satellite signal in the solar spectrum, 6S: Users Guide, Laboratoire d’Optique Atmo-spherique, U. S. T. de Lille, 59655 Villeneuve d’Aseq, France, 2 edn., 1997b. 5388
von Hoyningen-Huene, W., Yoon, J., Vountas, M., Istomina, L. G., Rohen, G., Dinter, T.,
20
AMTD
7, 5381–5422, 2014Synergistic aerosol estimation from simulated Sentinel-3
data
W. H. Davies and P. R. J. North
Title Page
Abstract Introduction
Conclusions References
Tables Figures
◭ ◮
◭ ◮
Back Close
Full Screen / Esc
Printer-friendly Version Interactive Discussion
Discussion
P
a
per
|
Discus
sion
P
a
per
|
Discussion
P
a
per
|
Discussion
P
a
per
|
Table 1.Wavelength bands used (µm) (Donlon et al., 2012; Cutter, 2005).
SLSTR OLCI CHRIS Mode 1 CHRIS Mode 5
0.3925 0.4075
0.4075 0.4175 0.406 0.415
0.4375 0.4475 0.438 0.447 0.438 0.447
0.485 0.495 0.486 0.495 0.486 0.495
0.495 0.505
0.505 0.515 0.505 0.515
0.526 0.534 0.540 0.560 0.555 0.565 0.556 0.566 0.546 0.556 0.566 0.573
0.615 0.625 0.618 0.627
0.627 0.636
0.660 0.670 0.656 0.666 0.656 0.666
0.655 0.675 0.670 0.6775 0.666 0.677 0.666 0.677 0.6775 0.685 0.677 0.683 0.677 0.689 0.70375 0.71375 0.706 0.712 0.706 0.712 0.750 0.7575 0.752 0.759 0.752 0.759 0.760 0.7625 0.759 0.766 0.759 0.766 0.77125 0.78625 0.773 0.781 0.773 0.788 0.855 0.875 0.855 0.875 0.863 0.872 0.863 0.881
0.880 0.890 0.881 0.891 0.881 0.891
0.895 0.905 0.900 0.910 0.900 0.910
0.981 0.992 0.981 0.992
1.000 1.040 1.003 1.036
AMTD
7, 5381–5422, 2014Synergistic aerosol estimation from simulated Sentinel-3
data
W. H. Davies and P. R. J. North
Title Page
Abstract Introduction
Conclusions References
Tables Figures
◭ ◮
◭ ◮
Back Close
Full Screen / Esc
Printer-friendly Version Interactive Discussion
Discussion
P
a
per
|
Discus
sion
P
a
per
|
Discussion
P
a
per
|
Discussion
P
a
per
|
Table 2.Log-normal parameters for the aerosol components (de Leeuw et al., 2013).
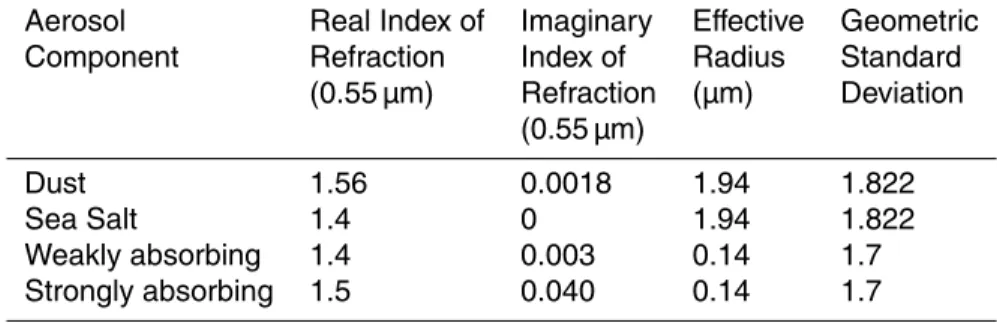
Aerosol Real Index of Imaginary Effective Geometric
Component Refraction Index of Radius Standard
(0.55 µm) Refraction (µm) Deviation (0.55 µm)
Dust 1.56 0.0018 1.94 1.822
Sea Salt 1.4 0 1.94 1.822
Weakly absorbing 1.4 0.003 0.14 1.7
AMTD
7, 5381–5422, 2014Synergistic aerosol estimation from simulated Sentinel-3
data
W. H. Davies and P. R. J. North
Title Page
Abstract Introduction
Conclusions References
Tables Figures
◭ ◮
◭ ◮
Back Close
Full Screen / Esc
Printer-friendly Version Interactive Discussion
Discussion
P
a
per
|
Discus
sion
P
a
per
|
Discussion
P
a
per
|
Discussion
P
a
per
|
Table 3.OLCI spectra (Baldridge et al., 2009; Vermote et al., 1997a).
Wavelength ρvg ρvd ρvo ρs ρa
(µm)
AMTD
7, 5381–5422, 2014Synergistic aerosol estimation from simulated Sentinel-3
data
W. H. Davies and P. R. J. North
Title Page
Abstract Introduction
Conclusions References
Tables Figures
◭ ◮
◭ ◮
Back Close
Full Screen / Esc
Printer-friendly Version Interactive Discussion
Discussion
P
a
per
|
Discus
sion
P
a
per
|
Discussion
P
a
per
|
Discussion
P
a
per
|
Table 4.CHRIS spectra (Baldridge et al., 2009; Vermote et al., 1997a).
Wavelength ρvg ρvd ρvo ρs ρa
(µm)
AMTD
7, 5381–5422, 2014Synergistic aerosol estimation from simulated Sentinel-3
data
W. H. Davies and P. R. J. North
Title Page
Abstract Introduction
Conclusions References
Tables Figures
◭ ◮
◭ ◮
Back Close
Full Screen / Esc
Printer-friendly Version Interactive Discussion
Discussion
P
a
per
|
Discus
sion
P
a
per
|
Discussion
P
a
per
|
Discussion
P
a
per
|
Table 5.CHRIS sites and image sets.
Site Sets Land cover Model Date range AOD range
Tinga Tingana (Aus) 8 Arid Desertic Dec 2003–Nov 2006 0.02–0.10 Lake Argyle (Aus) 8 Semi-arid Continental Jun 2003–Apr 2007 0.02–0.35 Great Plains (USA) 2 Agricultural Continental Oct 2003–May 2004 0.03–0.08
Mexico City (Mex) 2 Urban Urban Nov 2003–Dec 2003 0.26
Lanai (USA) 1 Shrublands Maritime Nov 2003 0.06
AMTD
7, 5381–5422, 2014Synergistic aerosol estimation from simulated Sentinel-3
data
W. H. Davies and P. R. J. North
Title Page
Abstract Introduction
Conclusions References
Tables Figures
◭ ◮
◭ ◮
Back Close
Full Screen / Esc
Printer-friendly Version Interactive Discussion
Discussion
P
a
per
|
Discus
sion
P
a
per
|
Discussion
P
a
per
|
Discussion
P
a
per
|
●
●
●
● ●
●
●
●
● ●
● ●
●
●
● ●
●
● ●
● ●
●
0.05 0.10 0.15 0.20 0.25 0.30 0.35
0.0
0.1
0.2
0.3
0.4
0.5
0.6
0.7
Photometer
CHRIS
●
●
●
● ●
●
●
●
● ●
● ●
●
●
● ●
●
● ●
● ●
●
●
●
●
● ●
●
●
●
● ●
● ●
●
●
● ●
●
● ●
● ●
●
AMTD
7, 5381–5422, 2014Synergistic aerosol estimation from simulated Sentinel-3
data
W. H. Davies and P. R. J. North
Title Page Abstract Introduction Conclusions References Tables Figures ◭ ◮ ◭ ◮ Back Close
Full Screen / Esc
Printer-friendly Version Interactive Discussion Discussion P a per | Discus sion P a per | Discussion P a per | Discussion P a per | ● ● ● ● ● ● ● ● ● ● ● ● ● ● ● ● ● ● ● ● ● ● ● ● ● ● ● ● ● ● ● ● ● ● ● ● ● ● ● ● ● ● ● ● ● ● ● ● ● ● ● ● ● ● ● ● ● ● ● ● ● ● ● ● ● ● ● ● ● ● ● ● ● ● ● ● ● ● ● ● ● ● ● ● ● ● ● ● ● ● ● ● ● ● ● ● ● ● ● ● ● ● ● ● ● ● ● ● ● ● ● ● ● ● ● ● ● ● ● ● ● ● ● ● ● ● ● ● ● ● ● ● ● ● ● ● ● ● ● ● ● ● ● ● ● ● ● ● ● ● ● ● ● ● ● ● ● ● ● ● ● ● ● ● ● ● ● ● ● ● ● ● ● ● ● ● ● ● ● ● ● ● ● ● ● ● ● ● ● ● ● ● ● ● ● ● ● ● ● ● ● ● ● ● ● ● ● ● ● ● ● ● ● ● ● ● ● ● ● ● ● ● ● ● ● ● ● ● ● ● ● ● ● ● ● ● ● ● ● ● ● ● ● ● ● ● ● ● ● ● ● ● ● ● ● ● ● ● ● ● ● ● ● ● ● ● ● ● ● ● ● ● ● ● ● ● ● ● ● ● ● ● ● ● ● ● ● ● ● ● ● ● ● ● ● ● ● ● ● ● ● ● ● ● ● ● ● ● ● ● ● ● ● ● ● ● ● ● ● ● ● ● ● ● ● ● ● ● ● ● ● ● ● ● ● ● ● ● ● ● ● ● ● ● ● ● ● ● ● ● ● ● ● ● ● ● ● ● ● ● ● ● ● ● ● ● ● ● ● ● ● ● ● ● ● ● ● ● ● ● ● ● ● ● ● ● ● ● ● ● ● ● ● ● ● ● ● ● ● ● ● ● ● ● ● ● ● ● ● ● ● ● ● ● ● ● ● ● ● ● ● ● ● ● ● ● ● ● ● ● ● ● ● ● ● ● ● ● ● ● ● ● ● ● ● ● ● ● ● ● ● ● ● ● ● ● ● ● ● ● ● ● ● ● ● ● ● ● ● ● ● ● ● ● ● ● ● ● ● ● ● ● ● ● ● ● ● ● ● ● ● ● ● ● ● ● ● ● ● ● ● ● ● ● ● ● ● ● ● ● ● ● ● ● ● ● ● ● ● ● ● ● ● ● ● ● ● ● ● ● ● ● ● ● ● ● ● ● ● ● ● ● ● ● ● ● ● ● ● ● ● ● ● ● ● ● ● ● ● ●
0.0 0.1 0.2 0.3 0.4 0.5
0.0 0.1 0.2 0.3 0.4 0.5 True AOD Estimated A OD
AMTD
7, 5381–5422, 2014Synergistic aerosol estimation from simulated Sentinel-3
data
W. H. Davies and P. R. J. North
Title Page Abstract Introduction Conclusions References Tables Figures ◭ ◮ ◭ ◮ Back Close
Full Screen / Esc
Printer-friendly Version Interactive Discussion Discussion P a per | Discus sion P a per | Discussion P a per | Discussion P a per | ● ● ● ● ● ● ● ● ● ● ● ● ● ● ● ● ● ● ● ● ● ● ● ● ● ● ● ● ● ● ● ● ● ● ● ● ● ● ● ● ● ● ● ● ● ● ●●● ● ● ● ● ● ● ●
0.0 0.2 0.4 0.6 0.8 1.0
0.0 0.2 0.4 0.6 0.8 1.0 True FMF Estimated FMF ● ● ● ● ● ● ● ● ● ● ● ● ● ● ● ● ● ● ● ● ● ● ● ● ● ● ● ● ● ● ● ● ● ● ● ● ● ● ● ● ● ● ● ● ● ● ● ● ● ● ● ● ● ● ● ● ● ● ● ● ● ● ● ● ● ● ● ● ● ● ● ● ● ● ● ● ● ● ● ● ● ● ● ● ● ● ● ● ● ● ● ● ● ● ● ● ● ● ● ● ● ● ● ● ● ● ● ● ● ● ● ● ● ● ● AOD 0.01 0.06 0.11 0.16 0.21 0.26 0.31 0.36 0.41 0.46
AMTD
7, 5381–5422, 2014Synergistic aerosol estimation from simulated Sentinel-3
data
W. H. Davies and P. R. J. North
Title Page Abstract Introduction Conclusions References Tables Figures ◭ ◮ ◭ ◮ Back Close
Full Screen / Esc
Printer-friendly Version Interactive Discussion Discussion P a per | Discus sion P a per | Discussion P a per | Discussion P a per | ● ● ● ● ● ● ● ● ● ● ● ● ● ● ● ● ● ● ● ● ● ● ● ● ● ● ● ● ● ● ● ● ● ● ● ● ● ● ● ● ● ● ● ● ● ● ● ● ● ● ● ● ● ● ● ●
0.75 0.80 0.85 0.90 0.95 1.00
0.75 0.80 0.85 0.90 0.95 1.00 True SSA Estimated SSA ● ● ● ● ● ● ● ● ● ● ● ● ● ● ● ● ● ● ● ● ● ● ● ● ● ● ● ● ● ● ● ● ● ● ● ● ● ● ● ● ● ● ● ● ● ● ● ● ● ● ● ● ● ● ● ● ● ● ● ● ● ● ● ● ● ● ● ● ● ● ● ● ● ● ● ● ● ● ● ● ● ● ● ● ● ● ● ● ● ● ● ● ● ● ● ● ● ● ● ● ● ● ● ● ● ● ● ● ● ● ● ● ● ● ● AOD 0.01 0.06 0.11 0.16 0.21 0.26 0.31 0.36 0.41 0.46
AMTD
7, 5381–5422, 2014Synergistic aerosol estimation from simulated Sentinel-3
data
W. H. Davies and P. R. J. North
Title Page
Abstract Introduction
Conclusions References
Tables Figures
◭ ◮
◭ ◮
Back Close
Full Screen / Esc
Printer-friendly Version Interactive Discussion
Discussion
P
a
per
|
Discus
sion
P
a
per
|
Discussion
P
a
per
|
Discussion
P
a
per
|
●
●
●
● ●
● ●
●
● ●
●
●
●
●
● ●
● ●
●
● ●
●
0.0 0.1 0.2 0.3 0.4
0.0
0.1
0.2
0.3
0.4
Photometer AOD
CHRIS A
OD
●
●
●
● ●
● ●
●
● ●
●
●
●
●
● ●
● ●
●
● ●
●
●
●
●
● ●
● ●
●
● ●
●
●
●
●
● ●
● ●
●
● ●
●
AMTD
7, 5381–5422, 2014Synergistic aerosol estimation from simulated Sentinel-3
data
W. H. Davies and P. R. J. North
Title Page
Abstract Introduction
Conclusions References
Tables Figures
◭ ◮
◭ ◮
Back Close
Full Screen / Esc
Printer-friendly Version Interactive Discussion
Discussion
P
a
per
|
Discus
sion
P
a
per
|
Discussion
P
a
per
|
Discussion
P
a
per
|
●
●
●
● ●
●
●
●
●
0.0 0.1 0.2 0.3 0.4
0.0
0.1
0.2
0.3
0.4
Photometer AOD
CHRIS A
OD
●
●
●
● ●
●
●
●
●
●
●
●
● ●
●
●
●
●
AMTD
7, 5381–5422, 2014Synergistic aerosol estimation from simulated Sentinel-3
data
W. H. Davies and P. R. J. North
Title Page
Abstract Introduction
Conclusions References
Tables Figures
◭ ◮
◭ ◮
Back Close
Full Screen / Esc
Printer-friendly Version Interactive Discussion
Discussion
P
a
per
|
Discus
sion
P
a
per
|
Discussion
P
a
per
|
Discussion
P
a
per
|
●
● ●
● ●
●
●
●
●
● ●
●
●
● ●
●
●
● ●
●
● ●
0.0 0.1 0.2 0.3 0.4
0.0
0.1
0.2
0.3
0.4
0.5
Photometer AOD
CHRIS A
OD
●
● ●
● ●
●
●
●
●
● ●
●
●
● ●
●
●
● ●
●
● ●
●
● ●
● ●
●
●
●
●
● ●
●
●
● ●
●
●
● ●
●
● ●
AMTD
7, 5381–5422, 2014Synergistic aerosol estimation from simulated Sentinel-3
data
W. H. Davies and P. R. J. North
Title Page
Abstract Introduction
Conclusions References
Tables Figures
◭ ◮
◭ ◮
Back Close
Full Screen / Esc
Printer-friendly Version Interactive Discussion
Discussion
P
a
per
|
Discus
sion
P
a
per
|
Discussion
P
a
per
|
Discussion
P
a
per
|
●
● ●
● ●
●
● ●
●
0.0 0.1 0.2 0.3 0.4
0.0
0.1
0.2
0.3
0.4
Photometer AOD
CHRIS A
OD
●
● ●
● ●
●
● ●
●
●
● ●
● ●
●
● ●
●
AMTD
7, 5381–5422, 2014Synergistic aerosol estimation from simulated Sentinel-3
data
W. H. Davies and P. R. J. North
Title Page
Abstract Introduction
Conclusions References
Tables Figures
◭ ◮
◭ ◮
Back Close
Full Screen / Esc
Printer-friendly Version Interactive Discussion
Discussion
P
a
per
|
Discus
sion
P
a
per
|
Discussion
P
a
per
|
Discussion
P
a
per
|
●
●
●
● ●
● ●
●
● ●
●
●
●
●
● ●
● ●
●
● ●
●
0.0 0.1 0.2 0.3 0.4
0.0
0.1
0.2
0.3
0.4
Photometer AOD
CHRIS A
OD
●
●
●
● ●
● ●
●
● ●
●
●
●
●
● ●
● ●
●
● ●
●
●
●
●
● ●
● ●
●
● ●
●
●
●
●
● ●
● ●
●
● ●
●
AMTD
7, 5381–5422, 2014Synergistic aerosol estimation from simulated Sentinel-3
data
W. H. Davies and P. R. J. North
Title Page
Abstract Introduction
Conclusions References
Tables Figures
◭ ◮
◭ ◮
Back Close
Full Screen / Esc
Printer-friendly Version Interactive Discussion
Discussion
P
a
per
|
Discus
sion
P
a
per
|
Discussion
P
a
per
|
Discussion
P
a
per
|
500 1000 1500 2000
0.0
0.1
0.2
0.3
0.4
0.5
Band (nm)
Reflectance
Simulation Retrieval
AMTD
7, 5381–5422, 2014Synergistic aerosol estimation from simulated Sentinel-3
data
W. H. Davies and P. R. J. North
Title Page
Abstract Introduction
Conclusions References
Tables Figures
◭ ◮
◭ ◮
Back Close
Full Screen / Esc
Printer-friendly Version Interactive Discussion
Discussion
P
a
per
|
Discus
sion
P
a
per
|
Discussion
P
a
per
|
Discussion
P
a
per
|
−60 −40 −20 0 20 40 60
0.0
0.1
0.2
0.3
0.4
0.5
View Zenith Angle
Surf
ace Reflectance
Red Near Infrared
AMTD
7, 5381–5422, 2014Synergistic aerosol estimation from simulated Sentinel-3
data
W. H. Davies and P. R. J. North
Title Page
Abstract Introduction
Conclusions References
Tables Figures
◭ ◮
◭ ◮
Back Close
Full Screen / Esc
Printer-friendly Version Interactive Discussion
Discussion
P
a
per
|
Discus
sion
P
a
per
|
Discussion
P
a
per
|
Discussion
P
a
per
|
400 500 600 700 800 900 1000
0.00
0.05
0.10
0.15
Band (nm)
Reflectance
Model Retrieval