ENDOGENOUS NORMATIVE INDICES FORTHE
INDUSTRY CONCENTRATION (*)
by Hugo Pedro BoffI
IE- UFRJ / Rio de Janeiro (Brasil) - [email protected] (*) preliminary version (January 2001)
ABSTRACT
This paper presents new indices for measuring the industry concentration. The indices proposed (Cn ) are of a normative type because they embody (endogenous) weights matching the market shares of the individual firms to their Marshallian welfare shares. These indices belong to an enlarged class of the Per-formance Gradient Indexes introduced by Dansby&Willig(I979). The definition of Cn for the consumers allows a new interpretation for the Hirschman-Herfindahl index (H), which can be viewed as a normative index according to particular values of the demand parameters. For homogeneous product industries, Cn equates H for every market distribution if (and only if) the market demand is linear. Whenever the inverse demand curve is convex (concave), H underestimates( overestimates) the industry concentration measured by the normative indexo For these industries, H overestimates (underestimates) the concentra-tion changes caused by market transfers among small firms if the inverse demand curve is convex(concave) and underestimates( overestimates) it when such tranfers benefit a large firm, according to the convexity (or the concavity) of the demand curve. For heterogeneous product industries, an explicit normative index is obtained with a market demand derived from a quasi-linear utilility function. Under symmetric preferences among the goods, the index Cn is always greater than or equal the H-index. Under asymmetric assumptions, discrepancies between the firms' market distribution and the differentiationj substitution distributions among the goods, increase the concentration but make room for some horizontal mergers do reduce it. In particular, a mean preserving spread of the differentiation(substitution) increases(decreases) the concentration only if the smaller firms' goods become more(less) differentiated(substitute) w.r.t. the other goods. One important consequence of these results is that the consumers are benefitted when the smaller firms are producing weak substitute goods, and the larger firms produce strong substitute goods or face demand curves weakly sensitive to their own prices.
Key words: Concentration indices, market shares, Marshallian surplus, product differentiation and substitution.
JEL Classification: D63, L5, Lll.
1 An early version of this paper received useful comments from Afonso A.M. Franco Neto
I -
INTRODUCTIONThis paper deals with the indices suggested in the literature for measur-ing the concentration (see Encaoua&Jacquemin, 1980 (hereafter, EJ), among others). When the n firms of the industry are competing according to the Cournot assumption, but their performance are not directly observed, a nat-ural measure for the industry performance is given by the following concen-tration index:
n
C -
I:
()iSi'Yi (1.0)i=1
where the ()' sare nonnegative functions, Si =
qd
Q is the market share for a firm i, 、セェゥゥI@ is the conjecturaI variation of a producer , "'fi _ 1+
、セアセゥI@ and qiN
are the equilibrium quantities supplied by the producer i. (Q(i) = I: qj).
j=I(;fi) As usual, market shares are ranked in a decreasing order: SI セ@ S2 セ@ ... セ@ Sn.
The problems related with the implementation of such indices were dis-cussed in Donsimoni&Geroski&Jacquemin,1984 (hereafther, DGJ). However, as we know, the problems pointed out there still waiting a solution.
The first point deals with the normative judgement embodied in the choice of the weights ai. Often, the use of concentration indices is justified by assessing market imperfections in order to make comparisons between differ-ent industries, or to provide theoretical basis for market regulatory policies (on behalf the competition or the consumers).
The positive solution given to this problem sets the ()/s as nonnegative functions of the market shares Si : ()i = h(Si) which lead to the usual indices like the concentmtion mtio Ck (for the k greater firms) , the
Hirschman-Herfindahl(1950) index H = iZセ]Q@ s;, the entropy index CE, a.s.o.2 So, mathematicaly C is an application from the positive unitarian simplex S;_1 into セKN@
According to EJ (pp.88-92), besides the symmetry property, good con-centration indices must verify the following properties:
2In absence of conjectures (-ri = 1), one obtains different expressions for C defined in
k n
(1.0) : (i) Ck ==
L:
Sei) , for Bi = 1 for i = 1,2, ... , k; and Bi = O otherwise; (ii) H ==2:
st ,
1 1
n
(P1) Transfer principle: if S2
<
SI and O<
.6<
S2, then C(SI+
.6, S2 -.6, S3, ... , Sn) セ@ C(SI, S2, S3, ... , Sn);(P2) Minimality under symmetry: cHセL@ BBセI@ = min{Sl ... Sn}ES:_
1 C(SI' ... , sn); (P3) Lorenz criterium: Let rI, ... rn and SI, "'Sn be the market shares from two industries both with size n and
C:
eC;
be the market shares for the k greater firms in each industry, respectively. IfC:
セ@ C:, for k = 1,2, ... n, thenC(rl' ... rn) セ@ C(SI, ",sn)' By this property, the index obtained is a sufficient measure for the inequality occurring in the industry (possibly exempting one defining a welfare function for ordering different distributions).
Similar though it may appear, concentration and inequality concepts are not equivalent one another (as EJ noted, p.89) so that it seemed sound to require two further properties:
(P4) Nondecreasing property facing horizontal mergers: if s' is the market share of the new firm issued from a merger of firms 1 and 2 (of any size) then
Cn- l (s', S3 .... Sn) セ@ Cn(SI, ... , sn) ;
(P5) Nonincreasing property of cョHセL@ BBセI@ W.r.t. to n.
D.Encaoua e A.Jacquemin have shown that if P1 is true, then P2 and
P3 also will be true, and that the satisfaction of P2 and P
4
ensures that P5 holds. Further, if h is some function defined on [0,1], the authors show that the convexity ofthe function sh(s) is a sufficient condition for C = iZセ@ Sih(Si)verifies P 1 and that the nondecreasing property of h( s) is sufficient for C verifies also P
4-With an exception for P4, the other properties are generally recognized as adequate for a good concentration measure for homogeneous product indus-tries as well as for heterogeneous indusindus-tries. Since a horizontal merger implies a change in the industry size and structure, property P4 may be questioned on the grounds of the productive sinergies that may follow a merger3 or, alternatively, the existence of uncertainty averse producers in the industry.4
This paper specifies weights (}'s leading to the definition of a norma-tive concentration index from the consumers' point of view (noted Cn) that checks properties P1, P2 and P5 (and then, P3) but not always P4. Despite its normative trait, such index assume positive expressions, as applications from 5;;-1 into セK@ as it will be shown ahead.
3See WILLIAMSON(1968), FARRELL&SHAPIRO(1990), among others.
l
The second problem raised in DGJ' s paper refers to the observation and the measurement of the market conduct, which is represented in the formula of C by the parameters 'Y. This problem will not be treated here, so that we assume 'Y = 1 throughout the paper.
A natural way to avoid arbitrary choices of the coefficientes ()' s would be to specify an utility function for the industrial product, as suggested in DGJ(p.424). In partial analysis, one may use the economic surplus gener-ated by the industry which, under the assumption that price changes do not generate revenu effects, can be estimated by the Marshallian surplus cal-culated from the demand and cost functions. For defining the ()' s in this paper, we introduce a surplus measure calculated from the residual demand of the firms, that led to indices closely linked to the allocative and productive
inefficiencies, as it will be explained ahead.
Motivation.
What does motivate a call for normative concentration indices ? In nor-mative analysis of the industry structure or performance, it is relevant to know the ease as the industry activity is able to generate surplus and, in particular, to transfer significant economic values for the consumers, while succeeding to preserve a sufficient degree of competition among the produc-ers. In this sense, it is useful having at hand an index that matches any change in the market position of the firms to the implied changes in their relative contribution to the total welfare generated in the industry. The in-dices usually employed for guiding industrial policies (particularly, Ck and
while the entrant is incurring large setup costs (Nachbar et alii, 1998). In ali these (and other) cases, we may find that an increase in the competition (signalled by a decrease in H) is accompaigned by a reduction in total wel-faré. From the point-of view of the consumers, it is well-konwn that entry of new firms into the industry (or mergers among incumbents) make room for changes in the actual differentiation and substitution structures prevailing among the goods supplied. Since the usual indices do not reflect the map of preferences, they are neither able to capture possible transfers of utility values for the consumers that may follow mergers or entries. A related ar-gument was pointed out recently for assessing the market power of firms (Young, 2000). It is advocated the need of endogenizing the preferences of the consumers in order to capture the ability of firms to gain advantage over their rivaIs by creating asymmetries in the demand for their products.
For a normative index be used in policy analysis, it should be calculated directly from the observed data, disregarding any assumption on the (mis-observed) conduct of the producers. This paper proposes theoretic-based indices displaying such characteristics. Do they reflect abolute changes in the economic surplus? No, only relative changes are captured. Facing a market transfer or a merger among the incumbents, or the entry of a new firm or even changes in costs or in tastes, the induced variation in the con-centration index is the result of a tradeoff between a (undesirable) market
position effect and a (desirable) welfare effect. If the index increases, it means
that the market position effect dominates; if the index decreases, the welfare effect prevails.
The paper is organized as follows. Section II built up the normative concentration after the definition of a weighted Industry Performance Gra-dient Index, an outstanding concept introduced by Dansby&Willig(1979).
Section III presents a method enabling to measure the welfare contribution
of the individual firms from their residual demando A class of endogenous concentration indices for homogeneous product industries is obtained. The sensibility of such indices to changes in the preferences of the consumers are analysed and comparisons are made with the Hirschman-Herfindhal index,
that also belongs to this class. In Section IV we apply our definition in order defining a class of eoncentration indiees for heterogeneous product industries. The role played in the eoneentration measure by the differentiation and the substitution degree among the goods is analysed by using a linear class of demand funetions. In the symmetric case, comparisons are made with the H index and a sensibility analysis of the normative index to changes in the demand parameters is earried out by simulation with an hypothetica15-firms industry.
11-
NORMA TIVE CONCENTRATION INDICESThis section foeus on the criteria used for defining normative coneentra-tion indices for homogeneous and for heterogeneous product industries.
2.1 Industry performance gradient indices (IPGI)
In order getting a theoretical suggestion for the formula of our indus-try concentration index, we refer here to the Industry Performance
Gradi-ent Index (cP), an outstanding eoncept introduced by Dansby&Willig(1979). This index measures the instantaneous rate of change in the industry wel-fare function V if the aetual output vector q is adjusted in the optimal
path q*(t) : 4> = lim V(q*(t)) - V(q). The funetion V is assumed to be
con-t-->O
t
cave and C2 in a open neighborhood of q. Defining qI = [qi, アセL@ ... , アセ}G@ and
セア@ = qI _ q for the quantity adjustment vector, the optimal vector q* (t) maximizes V for quantity adjustments セア@ within a closed hypersphere eentered at q with radius t. However, for making アセウ@ commensurable (in money value) Dansby&Willig use the aetual price vector P = [PI, P2 , •.. , Pnl as sealing faetors for the adjustments. Note now Y = [YI, Y2, ... , Yn]' with
Yi = Piqi and, analogously, yI for the column vector with elements Y; = I{qiI.
The path of the adjustments are outlined by the authors through the usual Euclidean metrie applied to the price-based money value of the adjustments
セケ@
=
yI _ y: d(y,yI)=
jセセセy@.
So, V(q*(t)) is the maximum of V(qI)under the restrietion
RNZセ]Q@
HiサセアjR@
::; t2. Byassumingaa
V= Pi(q)
-」pセHアゥIL@
qi
and by using the envelope theorem Dansby&Willig obtain: cP2 = RNZセ]Q@
À;,
where Ài = [Pi(q) - 」pセHアゥI}O@ Pi(q) is the Lerner index for the firm i.
definite and symmetric matrix of n- order, he can easily check that the
weigthed index obtained (I PGW 1) is:
(2.0)
where À = [À1' À2' ... , Àn]' is the vector of the actual Lemer indices.6
The I PGW I is an inverse measure for welfare. Indeed, since V is concave,
the larger cp is, the more remote from the welfare optimum the industry position (q) is. Notice that Dansby&Willig use an unweigthted metric for the money value of the quantity adjustments of the firms: セ@ = I.
In order to obtain a normative index in this paper, we will use the actual welfare shares Wi (or Wij) which are defined in section 3.2 and section IV.
Two basic ideas are driving the choice of the present metric:
(i) the speed of an overall adjustment in the firms' quantities should be
higher as the number of firms in the industry is higher;
(ii) for an overall ajustment of a given size, the weight allocated to the
money value of a symultaneous adjustment in the quantities of the firms i
and j (Pi(ql- qi)Pj(q] - qj)) should be higher as the welfare share Wij '/,S
higher ( i, j = 1,2, ... , n) ).
These two ideas suggest the following structure for the matrix セ@ :
セ]ョョL@
where
n
= [Wij] is a n- order matrix of the firm's relative share in the total surplus generated in consumption through changes in their own production (Wii) or through changes in the supply of a rival (Wij)' Notice6Define the matrix Dp = Diag(P1,P2, ... ,Pn). So, D.y = DpD.q. Therefore: J2(y,yl) =
dNセセdNケ@ = dNセdーセdーdNア@ ::; t2. By assumption, we have: ァセ@ (q) = Dp).. (a)
The Lagrangean is: L(ql; f.L) = V(ql)
+
f.L[t2 - dNセdーセdーdNア}@The first-order conditions for a maximum gives: セHアJHエII@ = RヲNldーセdーdNアG@ (b)
and dNセNdーセdーdNアG@ = t2 (c) where D.q• = q*(t) - q , with f.L セ@ O.
On the other hand, by the envelope theorem we have: セセ@ (q*(t)) = セセ@ = 2f.Lt (d)
Since matrix セ@ is positive definite and prices are positive we may -write, from (b) : {dーセdー}MセセHアJHエII@
=
RヲNl{dーセdー}セdNアB@ Squarring both sides of this equation and by using (c) we arrive to:{ァセ@ HアJHエII}G{dーセdー}Mャ{セHアJHエII}@
=
(2f.Lt)2 (e). Let squarre now equation (d). Byequating then its lhs with the lhs of (e) and taking the limit (lim q*(t) = q) on both sides
t-O
of the resulting equation (since V is C2 in a open neigborhood of q) we obtain: 」pセ@ == セ@ {セセ@ (q*(t))j2 =: {ァセ@ HアI}G{dーセdー}Mャ@ {ァセ@ (q)].
I
I L
that the w' sare calculated for a given market structure
s.
80n
will depend on this particular market structure, so that we will notens.
2.2 Concentration indices
We define the norma tive concentration index by:
1
c
n=-s'n:;1s
n (2.1)where S = [S1' ... ,
sn]'
and, for each S E S;t-llns
is some positive definite and symmetric matrix of n- order whose entries Wij are function of the contribution of the fum j to the economic surplus through the supply of the firm i.For homogeneous product industries, formula (2.1) can be obtained di-rectly from the IPGWI (2.0), under the Cournot competition assumption, since the first order condition for the industry equilibrium implies À = ls
ê
(where E is the modulo of the price elasticity of the market demand at the equilibrium point). Obviously, thisequilibrium condition does not hold for heterogeneous product industries so that for these industries the formula (2.1) is to be taken as a definition.
Notice that the H -index is a normative index with weighting matrix
n=
11. nAnother expression for (2.1) emphasizes a particular relation with the
concentration ratio8 Ck• Indeed, from the positive definiteness of
ns
it isknown that there is a lower triangular matrix T
=
[t
ij ] such thatn:;1
=
T'T (see Rao,1973, p.74). This allows to write (2.1) asCn =
セ@ lZセ]Q@
HlZセ]Q@
tkjSj)2n
where the term in parenthesis is a weighted concentration ratio of order
k. Thus, the normative index Cn is also a mean of squares of all weighted
Ck (k = 1,2, ... , n).
An appealing trait of the definition (2.1) is that it allows inserting the study of the industry concentration in the analysis of positive quadratic forms. In particular, by a classical theorem of Linear Algebra, there is a lin-ear orthogonal transformation of the market share coordinates SI, 82, ... , Sn, say m = R' s, allowing to write (2.1) in the new (orthogonal) coordinates ml, m2, ... , mn as:
where R = [rI, r2, ... , r
nl
is the orthogonal matrix of the eigenvectorsri associated to the positive eigenvalues
_
,
Vi of the matrix Os. Notice that mi - ris.The next step examines what additional conditions should be imposed on the matrix Os for Cn verifying properties P2 and P5. Property P2 requires
Cn(s) achieves a minimum for a market share vector S = セQ@ (where 1 is a vector of one's). Take for a moment Os = O, a constant matrix. In this case, the positive definitness of the matrix ensures that Cn (s) is a convex function,
so that Cn(s) will achieve a minimum in the simplex S:_1 at s* = (l,hl)Ol,
I
with Cn(s*) = (l,hl)-. Property P5 requires this value should be decreasing
n
in n. So, we will impose the condition:
c1 : 1'01 = 1.
Condition c1 means that the elements of the weighting matrix O should sum to 1. Let 01/n be the weigthing matrix relative to the equalitarian market structure s = セ@ 1.
H c1 holds, property P2 requires 1 shoud be an eigenvector associated to the root セ@ of 01/n :
c2 : 01/n1 = セQN@
Condition c2 means that each row of 01/n must sum to l/no
Of course, the normative index Cn will exhibit properties P2 and P5 if
it verifies conditions c1 and c2.
111 -
HOMOGENEOUS PRODUCT INDUSTRIES3.1 Allocative and productive inefficiencies
In homogeneous product industries, the antagonic conduct of the
pro-ducers and the asymmetry of costs among the firms create two kinds of inefficiencies for the industry.
In one hand, the profit seeking behavior of the producers leads each of them to supply quantities that do not maximize the aggregate profit. When the firms are not identical, marginal costs are not equated at the equilib-rium which gives raise to allocative inef ficiencies in the industry. On the other hand, under asymmetric costs, the supply of the less efficient firms create inframarginal losses for the most efficient ones, which may prevent them from exploiting fully their economies of scale. By this way, produdive
From the welfare point-of-view, the competition benefits the consumers through a fall in the market price which increases their economic surplus. However, the presence of large firms enjoying a strong capacity for driving the market price tends to push the aggregate profits up without a compensating increase in the total surplus generated by their production, in such a way that the consumer surplus will be harmed. Therefore, the existence of productive inefliciencies prevents a larger aggregate output from reducing the market price and, therefore, from increasing the consumer surplus. The existence of allocative inefliciencies prevents the producers surplus from being maximized.
3 . 2 The firm contribution to the economic surplus
Assume that the inverse demand P( Q) is a positive and continuous func-tion defined over a given closed and bounded set [Q , Q], strictly decreasing w.r.t. the industry output
Q
= iZセ]Q@ qi. Assume also that the cost functionsCPi are continuously differentiable w.r.t. the firm i quantity qi (i = 1,2, ... , n). Define the economic surplus generated by the firm i (Wi ) by:
qi
Wi - lim J[P(Q(i)
+
x) - 」ーセHクI}、ク@ (3.0)E--->O+ E
where Q(i) = Q - qi. The contribution share of firm i (Wi) for the total n
surplus will be: Wi =
VVi/
I:
Wi 1Alternatively, if one focus the analysis of the concentration from the
point-of-view of the consumers he is led to consider the firm's i share in the con-sumer surplus, HキセI@ which is defined analogously from the consumer surplus generated by the firm:
qi
Wic
- lim
J
P(Q(i)+
x)dx - P(Q)qi (3.1)E--->O+ E
Notice that the integrand in (3.0) is nonnegative, so W (or
wD
are pos-itively related with Si. However, the question knowing wether or not themarket share of a firm is larger or smaller than its welfare share is an open questiono A priori,
sd
Wi may be both greater or smaller than 1. lndeed, since the functions P and CPi are assumed to be continuous, the mean valuetheorem applied on the equation (3.0), yields a linear relationship between the firms supply and the welfare generated by it: Wi = kiqi , with
ki = (TVi/qi) is the mean welfare value (in money units) generated by one unit produced by the firm io It is a social indicator for the productivity of the firmo Notice that ki depends on the parameter Xio
An analogous relation may be set for the consumer surplus: Wic = kfqi,
with
kf - P(Q(i)
+
xn -
P(Q), (303)where O
<
xf
<
qi o Here, kf is the mean value generated for the consumers by one unity produced by the firm io The analysis led in the sequeI for W also applies to WC (and kC) o From the previous relations we have: sdwi
=
Hセセ@ kisi)/ki or, putting ks - セセ@ kisi=
W/Q :(3.4)
This equation shows that the equality Si = Wi holds for all firms if and
only if ki =
k
s , ioeo, if all firms are identical.One unit produced by a firm i borning a low marginal cost generate a mean welfare value (ki ) above the weighted mean value of the industry (ks) and thus, sd Wi
<
1. Analogously, a firm with high marginal cost generates a mean welfare value lower than the weighted mean value for the industry(ki
<
ks) and therefore its contribution to the aggregate supply is larger than that for the economic surplus (Si/Wi>
1)03 o 3 Normative indices
N ormative indices refiect necessarily the regulator preferences' o 7 If he is an impartial authority he should consider as fair a firm size qi allowing it to get a market share identical to its contribution for the economic surplus: Si = Wio On the other hand, consumers should consider as fair the size qi such that Si =
wf
08For building up a concentration index along (201) for the homogeneous product case, we can neglect the cross effects and define the weighting matrix as:
ns
= Diag[wl, W2, 000' Wn]o7 A general normative approach for concentration indices based on the theory of the so called numbers-equivalent can be found in BLACKO-RBY&DONALDSON&WEYMARK(1982) o
8In the prospect of the numbers-equivalent theory, given the actual industry output Q and the firm i such that Si = Wi, the value of l/Si = Q/qi could be viewed by the regu-lator as a number- equivalento An industry composed by [Q/qi] firms each one producing the same amount qi would be considered by him as preferreable to the present numer n and actual production vector [ql,q2, oo.qn]. The so-called "integer problem " (normally, a
This choice leads to an index verifying P2 and P5, because at the equal-itarian market structure, fh/n = セ@ I verifies conditions cl and c2.
However, for Cn be a positive index, the simplex S;t--1 must be its domain, which in turn needs the welfare shares w must having an unique represen-tation as a function of the market distribution S = (SI, S2, ... , sn) and the parameters of the demando If one wants assessing the concentration from a broad point-of-view for homogeneous product industries, this feature is not achieved generally, because the shares w in (3.0) depend explicitly on the cost functions and the profit shares. But if one bounds the evaluations to a
consumer point oi view, he can often obtain an exhaustive description of the
consumers' welfare shares WC defined in (3.1) through the market distribution only.
Example: Let the inverse demand function be:
1
P(Q) = o: - (3QP; 0:, (3, P
>
O and Q<
HセIpN@The demand is concave for p
>
1, convex for p<
1 and linear if p=
1. The use of (3.1) leads to:Wic = ASセセ[p@ [(1
+
P)Si+
(1 - Si)1+P - 1]. So,wf
= [(1+
P)Si+
(1-Si)1+P - 1]1 [1+
P+
2:7=1
(1-Sj)1+P - n] (3.5) If p tends to zero ( P -+ O ), the demand becomes perfectly elastic w.r.t. the price. The consumer's welfare share of the firm i will tend towf,
with:wf
= [Si+
(1 - Si) log(1 - si)]1 [1+
2:7=1
(1 - Sj) log(1 - Sj)] (3.6)(here, log stands for the naturallogarithm). If p -+
+00
the conditionP
>
O requires O<
Q セ@ 1. If Q = 1, the elasticity is not defined; if O<
Q
<
1 the elasticity Cn ( = セ@(/qP
-
1) ) tends to infinity ( as P -+ o: ). Then,the consumer's welfare share oí" the firm i will tend to:
With a diagonal matrix Os formula (2.1) gives the following index for homogeneous product industries:9
9The arithmetic mean of weights Si/W'j is greater than 1 and it is minimized in the symmetric case. Indeed, by using a consumers' version of (3.4) , we have Si/W'f = ォセOォGェ@ and then 1. n
E·
セ@ 4-W = ォセOォセL@ where ォセ@ is the harmonic mean of k'j 's given in (3.3) :i
-c 1 n 1 -1
kh = [n
E ォセャ@
.
(3.7)
As it was expected, the simulations made in section 3.5 for a particu-lar family of demand functions show that Gn verifies the transfer principle property Pi. Hence, property P3 is also checked. Simulations made also show that property P
4 is fulfilled.
3.4 A class for normative indices
Different specifications for the demand function e.g., P(Q; (,), will allow different classes of normative indices Gn ((,) to be defined according to the definition (3.7), where
e
is a given parameter vector.A large class of such indices is generated by the three parameters demand function used in the previous example i. e., P
=
a -f3QP,
with (,=
(a,f3,
p).As it is shown below, the representative index for such a class only depends on the parameter p. This particular class will allow to obtain a general property for the normative indices given in (3.7) when the demand is linear (p = 1).
By substituting in (3.7) the values of wC
given in (3.5), the following index is obtained:
[1 + P
+
セョ@ (1 - s o)l+p - n] ウセ@C ( ) L...J=1 J セョ@ セ@
n p = n L...i=1 (1
+
P)Si+
(1 - Si)1+P - 1(3.8)
Notice that gョHセL@ セ@ ... Lセ[@ p)
=
セ@ and, for n=
1, Gn(1;
p) = 1 for every p. By taking the derivative of (3.8), given the constant market distribution(SI, ... , Sn), one can show that Gn(p) is a decreasing function of plO.
For p ---+ 0, the use of (3.6) leads to an upper bound for Gn(p):
This is the normative concentration index in the convex limit case for this particular market function: the consumers are willing to match any
IOBy taking the derivative of Wi w.r.t. p and evaluating it at p = 1 we get セャー]Q@セ@
O c < 1 - si+(1-s;)2!og(1- si) C t o °b fir t t ffi.. t (C 1)
output supplied at the constant price P = a - j3 (the reservation price for them). Notice that cセ@ only depends on the market structure s. Also, we can check that cセHセL@ セ@ ... LセI@ = セ@ and that, for the monopoly case (n = 1) : セセ@
cセHウI@ = 1.
By making p - 7
+00,
Cn (p) converges to: 1c
oo = - (3.10)n n
which is the minimal value of the index in the concave limit case (sym-metric firms). This is also the industry concentration index under perfect competition.
Since the upper bound cセHウI@ decreases as the variance of the market shares decreases, from the point-of-view of the consumers the range r(s) = cセ@ (s) - cセ@ gives a measure of the allocative and productive inefficiencies
(see section 3.1) associated with the market structure s = (SI, S2, ... , Sn), out
of the number of firms and the preferences of the consumers. In their paper, Shaked&Sutton(1987,p.142) wrote: "Our theme has been, that even under
competitive pricing, a concentrated structure necessarily obtains if technology
and tastes take a certain form.". The range r( s) may be viewed indeed as a
measure for the technological component of the concentration.
The Hirschman-Herfindahl index is H =
'L.;=1
s;. So, for a lineardemand (p = 1), the relations obtained in the previous example lead to:
(3.11)
The rhs of the above equation allows one identify the firms sharing a larger amount of the welfare than of the output Si
< wf.
These are the firms enjoying a market share higher than the H-index (H<
Si). The converse applies for the firms socially less eflicient. Notice that this important result is obtained without any previous hypothesis on the cost functions of the firms.By evaluating equation (3.8) at p = 1 one arrives to the concentration index for the linear demand case:
I
Proposition 1: In a homogeneous product industry with continuous and decreasing inverse market demand function P, the H -index is a normative
index for every market distribution (Si, S2, ... , sn) E S:_1 according to (3.7)
if and only if P is linear.
Proof: For the sufficiency, the use of equation (3.11) in connection with (3.7) ensures that the linearity of P leads to Cn = H. For the necessity, by
using (3.4) we can check that,
HセIsゥ@
= (fc:)'"k:
= (fc:)セ」@
=HセIHiZ@
ォVセゥIN@
So,t 1. 1. t i=l
if Pis not linear, each kf in (3.3) cannot be written as a constant proportion of the quantities (say, kf
=
Tqi ; T > O, i=
1,2, ... , n). Therefore, the rhsn
of the last equality cannot be equal to
2:
HセIR@ = H, for every output vector i=1q = [ql, q2, ... , qn]' D
Other demand functions generate indices that overvalue the indices from the class Cn (p ). This is the case for the convex demand function with constant
elasticity : P = AQ-6; ( Q, A, 8
>
O), which generate an index Cn(8)increasing in 8. The lower bound lim Cn(8) is identical to cセ@ given in (3.9). 8-+0+
11 The functions belonging to the exponential family (e. g., P = B e-'f/Q;
Q,
B, 1]>
O ) generate indices Cn(1],Q)
that overvalue H. However, these indices depend on the industry output Q. 123.5 Nonlinearities and market share transfers
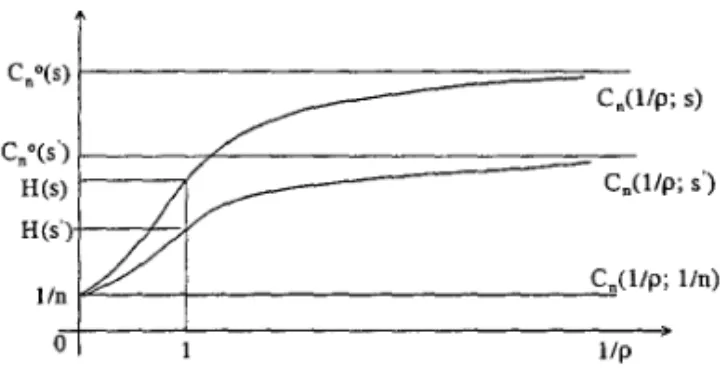
Since l/pis a price-elasticity parameter, the figure 1 depicts the curve (1, p Cn (1)) p of an industry composed by n firms for three different market struc-tures: a less equalitarian distribution, S = (SI, S2, ... , S3); a more equalitarian one s' = HsセL@ S;, ... , ウセI[@ and the perfectly equalitarian distribution Hセ[@ ... ; セIN@
llIn this case, the use of (3.1) leads to:
wf
= [1 - (1 - 8)Si - (1 - Si)l-05]j [n - (1-8) - I:j=l (1-Sj )1-05] . One can easily check that by taking the limit for 8 --+ 0, the index obtained by using (3.7) is cセ@ which is given in (3.9).
12In this case, W{ = セp{・WIアゥ@ - 1 - 7JQi]. By using the Taylor series expansion of eTlQsi
d -
°
d d finin - "n 1 bt ' . c - [,,00 (TlQ)l l]/["oo (TlQ)l ]aroun Si - an e g al - L..-i=l Si , we o amo wi - L..-l=2 l! Si L..-l=2 I! ai·
,
,
i
CnO(S)
Cn(l/p; s)
C:(s')
H(s) Cn(l/p; S')
H(s)
l/n Cn(l/p; l/n)
o l/p
fig.l: Industry concentration and price-elasticity
So, the presence of nonlinearities in the demand biases the use of the
H -index for normative pourposes: from the consumers' point-of-view, H
underestimates the magnitude of the industry concentration whenever the
inverse market demand is convex
(1/
p>
1) and overestimates it if the inverse demand is concave (1/ p< 1).Market share transfers. These features affect also the way as the index works under market share transfers among the firms. Consider an industry composed by n = 5 firms. In the initial position, the market shares are: s = (0.4; 0.3; 0.1; 0.1; 0.1). The fust column in Table I gives the value of the normative index for p = 00, 2, 1, セ@ , O. The second column gives this value (and the percent of the variation w.r.t. the initial position) resulting from a 5% market share transfer from fum 5 (its share falls to 0.05 ) to firm 3 (its share increases from 0.10 to 0.15 ). The column 3 reports this value when such transfer benefits firm 1 (its share jumps to 0.45).
Table I market shares transfers
l:inital position
c
oo = 0.200n
Cn(2) = 0.267
Cn(l)
=
0.280=
HcョHセI@ = 0.287 cセ@ = 0.296
2 (between smal! firms)
0.200
0.271 (1,78%) 0.285 (1,78%)
0.292 (1,76%) 0.301 (1,73%)
3(from a smaU to a large firm)
0.200
0.295 (10,65%) 0.315 (12,50%) 0.327 (13,60%) 0.340 (14,85%)
The Table I shows normative indices larger than H in the concave case
The second and third columns in table I show, for the convex demand case, that the Hirschman- H erfindahl index overestimates the concentration increases resulting from the transfer between two small firms (1,78% against 1,76 % or 1,73%) and underestimates the variation of the concentration caused by a transfer benefitting a large firm (+12,50% against +13,6% or
+
14, 85 %). The converse holds if the demand is concave. The difference in the effects according to the demand shape may be explained by the fact that a non dominant firm have a welfare share relatively greater in the concave case (see note 10).IV -
HETEROGENEOUS PRODUCT INDUSTRIESLet start introducing some notations. %) = [ql, ... , qi-l, qi+l, ... ,qn] is the vector of the positive quantities supplied by the competitors of a producer
i;
and E{(qi; q(i)) is the inverse demand function he faces. Pi is assumed to be a positive and continuous function defined over a bounded polyedron Bi C ャrセL@differentiable in its arguments and decreasing in qi. Assume further that O is an accumulation point for Bi(i = 1,2, ... , n).
Let Wij be the economic surplus generated by the demand for good i through changes in the supply of good j. 80,
qi
Wii
=
lim f[Pi(X; q(i)) - <p:(x)]dx and E--->O+ Eqj
VVij
=
limJ
Pi(X; q(j))dx - <P:(qi)qj ; ii-
j = 1,2, ... , n. E->O+ tOAnalogously to (3.1), if one focus on the consumer surpIus, the corre-sponding vaIues are:
4. 1 Concentration indices
In the sequell we will assume that the quantities qi are commensurable accros different firms. The common measure used will permit aggregation on the quantities and give a meaning for the industry output Q =
2:i
qi and the market shares Si = qi/Q.bear out results supporting the so-called differentiation principle: firms want to differentiate to soften price competition. As Tirole(1989,p.295) notes, this idea fits well with the observation that firms often search for market niches when positioning their product. An explicit theoretic support for the differ-entiation principIe is given by Shaked&Sutton(1982, 1987). By assuming the existence of an industry equilibrium with differentiated products, they show in the latter paper that the jmgmentation principle of the market fails to hold if some conditions on the technology and on tastes are fulfilled. More precisely, concentration will emerge if the burden of a quality improvement of the product falls primarily on fixed costs and if, as the market becomes large (by replicating the number of consumers) all consumers demand the highest quality good, whenever quality is priced at its marginal cost (at any quality leveI). So, the concentration depends essentially on the shape of the
technology and on the consumers' s prejerences. However, their model aims
obtaining qualitative results for the sources of the concentration only, and not to provide an index for measuring it.
For building up the concentration index along the formula (2.1) we have to specify the weight matrix S1s = [Wij] , where each Wij should be a convenable function of Wij . For the inner product be well defined, S1 must be symmetric (Wij = Wji) and positive definite. The first condition should be overcome by taking the mean between the cross terms wセェ@
=
wセェ@=
セHwゥェKwェゥIN@ The second condition could require there is not too much complementarity among the goods.4.2 Classes of normatíve índices
For obtaining an explicit class of normative concentration indices for het-erogeneous product industries, assume that the preferences of the consumers may be represented by the quasi-linear utility function:13
U(q ; qo) = %
+
q'a - q' Aq (4.0)where q = [ql' q2, ... , qn]'; qo is the amount of a numemire good, a is a vector of positive parameters a
=
[0.1,0.2, ... , an ]', and A is a symmetric and positive semi definite matrix of the form: A=
[A+
1'1"],
where l'=
bl,'Y2,···,'Ynl'
and A = Diag[(f31 - 'YD, (f32 - 'Y§), ... , (f3n -1';')]'
where alI f3i are positive parameters such that f3i セ@1';.
So, if a rational representativeconsumer maximize the utility U under the budget constraint qo
+
P' q ::; m (revenue) the inverse demand system only depend on prices and is obtained by: P = セセ@ = a - 2Aq, that is, for the good i ( i = 1,2, ... , n) :( 4.1)
The goods i and j are substitute, complement or independent one each other according to "I{'Ii
>
O, "Ij"li<
O or "Ij"li = O. The quasi-concavity of the utility required for the existence of a global maximum implies there is not too much complementarities among the goods. High values of "Ii"lj means that customers can easily substitute goods i and j one another.The specification (4.1) deserve some comments.
(i) The direct demand system can be computed straightforwardly by using the inverse matrix: A-I = [A
+
"1"1']-1 = A-l[A - l!d"l"l']A-l ; and hence,q = セaMQH。@ - P). For a good i it gives:
qi(P1, ... , Pn) = ai - セ「ゥpゥ@
+
セ@ L.,j(#i) CijPjThe direct and cross elasticity parameters are:
bi = (!3i
セ@
"I;?[!3i - "1;(1+
1:
d)]"I i'Y j
(4.1b)
(4.1c)
2
where ai
=
セ@ [biai - L.,j(#i) Cijaj] and d=
"I' A -1"1 = lNLセ]Q@ ヲS■セGy[ᄋ@(4.1a)
The matrix ⦅セaMQ@ is the Slutsky matrix of the substitution effects. The demand function qi (.) is not defined for !3i =
"I;'
The restrictions"I;
<
HセエセIASゥ@ (i = 1,2, ... , n) must be imposed in order that all direct demand functions qi(PI, ... , Pn,) be downward sloped in Pi;
(ii) The demand function properties for differentiated oligopolies are dis-cussed in Friedman(1989, p.62). Linear demand functions are commonly used in the literature. See Singh&Vives(1984); Deneckere&Davidson(1985), Shapiro(1989), among others.
Although we must assume rational preferences and utility maximization for obtaining the demand functions that the producers will face, it is worth noting that once formula (2.1) is accepted, no hypothesis on the nature of the
In the sequeI, we will set explicit expressions of the index Cn for the consumers, that can be derived from the weighting matrices Os implied by the inverse demand system (4.1).
Influential welfare directions
We are Iooking at a normative index for the consumers. So, we will evaIuate the consumers' surpluses WiJ in (4.0) for セ@ given by (4.1). This gives:
w·c:
=
(3.q2 and wセᄋ@=
'"V.'"V Nアセ@U 2 2 2J /2 / J J
For imposing the symmetry condition we define W iJ = セHwゥj@
+
WJi) . Dividing the numerator and the denominator by Q2 the folIowing welfare shares are obtained:W c/wc
セセ@
d
Wii
=
ii=
",n 2 1 ' " ( 2 2) anL...-i=1 (3i si
+
"2 L...-i,j(iij) Ii/j Si+
Sj.. =
W.C!/wc=
セiゥャェHウ[@
+
s;)w2J 2J ",n (3 2 1 ' " ( 2 2) = Wji·
L...-i=1 iSi
+
"2 L...-i,j(iij) Ii/j Si+
SjThe present structure for Os = [Wij] alIows properties P2 and P5 to be satisfyied by the index Cn . Indeed, under a competitive regime, a necessary (but not sufRcient) condition for the equalitarian market structure S = セ@ 1 holding is given by (3i
=
(3 and li=
I (symmetric substitution) for alI i, j = 1,2, ... , n. This will then imply a weighting matrix 01/n satisfying conditions c1 and c2. However, an explicit expression for the index cannot be performed from the above matrix Os, because one cannot derive from its elements a manageable expression for the inverse 0;1.Scaling
In order to get round this drawback we will go deeping by using the values
q;
andq;
as scaling factors, so that the weighting matrix Os will depend only on the parameters (3's and I's. So, by putting wセゥ@ =Wii/q;
= (3i; W:. 2J = wセNOアセ@ 2J)=
'"V.'"V.=
wセNOアセ@ = wセN@ , we define the corresponding entries/2 / J J2 2 J2
of Os by wU c. = wセNOw」@ 22 and wセᄋ@ 2J = W:./W2 J ) 2 c = z:zf. , where, WC = "'. L...-2
- c - c . 1 -1 - c _ 1
W ii
+
2 Li<j W ij · In thlS case, Os = WA and therefore, Os = W A ,where the elements aij of A-I are: aii = bi and aij = -Cij, that is, the coefRcients of the substitution effects given along (4.1b, c). By substituting these values in (2.1) we arrive to the folIowing index:
(4.2)
where, WC = Li (3i
+
Li,j(iij) Ii/j and bi, Cij are given in (4.1b, c).lIaLIl1TEGA mセ■wj@ bd.mlÜUE SIMOIISEI
I'
The derivatives of Cn in (4.2) w.r.t. a marginal increase in differentiation
(d;3k
>
O) or in substitution (d"fk>
O) have ambiguous signs, even when evaluated at the symmetric point (;3i = ;3 ; "fi = "f).Notice that if all goods are independent that is, "fi = O, we have Cij =
O and Cn reduces to a weighted H-index, with bi = ;3-;1.
Explicit and interesting results are obtained under overall symmetric
dif-ferentiation (;3i
=
;3) and gross substitution hi=
"f) assumptions. In this case, the actual industry position s is different from the equalitarian position because firms face different costs and/or there is noncompetitive conduct. The index in (4.2) becomes:Cn = bH - c (4.2a)
"f2
where b = 1
+
nc with c = ;3 2 . - "fThe equation (4.2a) says that if the firms of an heterogeneous product industry only differ one another by their costs and/or by their conduct, the normative industry concentration for the consumers is an affine transforma-tion of the H - index (the scaling factors used play a crucial role for linearity). The difference in Cn given in (4.2) w.r.t. to its value in (4.2a) can therefore
be viewed as the component of Cn only due to asymmetry in tastes.
From (4.2a) one can easily check that H underestimates the industry concentration: Cn (s) - H (s)
>
O for s=I
セ@ 1 and that the equality Cn = Hoccurs only under the equalitarian market structure (firms borne identical costs). The H - index verifies properties PI and P4 (Encaoua&Jacquemin). However, although Cn in (4.2a) checks property PI, it does not allways verify
property P4. Table IJI ahead shows an example of it. The figure 2 below depicts the relation between Cn and H.
H
o 11. H
fig.2: The H-index and the normative index Cn under symmetric
Given a fixed market structure s, one can check that セセR@ = HL。セRIR@
(nH-1) and that
¬セゥイ@
= -HL。AセRIR@
(nH - 1)0 Since Hセ@
l/n , the index is an increasing function of,2 and a decreasing function of (30 14Notice from (402a) that the index often increases with n, (more precisely, when セA@ is dose to zero or positive) o It means that the entry of a new firm into the market for supplying a "brand" perceived as symmetric woroto those sold in the market, often appears as harrnful to the consumerso The simulations made ahead with asymmetric preferences suggests that beneficiaI entries will occur when the incumbents "accomodate" the entry in such a way that the correlation between the new market distribution (issued from the entry) and the new variety vector (or substitution vector) does result increasedo This condition is favored when a "small" entrant supplies a weak substitute good (or a good with demand highly sensitive to its price) or a "large" entrant produce a strong substitute good (or a good with demand weakly sensitive to its price) o
In the sequeI we will refer the vector (3 = ((31' (32' 000, (3n) as a variety
vectar of the industryo Its variance V,a provides a measure of the differ-entiation among the goods suppliedo Loosely, the higher V,a is, the more differentiated the products areo The preferences of the consumers may as-sociate to two different products (i, j) the same value (30 However, if they associate to the pair (i,j) different (3's, then these products are perceived as different by themo So, high values of V,a means high product differentiationo
On the other hand, we will refer to the vector '"Y = (rI' '2'000' 'n) as the
substitutian vectar of the industryo AE it will be shown below, the correlation between, and the market distribution s = (SI, S2, 000' sn) plays an important role for assessing the industry concentration from the normative point of viewo
The industry concentration relationship with product differentiation and
14These effects may be caused by the scaling factors employed in the construction of
nso
Indeed, if the entries of ns are function of some parameter 0", and the market shares are kept constant, we can evaluate the effect of a parameter change on the index say,aCn
=
l.sl(ana;l )s, by examining these effects only on the entries Wij, since from theaO" n O"
an- 1 1 ans 1 o ans
calculus we have: _s_ = - n;
-a
n;.In the present case, the matnx-a
2 could be&
O" 7positive definite and a negative sign for
セセ[@
obtains if we did not use any scaling factorsubstitution among them, is precisely focused in the next section. In order to do this, we will calculate the values of Cn given by the formula (4.2) for a given industry composed by 5 firms with a fixed market share structure according to different variety vectors ({3) and substitution vectors ("(). It is assumed that different cost structures andj or different competi tive conduct of the producers make compatible a fixed market distribution s with different preference systems ({3, "(), ({3', "('). The performance of Cn obtained with these simulations allowed to shed some light on the relationships between concen-tration, differentiation and substitutability, as well as to examine whether or not the theoretical predictions for these relationships are reproduced in the present framework.
It is worth noting that the differentiation effects cannot be strictly sep-arated from the substitution effects, because an increase in the perceived differentiation of a good is often followed by a change it its substitution de-gree w.r.t. the other goods (according to the utility valuations made by the consumers). Therefore, the results obtained in the simulations made below should be taken for basing a qualitative analysis of the dominant effects only.
4.3 Concentration, substitution and differentiation
Consider a 5-firms industry with market shares: s = (0.4 ; 0.3; 0.1; 0.1 ; 0.1). In order to distinguish the differentiation effects from the substitution effects we will consider first a fixed gross substitution parameter
"I
=Jü.I
and the following variety vector {3
=
(1.6; 1.4; 0.7; 0.7; 0.6) , with mean"'B=
1. For examinng the effects of changes in the correlation with the market dis-tribution, we will also consider the rever se profile (with negative correlation with s) : {3' = (0.6; 0.7; 0.7; 1.4; 1.6).On the other hand, taking the mean {3 = 1 fixed, we consider the follow-ing substitution vector: 'Y = (0.581; 0.4; 0.2; 0.2; 0.2) with mean
"I
=Jü.I.
Again, wewillalsoconsiderthereverseprofile"(' = (0.2; 0.2; 0.2; 0.4; 0.581). All these cases generate positive definite matrices A = A
+ "("(',
defined along (4.0).Product differentiation
The direct and cross elasticity parameters bi and Cij given in (4.1b) and
0.640 0.030 0.066 0.066 0.079 0.734 0.076 0.076 0.092
D = 1.501 0.165 0.198
1.501 0.198
sym. 1.761
The implied value of the scaled welfare is WC = L:i (3i
+
L:i,j(i#j) ,,({'fj = 5+
2=
7 so that the use of the entries of matrix D in (4.2) gives: Cn=
0.232.We can easily calculate the concentration index under the reversed variety vector {3' by applying the entries of the matrix D to the reversed market distribution s' = (0.1; 0.1; 0.1; 0.3; 0.4). This gives: cセ@ = 0.485.
RecalI that the Hirschmann-Herfindhal index H for the present market structure is H = 0.280.
Under the symmetric values
CiJ
= 1 ;'?
=JD.I)
the normative index given in (4.2a) is 」セケュN@ = 0.324. So, if the differentiation benefits the larger firms, the measured concentration reduces by 100 x (Cn - 」セケュᄋIO」セケュN@=
-28,3%. If the smalIer firms are benefitted, the concentration increases by 100 x Hcセ@ - 」セケュLIO」セケュN@ = 49,6%. Disregarding the magnitude of the values, these results are qualitatively quite general, so that we can state:For a fixed market share distribution s, a mean-preserving spread of the differentiation degree of goods increases (reduces) the industry concentration if the demand for the goods produced by the smaller firms becomes less (more) sensitive to their own prices than do the demand for the goods produced by the larger firms.
In Shaked&Sutton's mo deI (1987), as the market becomes large, partic-ular conditions on technology and tastes make some firms keep sharing a stable proportion of the whole market whenever they improve the quality of their products, that is, whenever they differentiated their products. How-ever, this stable proportion may be very smalI, if the number of consumers is replicated many times and/or the revenu of the consumers is high. Our result says that the differentiation degree is positively related with the con-centration only if the small firms' goods become "more differentiated" than the large firms' ones. A mean preserving spread of the differentiation that makes the larger firms' goods more differentiated (viz. price-inelastic) causes a falI in the concentration from the point of view of the consumers.15
i
,
Product substitution
The direct and cross elasticity parameters bi and Cij, that are implied by the substitution vector "( = (0.581; 0.4; 0.2; 0.2; 0.2), with differentiation parameter
f3
= 1, are sumarized in the following symmetric matrix S:1.088 0.228 0.100 0.100 0.100 1.066 0.054 0.054 0.054
S = 1.017 0.023 0.024
1.017 0.024
sym. 1.017
The implied value of the scaled welfare is here: WC
=
5+
1.882=
6.882, so that the use of the entries of the matrix S in the formula (4.2) gives: Cn = 0.289.By applying the entries of S, to the reversed market distribution s' as did before we obtain the index value under the substitution vector "('. This gives cセ@ = 0.341.
So, if the spreading of the substitution benefits the large firm goods the industry concentration falls. In this case the measured concentration is re-duced by 100 x (Cn - 」セケュᄋIO」セケュN@
=
-10,8%. On the other hand, if the smalIer firm goods become more substitute, the concentration increases by 100 x Hcセ@ - 」セケュᄋIO」セケュN@ = 5,2%. So, fram this excercise we state:For a given market share distribution s, a mean-preserving spread of the substitution degree among the goods reduces (increases) the industry concen-tration if the goods produced by the smaller firms become less (more) substitute than those produced by the larger firms.
Notice that an increase in the substitution degree of a good shifts inward its inverse residual demand, leading to a lower price leveI. If the increased substitution benefits principalIy the larger firms it means that lower prices al-low to increase the welfare shares issued from the consumption of these goods. The inverse may occurs with the welfare shares issued fram the consumption of the smalI firms' goods whose substitution degree has been decreased. How-ever, in this case the welfare shares' falI is mitigated because the increased substitution of the large firm goods does limit the prices' raise of the smalI firm goods. Altogether, welfare effects overtake the (fixed) market position effect so that concentration decreases.
de-pend principally on the decision variable used to model competition and on the assumptions made on consumer behavior. As notes Chang(1991), at a first glance, firms offering similar products would have strong incentive to coordinate their decisions in order to avoid severe price competition. Yet, the temptation to defect from the collusive agreement is also strong if the goods are strong substitutes, because a slight reduction in price will result in a sgnificant increase in firm demand (the elasticity of firm demand increases with the substitution).16
4.4 Market transfers and horizontal mergers
In this section we examine the concentration effects of market transfers and horizontal mergers among the incumbent firms. For doing this, we use the same market distribution (s), and variety and substitution vectors
(/3, /3')
and (1, 1') as we did in the previous section.
Mar ket transfers
Since the matrix O used is constant and positive definite, Cn is a convex function of s, so that a market transfer from a small firm to another not larger than itself increases the industry concentration, so that property P1 is always checked. For example, consider firm 5 transfers 5% of its market share to the firm 4, so that the new market structure is s' = (0.40; 0.30; 0.10; 0.15; 0.05).
In the following Table Il, we give the values of Cn in the symmetric case
(/3 =
1 ;'"1 =
yõ.I).
The values of Cn are calculated also under the differentiation vector/3
= (1.6; 1.4; 0.7; 0.7; 0.6) and its reverse/3',
with constant substitution'"1
=yõ.I,
and under the substitution vector 1 = (0.581; 0.4; 0.2; 0.2; 0.2) (and 1') with constant differentiationrameter f3 = 1. In each case, the percent variation in the concentration W.r.t. the inital position values are shown in parenthesis.
Table H market transfers and concentration initial position
s = (0.4; 0.3; 0.1; 0.1; 0.1)
H 0.280
Cn(f3) = 0.232
cセ@ (f3') = 0.485
」セケュN@ = 0.324
Cnb) = 0.289
cセ「GI@ = 0.341
between two small firms
s' = (0.4; 0.3; 0.1; 0.15; 0.05) 0.285 (+1,7%) 0.243( +4,7%) 0.489( +0.8%)
0.332( +2,4%) 0.296( +2,4%)
0.354( +3,8%)
From the value of cセ@ (f3') we see that the increase in the concentration is negligible when the demand functions facing the firms in the partnership are relatively weak sensitive to their own prices.
Horizontal mergers.
Horizontal mergers do change the size and the structure of the industry. This implies that the order and the elements of the matrix 0-1 are affected, so that for some demand parameters a merger may reduce the concentration calculated from (4.2). The following simulations for a merger between two small firms in the 5-firms industry used in the previous sections will help us to identify some of these particular preferences' structures. Assume firms (4) and (3) merge, so that the new market share profile in the 4-firms industry becomes: s' = (0.4 ; 0.3 ; 0.2 ; 0.1) .
Table III below shows the values of Cn in the symmetric case (f3 = 1
; '1 =
J[I).
The values of Cn are also calculated under the differentia-tion vectorf3
and its reversef3'
= (0.6 ; 0.7; 0.7; 1.4 ; 1.6) with substitution parameter'1 =J[I,
and under the substitution vector "( and its reverse"(' = (0.2; 0.2 ; 0.2; 0.4; 0.581) with differentiation parameter f3 = 1. In paren-thesis, the concentration change w.r.t. its initial position is given.
Table IH horizontal mergers and concentration initial position
s = (0.4;0.3;0.1;0.1;0.1)
between two small firms
s' = (0.4; 0.3; 0.2; 0.1)
H 0.280
Cn
(f3)
= 0.232cセ@ (f3') = 0.485 csym. n = 0.324
0.300 (+7.1%) 0.264( + 13,8%) 0.487( +0.4%)