Clustering Analysis within Text Classification Techniques
Madalina ZURINI, Catalin SBORA
Academy of Economic Studies, Bucharest, Romania [email protected], [email protected]
The paper represents a personal approach upon the main applications of classification which are presented in the area of knowledge based society by means of methods and techniques widely spread in the literature. Text classification is underlined in chapter two where the main techniques used are described, along with an integrated taxonomy. The transition is made through the concept of spatial representation. Having the elementary elements of geometry and the artificial intelligence analysis, spatial representation models are presented. Using a parallel approach, spatial dimension is introduced in the process of classification. The main clustering methods are described in an aggregated taxonomy. For an example, spam and ham words are clustered and spatial represented, when the concepts of spam, ham and common and linkage word are presented and explained in the xOy space representation.
Keywords: Knowledge Societies, Text Classification, Spatial Representation, Artificial Intelligence, Clustering Analysis, Spam Filtering
Introduction
The knowledge society represents a new stage of human evolution, a superior quality lifestyle that involves intensive use of IT in all spheres of human activity, with major social and economic changes. Democracy, communication, understanding and cooperation are the main characteristics of this society, which makes knowledge society to be based on the multitude of resources offered by Internet access.
The evolution of technology generated an exponential increase in the volume of processes information, leading to the need of integrating artificial intelligence in the domain that includes structure, analyses, organization, search and extraction of information or security. In this purpose, aggregated structures were built to synthetize better the concepts from a particular area of research, such as dictionaries for information security [1] or knowledge databases for data mining purposes. The research is directed through all the components and stages of the knowledge processing.
In [2], knowledge management is approached from the perspective of techniques, methods and solutions used in the purpose of optimum management of the organization knowledge. Information system, as part of the organization, includes:
- data, numerical description of processes and phenomena;
- information, data that add knowledge;
- knowledge, data sets with applied importance that generates added value. To advance in value and significance, the data must be transformed into information and, after words, in general knowledge “know-what”, scientific, “know-why”, technological, and “know-how”, genuine. Knowledge revolution has made the transition to knowledge based economy in which assets are mostly intangible.
Information representation stands as a multidisciplinary technical that takes different forms such as:
- spatial representations are described using map and semantic space as an n-dimensional method;
- ontologies are seen as a formal representation of classes, attributes and key relationships between them;
- description and processing languages of objects and interactions between them, such as OWL – Web Ontology Language.
and reliable, timely and dynamic. The implementation represents the primary resource of the search and retrieval of information, with the results:
- classification: spam detection, document classification into different categories by applying algorithms such as: Bayesian networks, decision trees, neural networks;
- summary elaboration of the documents for establishing the film version by extraction or abstraction; in [3] the automatic techniques used for sentence extraction from a document using the groups of similarity of meanings is described;
- theme retrieval based on semantics which represents the information extraction component from a representation;
- semantic web, technology that enables understanding the semantics of each engine in World Wide Web environment;
- dictionaries, semantic maps that relates to two of those in the same area but in different languages, such as those used in translation.
The direction of the field is supported by the introduction of artificial intelligence techniques in order to emulate the mental representation of concepts, linkages and merging of them. On the interpretation part, the objective is to automate the process of selecting the threshold of information to
maximize the output given by the level of information, under the constraint of maximizing the computational effort.
2 Text classification process
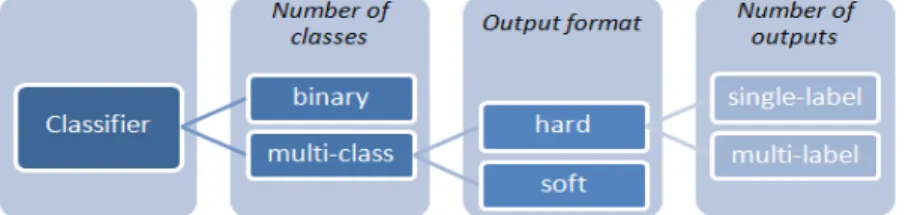
In [4], a classifier is a function that draws a connection between a set of variables, input data, and a set of labeled categories, the output data. From the definition of a classifier, the subtype text classification is seen as a decomposing of the input data, the document itself, into elementary variables, the words, set of words, that consists in a set of variables, after words, an applying technique used for gathering the major impact given by the set of variables into an output data, meaning the labeled categories. For that, [5], depending on the number of classes that a document can be classified, two types derive: binary and multi-class classification, figure 1:
- binary classification – the classifier returns a positive or negative result class;
- multi-class, single-label, hard
classification – the classifier returns a class as a result from several available classes;
- multi-class, multi-label, hard
classification – the document in classified within more than one label class;
- multi-class, soft classification – for each class, the document receives a value of membership.
Fig. 1. Aggregated taxonomy of classification types
The taxonomy presented above is composed within 3 layers of distinction:
- classes layer is formed out of the set of classes that the documents can by classified in;
- number of outputs layer represents the number of results offered by the classification method; a document can be classified in one or more specific classes. The general problem when it comes to classification is to determine which type of this process is suitable for the specific requirements from the three main types that are:
- subject classification is concerned about the main topic of the review;
- functional classification implies the role that the review has;
- sentimental classification, in [6], focuses on the opinion that is transposed in the specific review.
Different techniques are used for controlling the process of input transformation into one or multiple classes, with probabilities attached to them or not, but the main characteristic that all of these techniques have is the one that implies reducing the dimension of information, but not any kind
of reduction, a controlled one, that guarantees the maximum level of information gathered in it.
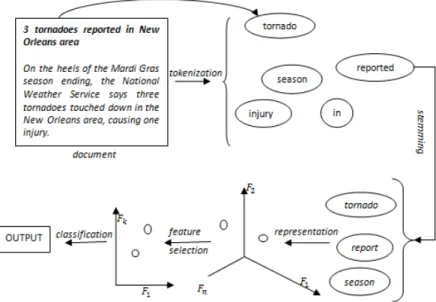
The entire process of text classification includes the following steps:
- document tokenization is the process in which the document is divided into the elementary input data, that is the word;
- stemming implies reducing each word to their root, called stem; a lot of algorithms of stemming are available, such as [7];
- text representation is done based on the results of tokenization and stemming;
- feature selection is used for selecting a subset of features from the total amount of available ones;
- classification algorithm is finally applied on the variables returned by the feature selection process.
In Figure 2, the steps presented above are integrated for a better browsing through the main classification steps.
Fig. 2. Main classification steps
An example of document is used for exemplification purpose, a document regarding meteorological news. For tokenization step, the document is divided into words, resulting the set M = {3, tornadoes, reported, in, New, Orleans, …, causing, one, injury }. After the step is finished, the process of stemming is used for
each of the elements of M. The roots of the words form a new set, called Ms. From this
set the representation is done by transforming the Ms elements into points of n dimensions,
-dimensional space into a k-dimensional one, with k << n.
The last step consists in applying the classification procedure, having as input the information quantity found in the elements with the k-dimension features. The output can be of two types, hard or soft, and can have different numbers, one or more returned classes.
3 Spatial representation models
Spatial representation is a visual method for representing objects defined under o specific number of features. A perspective from the elementary components of the representation, the point, and the entire view is done.
Let we consider the set of features =
{ , , … , }, where n is the number of
features available for the objects observed. An object is an instance of a particular exemplification of the n features, such
as: = { , , … , }, with
= 1, where m is the number of objects that are part of the representation.
The generic model is called M and is defined as = , , ⋄ , with the following specification:
- is the set of objects, as: =
{ , , , … , };
- ⋄is the set of operations that are available in the defined model, M.
From the M model, there are elements that are extracted and = { ,⋄}algebraic structures are formed, depending on the operation selected, ⋄. The operations that are suitable for the G structure are those that take 2 elements from the O set and generates a third element from the same set, having the property of stable part. Those structures are also candidate for group structures with the properties:
- associatively, ⋄ ⋄ = ⋄ ⋄
, ∀ , , ∈ ; the result of the elements
combined is not influenced by the order of the elements;
- neutral element, ∃ ∈ , so that ⋄
= ⋄ , ∀ ∈ ; from the set of
objects, a particular one is called neutral element, an object that does not modify the value of the other elements;
- symmetric element, ∀ ∈ , ∃ ∈
so that ⋄ = ; the symmetric
property can be easily highlighted in terms of spatial representation, an element that is opposite to each of the elements from the neutral element. The elements described above are presented in Figure 3. For simplifying the presentations, the n-dimensional representation will be exemplified using a 3-dimensional one. In Figure 3, two objects are integrated in a 3-dimensional, 3 features model. As an exemplification, is the neutral element, of coordinate (0, 0, 0) for F1,
F2 and F3 features.
Fig. 3. Two points in spatial representation
Knowing the main characteristics of text classification and the central elements from spatial representation, an increase in performance can be made when the text features are seen as a set of points from the feature space. For that, the spatial elements must be mapped to the text elements.
Many studies, such as [8], use the spatial representation as an efficient technique for clustering, word interacting, synonymous concern and word ambiguity. Those studies reveal the fact that this visualization perspective increases the classification performances. The representation proposed by [8] is available at [9].
from with the points are drawn, are the elements that characterize the text and that influence the output data. For instance, the features can be the total number of categories that a document can be classified in.
Having the points and features, the correlation is done between a point, the word, and the features, the value that characterizes this particular point from each feature view. In the case of multi-class classification, when, let us suppose that there are 3 main categories of topics in which the documents must be classified, C1, C2, C3, the words, Wi are represented in space with the coordinates equal to the total number of appearances of the word in documents from each category from the total number of documents used as a knowledge background before the classification is done.
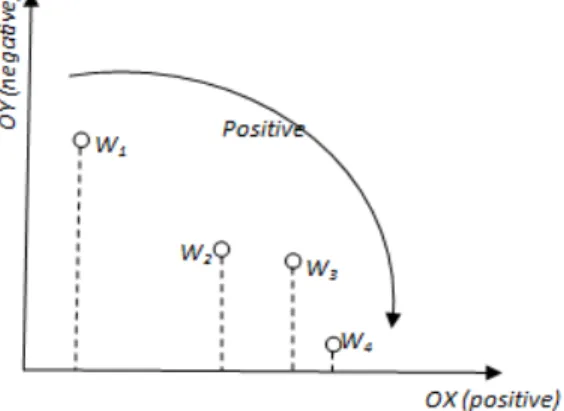
Fig. 4. Sentiment classification word representation
Another example is the one for sentimental classification, when the features that must be counted are the positive and negative opinion within each text, resulting in a two dimension space of points. The more the points are
closer to the OX axis, the positive feature, the more the word is considered to be a positive one. In figure 4, this observation is highlighted.
Also, the clustering techniques can be included in the process of text classification. Knowing that a set of words represented in a certain subspace correspond to a cluster, having a similarity among them is useful information in text classification techniques.
4 Clustering methods
For an in-depth documentary concerning the suitable spatial models used in the process of text classification, a brief overview of the main methods used in literature is done. Clustering analysis is the method used in data mining, information retrieval, and pattern recognition and is a spatial representation model that is defined as an assignment of a set of objects into smaller subsets, called clusters, by the similarity between the objects from the same cluster and the differences among the clusters.
The first differentiation of the methods of clustering analysis is the one of hierarchical and partitioning methods. The hierarchical one is based upon the idea that a set of objects is first splitter into a number of subsets, subsets that, at their turn, will be further divided into other subsets, creating a hierarchical view and separation. By contrary, partitioning methods is build upon the principle of one hierarchical view, meaning that no set of clusters can be or is clustered into a higher level.
Fig. 5. Clustering methods, [8]
A partitional clustering algorithm obtains a single partition of the data. The advantages brought by the partitional clustering are observed in the case of large data sets, when the methods of hierarchical clustering methods generate a computationally prohibitive number of operations, [9]. The disadvantage given by the partitional methods is the one concerning the number of clusters, input data that must be entered before the algorithm to generate the specific clustering separation.
The hierarchical clustering algorithms use a dendogram in order to determine the nested grouping of patterns.
Fig. 6. Dendogram example
Reading from the presented example in figure 6, on the OX axis the distance between each two closest variables is noted, while on
the OY axis the variables that are clustered are observed. The first two nearest objects are the ones that have the smallest distance linkage between them, for out example are 4 and 5. Depending on the number of clusters that the set of objects should be divided, a vertical cut is done within the dendogram, as in figure 7.
Fig. 7. Dendogram cut
number of clusters generated is done within the following considerations:
- the specific of the clustering objects;
- the dendogram distances;
- the specific of the clustering general problem.
For the specific of the clustering objects, the number of clusters can be calculated as being equal to the number of classes from which the objects used as sample training are taking part of. Referring to the specific of the clustering general problem, the number of classes is equal to the total number of different classes from which an object can be clustered in. Those two methods used for dendogram cutting are seen from the social or economic problem, but the third way to cut, from the distances point of view refer to the specific of the sample data used. Such cutting is done as the step where the distance between the objects clustered at the specific time is greater than a given number. For the example from figure 6, the number of clusters is equal to 2 using the distance method.
The standard partitioning methods are K-means, fuzzy c-K-means, SOM, Self Organizing Maps, and neutral gas. This methods use one or more centroids for describing a set of elements and all of them have as a starting point the idea of kernel existence. On the other hand, spectral clustering methods direct the analysis to the spectral graph theory, where a weighted graph is formed from the initial data, conducting to a graph cut problem.
K-means is the most known clustering method used. Its particularities are based upon the fact that an a priori number of clusters, k, must be known before applying the algorithm. The advantages of this method is the flexibility of the distance function used, but as a disadvantage, the concentric rings, a common spatial representation is not correctly distributed into the k clusters resulted. The purpose of the algorithm is to minimize the objective function,
min ∑ ∑ − , where is the
element i from the j cluster, being the number of elements assigned for cluster j.
The steps that the algorithm K-means is formed of are:
- the k clusters are assigned k distinct elements, for each cluster one element;
- while the clusters suffer modification, each element is reassigned to the nearest cluster available, with the condition that for each cycle, the centroid of each cluster is recalculated as the average of all the elements that the cluster is consisted of.
Besides the division of the initial m elements, the advantages brought by clustering techniques are those that divide the whole space of potential elements, creating borders between two enclosed clusters.
Fig. 8. Clusters’ borders
Figure 8 consists in an example of Voronoi set, where the black points are the code vectors, centroids that characterize the specific part of the feature space.
5 Spam filter clustering algorithm
For our example, a set of emails are used, spam and ham, and divided into words, the root for all the analysis. For each word, the number of occurrence in spam messages along with the ham ones are retained, forming points into a two dimension space. For that, the word, Wi(wix, wiy), is a point, with the abscissa, wix, equal to the total number of appearances of the word Wi in all the spam messages, and the ordinate, wiy, equal to the total number of appearances of the word Wi in all the ham messages.
In Figure 9, all the words that appeared in the text messages are represented using the method described above.
Fig. 9. Word spatial representation
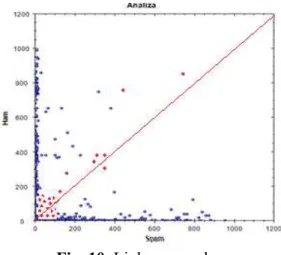
The disadvantage of the previous representation is given by the words that are used as a linkage or are just common for both spam and ham messages. Such messages has an appearance similar as number for spam and ham messages. Those points with the abscise value appropriate to the ordinate value are found besides the first bisectrix from the first xOy dial. Figure 10 highlights those specific linkage words, also called common words.
For such interpretation referring to the linkage or common words, another interpretation is done in terms of clustering and spam and ham membership. Following the first bisectrix a first cluster can be formed, a cluster that is used for the separation of the spam and ham words. What is a spam word? It is a word that frequently is part of the spam messages, while a ham word
appears often in the ham messages. The threshold between those two elements can be manually set or, in our case, selected automatically, with the clustering methods used.
Fig. 10. Linkage word area
For the manually selection, the threshold is equal to:
= %
where:
β – the threshold of spam message, the percentage of appearance of the word in the spam messages, from the total number of appearances in all text messages.
Three decisions result:
> , ℎ
< , ℎ ℎ
= ,
min | − | = , ℎ
min | − | = , ℎ ℎ
min | − | = , where:
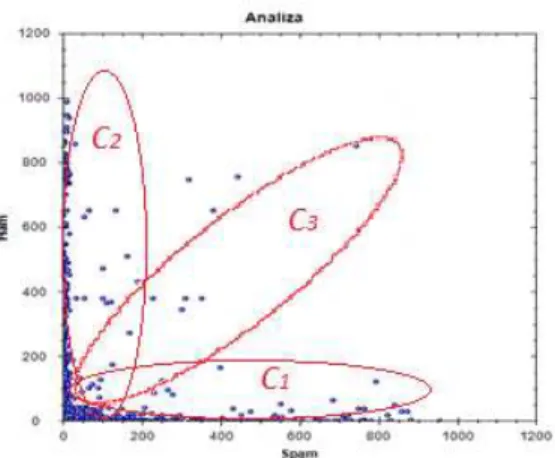
C1– the cluster formed out of the spam words;
C2– the cluster formed out of the ham words; C3– the cluster formed out of the common or linkage words.
The three clusters, C1, C2 and C3 are represented in figure 11. Depending on the specific of the set of messages, the clusters’ orientations can differ.
Fig. 11. Words’ clusters separation
The results from the threshold interpretation are used in the next step of the classification process of text messages, when the aggregation of each word contained in a new text message is done. The words from the C3 clusters are eliminated from the equation because of the fact that their interpretation can deflect the result of the classification of the message as being ham or spam.
Breaking the message M in words implies considering that the probability of the message is equal to the probability of the combined words:
= , ,… ,
When it comes to Bayesian classification, aggregation of the probabilities is achieved by extending the conditional probability formula to the entire set of words that makes
up the message that represents the input data for the classification.
The emergences of the m words of the M message are considered to be independent events and the aggregation can be applied:
=
where:
– the probability of the message M to be spam;
– the probability of the message that contained the word Wi to be spam.
Bayesian classification uses the conditional probability, forming two conjugate probabilities, , presented above,
and as:
= 1 −
The result of the Bayesian classification depends on the evaluation of:
> ,
< , ℎ
The word clustering analysis is used for the reduction in dimension and elimination of the error that can appear when linkage and common words are used in probability aggregation. The model proposed is described using the following formula:
=
min | − | ∈ { ; }
where:
m’ – the number of words that are either ham or spam, with m’<m.
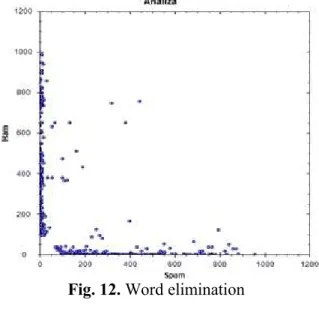
Fig. 12. Word elimination
Similar, = ∏ 1 −
. The evaluation of improvement for the Bayesian classification by using the
clustering analysis, when >
, is given by:
= ,
where:
α – the relation between the new probability distance between the spam and ham and the old probability formed without using the clustering analysis.
If α > 1 then the clustering analysis is improving the evaluation of the Bayesian classifier, meaning that the gap between the spam and ham aggregated probability is greater, resulting in a refined result. When α < 1, the clustering analysis isn’t improving the Bayesian classifier, while, for α = 1, the integration of clustering analysis leaves the probabilities unchanged.
6 Conclusions
Text classification is the technique that increased in importance over the last period when the documents became digital. The evolution of technology generated an exponential increase in the volume of processes information, leading to the need of integrating artificial intelligence in the
domain that includes structure, analyses, organization, search and extraction of information. The need of these techniques is becoming more evident as this volume of information processes is increasing.
Spatial representation, the technique used for correlating points in a set of features, can be used in the process of text classification for an increasing in performance. The principal questions that this method must answer are the one related to sense ambiguity, when a word can have different senses, word synonymous, and word order of appearance in the document analyzed.
Clustering analysis is proposed in the current paper as an a priori step in the process of Bayesian classification, as a filter of the words used in the aggregation of the probabilities. The results of the proposed method are meant to determine a larger gap between the spam and ham evaluation probabilities, in order to determine a better and precise classification.
Future work is directed towards a flexible, optimized text classification with the geometrical point of view shown in the present paper.
Acknowledgments
This work was cofinaced from the European Social Fund through Sectoral Operational Programme Human Resources Development
2007-2013, project number POSDRU/107/1.5/S/77213„ Ph.D. for a career in interdisciplinary economic research at the European standards”.
References
[1] M. Marian, “Ghid de securitate informatica”, Editura Universitaria, Craiova, 2009
[2] A. Zilli, E. Damiani, P. Caravolo, A. Corallo and G. Elia, „Semantic knowledge management: An ontology based framework”, Ed. Information Science Reference, New York, 2008
Applications, Vol. 36, No. 4, 2009, pp. 7764-7772
[4] M. Zurini, ”Training Programs for Body Types using an Intelligent Classifier”,
Body Building Science Journal, Vol. 2, No. 3, 2010, pp. 28-38
[5] X. Qi and B. D. Davison, “Web Page Classification: Features and Algorithms”,
ACM Computing Surveys, Vol. 41, No. 2, 2009
[6] B. Pang, L. Lee and S. Vaithyanathan, “Thumbs up?: sentiment classification using machine learning techniques”,
EMNLP ’02 Proceedings of the ACL-02 conference on Empirical methods in natural language processing, Vol. 10, 2002, pp. 79-86
[7] M.F. Porter, “Snowball: A language for stemming algorithms”, 2001, Available at: http://snowball.tartarus.org/texts/introduct ion.html
[8] A.K. Jain, M.N. Murty and P.J. Flynn, “Data Clustering: A Review”, ACM Computing Surveys, Vol. 31, No. 3, 1999, Available at: http://citeseerx.ist.psu.edu/ viewdoc/download?doi=10.1.1.18.2720&r ep=rep1&type=pdf
[9] Word representation space, Available at: http://metaoptimize.s3.amazonaws.com/c w-embeddings-ACL2010/embeddings-mostcommon.EMBEDDING_SIZE=50.pn g
[10] Spam filtering definition, Available at: http://searchmidmarketsecurity.techtarget. com/definition/spam-filter
Mădălina ZURINI is currently a PhD candidate in the field of Economic Informatics. She graduated the Faculty of Cybernetics, Statistics and Economic Informatics (2008) and a master in Computer Science, having her dissertation given in Implications of Bayesian classifications for optimizing spam filters(2010). She is also engaged in Pedagogical Program as part of the Department of Pedagogical Studies. Her fields of interest are data classification, artificial intelligence, data quality, algorithm analysis and optimizations. She wants to pursue a pedagogical career.
Cătălin SBORA graduated the Faculty of Automatics, Computers and

![Fig. 5. Clustering methods, [8]](https://thumb-eu.123doks.com/thumbv2/123dok_br/18368594.355022/6.918.175.798.127.408/fig-clustering-methods.webp)