Effect of Driver Scope Awareness in the Lane
Changing Maneuvers Using Cellular Automaton
Model
Kohei Arai
Graduate School of Science and Engineering Saga University
Saga, Japan
Steven Ray Sentinuwo
Department of Electrical EngineeringSam Ratulangi University Manado, Indonesia
Abstract—This paper investigated the effect of drivers’ visibility and their perception (e.g., to estimate the speed and arrival time of another vehicle) on the lane changing maneuver. The term of scope awareness was used to describe the visibility required by the driver to make a perception about road condition and the speed of vehicle that exist in that road. A computer simulation model was conducted to show this driver awareness behavior. This studying attempt to precisely catching the lane changing behavior and illustrate the scope awareness parameter that reflects driver behavior. This paper proposes a simple cellular automata model for studying driver visibility effects of lane changing maneuver and driver perception of estimated speed. Different values of scope awareness were examined to capture its effect on the traffic flow. Simulation results show the ability of this model to capture the important features of lane changing maneuver and revealed the appearance of the short-thin solid line jam and the wide solid line jam in the traffic flow as the consequences of lane changing maneuver.
Keywords—scope awareness; lane changing meneuver; speed estimation; spontaneous braking.
I. INTRODUCTION
The simulation model that can express the real traffic condition becomes the most important aspect in the field of traffic analysis and modeling. Study of traffic flow tries to capture and analyze the movement of individual vehicles between two points and the interactions between them. Traffic systems are characterized by a number of entities and features that make them hard to capture, analyze, control, and modify. The real traffic systems are formed by a combination of human interaction, that is interaction between driver entities, and human-environment interaction, such as driver interaction with the vehicle, with traffic information, and with the physical road condition. Studies about traffic and transportation have shown that driver behavior is one of the main contributors to some traffic event or phenomena. Our recent simulation study about the traffic flow showed that the traffic congestion can be influenced not only by the road capacity condition, but also by the driver behavior [1]. The other studies also found the strong
relationship between the driver’ speed behavior and accidents
[2] [3] [4] [5]. Safe driving is a very important element for all the people on the road at any given time. Study of traffic accidents shows that human factors are a sole or a primary contributory factor in road traffic accidents [7]. There are two separate components that affect human factors in driving,
driving skills and driving style [8]. Driving style has a direct relationship to the individual driving behavior. The U.S. Department of Transportation recently reported that driver behavior leading to lane-change crashes and near-crashes [6]. In some countries, the reckless driving behaviors such as sudden-stop by public-buses, tailgating, or vehicles which changing lane too quickly also could give an impact to the traffic flow. The lane changing maneuver is one of the phenomena in the highway. A Lane changing is defined as a driving maneuver that moves a vehicle laterally from one lane into another where both lanes have the same direction of travel. Lane changing maneuvers are occasionally performed in order to avoid hazards, obstacles, vehicle collision, or pass through the slow vehicle ahead. Changing lanes requires high attention and visual demand compared to normal highway of freeway driving due to the need to continually monitor areas around the subject vehicle [9]. However, in the real traffic situations there are some reckless drivers that changing lanes at the moment they signal or who make last minutes decision on the road. Frequent lane changing in roadway could affect traffic flow and even lead to accidents. The lane changing behaviors can be vary depend on the characteristic of the driver [10]. Some crashes accidents typically referred to as Look-But-Fail-To-See errors because drivers involved in these accidents frequently report that they failed to notice the conflicting vehicle in spite of looking in the appropriate direction, commonly occur when drivers change lanes [25]. This mean the driver typically use their perception in order to estimate the speed and the arrival time of the other vehicles before making a maneuver, e.g., lane changing maneuver. A psychology study has shown the accuracy level of this perception may contribute to both failures to detect the collision and to judge the crash risk (e.g., time-to-contact). From a certain distance, a short fixation may be enough to identify an approaching vehicle. Duration of gaze interpreted as the amount of time devoted to processing a stimulus, longer and shorter gazes reflect difficult and simple processing, respectively. Inaccuracy of the gazes duration are likely to reflect a failure to process these stimuli [26].
This paper was interested to investigate the effect of
changing is influenced by the condition of both its current and target lane. The estimation about the gap with ahead and backward vehicle in target lane, includes their speed, will affect the human perception to make a safety lane changing. This paper introduces one of the driver behavior parameter; that is scope awareness parameter. The term of scope awareness was used to describe the visibility required by the driver to make a perception of road condition and the speed of vehicle that exist in that road. Since there are various types of driving skill and style of the drivers that exist in the roadway then the value of scope awareness probabilities could be vary. This studying attempt to precisely catching the lane changing behavior and illustrate the scope awareness parameter that reflects driver behavior. A computer simulation model was conducted to show this scope awareness behavior. In this simulation model, the scope awareness parameter reflected as the length of the road at the adjacent lane that is considered as safely area by the subject driver before making a lane changing.
The Cellular Automata model of Nagel and Schreckenberg (NaSch) [12] was improved to better capture the effect of scope
awareness that reflect drivers’ behavior when making a lane changing. This NaSch model has been modified to describe more realistic movement of individual vehicle when make a lane changing maneuver. Moreover, the recent study of spontaneous braking behavior [1] has been enhanced through the investigation of its relationship with the driver’s scope awareness behavior.
This paper is organized as follows. Some studies relating with traffic modeling principles and this study is quick reviewed in Section 2. Section 3 presents a short description of the theoretical aspect of traffic CA model. Section 4 explains about the proposed model. Section 5 contains simulation process and the results in the form of fundamental diagrams and space-time diagrams. Finally, in section 6, we present a summary and conclusion of this work.
II. RELATED RESEARCH WORKS
Due to the rapid development of computer technology then research about traffic simulation and modeling has increasingly grown. Computer simulation in traffic model has developed from a research tool of experts to a widely used technology for practitioners and researchers in the research, planning, demonstration, and development of traffic systems.
The increasing of computational speed and power make the scope of research of traffic simulation have been growing. Since the early 1950’s, the research simulation have evolved from local road analysis into more complex systems where several type of parameters are integrated in one system. The research about traffic modeling can be divided into two categories: microscopic model and macroscopic model. Microscopic model described traffic behavior as resulting from discrete interaction between vehicles as entities. This microscopic model range from simple analytical models such as car-following model, to more detailed analytical models, such as FRESIM and NETSIM simulation software. While the macroscopic models concern to describe the aggregate traffic behavior phenomena by considering the fundamental relationships between vehicles speed, flow, and density.
Macroscopic models include Input-Output, Simple Continuum, and Higher Order Continuum [27].
Most microscopic models (e.g., the car-following model) use the assumption the all the vehicles have a uniform driving behavior. These microscopic models use deterministic approach and, therefore difficult to capture inherent stochastic nature of real traffic. On the other hand, a major limitation of macroscopic models is their aggregate nature. The macroscopic models concern the traffic flow as continuous system, then these models cannot capture the discrete dynamic aspects that arise from vehicles interaction [27].
The interaction between vehicles has strong relationship with the driver behavior. Some research studies have shown that the driver behavior play an important role for the traffic events. One cause of those traffic events is due to the observations and reactions of drivers are governed by human perception and not by technology based sensor and monitoring systems. The emotional aspect of the driver contributes to the many situations in traffic such as car crashes and congestion [28]. Another study also shown that the driver behavior is a fundamental factor and a key source of complexity in predicting traffic network states unfolding over time [29].
Nagel et.al. [13], discusses two lane traffic and lane changing rules based on a cellular automata model. Furthermore, Arai 1 enhances the original NaSch model by introduced the spontaneous braking parameter as a driver behavior that periodically affect the traffic flow and lane changing decision. However, these models have not considered
about drivers’ visibility and speed estimation of the vehicles
within the monitoring area which may have important
influence on human’ hazard perception and lane changing
decision.
III. TRAFFIC CELLULAR AUTOMATA MODEL
One of the famous microscopic models for the simulation of road traffic flow is Cellular Automata (CA) model. CA is a discrete model studied in computability theory, mathematics, physics, complexity science, theoretical biology and microstructure modeling. In comparison with another microscopic model, the CA model proposes an efficient and fast performance when used in computer simulation [11]. CA is a dynamic model developed to model and simulates complex dynamical system. The set of CA rules may illustrate complex evolution patterns, such as time and space evolution in a system. Those evolutions can be shown just by use simple rules of CA. The CA model consists of two components, a cellular space and a set of state. The state of a cell is completely determined by its nearest neighborhood cells. All neighborhood cells have the same size in the lattice. Each cell can either be empty, or is occupied by exactly one node. There is a set of local transition rule that is applied to each cell from one discrete time step to another (i.e., iteration of the system). This parallel updating from local simple interaction leads to the emergence of global complex behavior.
phenomena that occur in traffic flows[11]. The one dimensional cellular automata model for single lane freeway traffic introduced by Nagel and Schreckenberg (NaSch) [12] is simple and elegant that captures the transition from laminar flow to start-stop waves with increasing vehicle density. This model shows how traffic congestion can be thought of as an emergent or collective phenomenon due to interactions between cars on the road, when the density of cars is high and so cars are close to each on average. The simplicity of the NaSch model has prompted the use of it for studying many traffic situations. The NaSch model also known as stochastic traffic cellular automaton (STCA) because it included a stochastic term in one of its rules. Like in deterministic traffic CA models (e.g., CA-184 or DFI-TCA), this NaSch model contains a rule that reflect vehicle increasing speed and braking to avoid collision. However, the stochasticity term also introduced in the system by its additional rule. In one of its rules, at each time-step t, a random number ξ(t) ∈ [0,1] is generated from a uniform distribution. This random number is then compared with a stochastic noise parameter p ∈ [0,1]. For it is based on this probability p then a vehicle will slow down to (v(i) - 1) cells/time-step. According to NaSch model, the randomization rule captures natural speed fluctuations due to human behavior or varying external conditions [14].
In real traffic, most highways consist two or more lanes. Regarding this road condition, there are a few analytical models for multi-lane traffic. Nagatani was one of the first researchers that introduced a CA model for two lane traffic [24]. His model used deterministic approach and the maximum velocity vmax = 1. Then, building on Nagatani’s model, Ricket et al. [15] considered a model with vmax ≥ 1. Rickert investigated a simple model for two-lane traffic. Their model introduced the lane changing behavior for two lanes traffic. They proposed a symmetric rule set where the vehicle changes lanes if the following criteria are fulfilled:
gap(i) < l (1)
gap0(i) > l0 (2)
gap0,back(i) > l0,back (3)
The variable gap(i), gap0(i), and gap0,back(i) denote the number of empty cells between the vehicle and its predecessor on its current lane, and forward gap on the desired lane, and backward gap on the desired lane, respectively. Rickert also used the parameters which decide how far the vehicle look ahead in current lane for l, ahead on the desired lane for l0, and
how far the vehicle look back on the desired lane for l0,back.
The advance analysis about lane-changing behavior has been done, which includes symmetric and asymmetric rules of lane-changing [16-21]. Symmetric rule can be considered as rules that threat both lanes equally, while asymmetric rule can be applied in special characters highway, like German highways simulation [22], where lane changes are dominated by right lane rather than left lane. While the NaSch model could reproduce some of basic phenomenon observed in real traffic situations such as the start-stop waves in congested traffic, but it has been observed that the base NaSch model
lacks the ability to produce other more realistic traffic patterns [23].
In this paper we consider the parameter of scope awareness of the driver that occur in the real traffic condition. Here, in the real traffic situations, this parameter of scope awareness has a strong relationship with human perception in order to make a lane changing maneuver decisions.
IV. MODEL DEFINITION
This proposed model uses two-lane highway with unidirectional traffic character in periodic boundaries condition. Two-lane model is necessary in order to accommodate the lane changing behavior in the real traffic condition. A one-dimensional chain of L cells of length 7.5 m represents each lane. This value is considered as the length of vehicle plus the distance between vehicles in a stopped position. A one-lane loop consists of 103 cells. There are just two possibility states of each cell. Each cell can only be empty or containing by just one vehicle. The speed of each vehicle is integer value between v = 0,1, . . ., vmax. In this model, all
vehicles are considered as homogeneous then have the same maximum speed vmax = 5. The speed value number corresponds
to the number of cell that the vehicle proceeds at one time step. The state of a road cell at the next time step, form t to t + 1 is dependent on the states of the direct frontal neighborhood cell of the vehicle and the core cell itself of the vehicle.
Rickert et al. [15], among others, have discussed about criteria of safety by introduced the parameters which decide how far the vehicle looks ahead on current lane, looks ahead on desired lane, and looks back on desired lane. Those criteria have to be fulfilled before a vehicle makes a lane changing. However, in real traffic condition, these criteria of safety rules by Rickert are not sufficient to describe driver’s behaviors in highway traffic. This paper introduces a new additional parameter to accommodate the driver behavior when making a lane changing. In addition to considering the gap of cell that consists of vehicle, we also consider about the speed parameter of the other vehicle that situated in the desired lane. In this paper, we discuss in more detail the parameter of scope awareness Sa that reflects the various characters of driver. This
scope awareness parameter takes into account the dynamic characteristic of the driver while decide to make a lane changing. Here, the smaller Sa value reflect the degree of driver
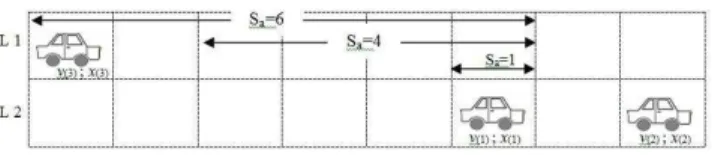
aggressiveness and awareness. Figure 1 describes the scope awareness definition from the perspective of vehicle 1.
The updating rule for lane changing maneuver is done according to a set of rules. The set of rules of the lane changing maneuver is analogous as the liquid movement. Compare to the lane changing model of Ricket et al. [15], there are two basic differences rules in our model. The first one, as the result of traffic conditions ahead of subject driver (eq. (4)), the subject vehicle would consider changing its lane not only due to the comparison value between number of gap and condition which decide how far the vehicle look ahead in current lane (eq. (1)), but also depending on the current speed of the subject vehicle that can be vary based on traffic situation. Another difference is the scope awareness value (Sa). The subject vehicle would
scope awareness area then decide whether possible or not to change the lane (eq. (8)).
Fig. 1 Schematic definition diagram of scope awareness Sa from the perspective of vehicle (1) in its current speed and position v(1); x(1).
At the beginning of each iteration, the subject driver checks whether a lane changing is desirable or not. The subject driver looks ahead to check if the existing gap in the current lane can accommodate his current speed. If not, then due to the randomness number of percentage ratio, the subject driver decides whether he will maintain or decelerate the vehicle speed due to the existing gap number or change his lane. When the subject driver chooses to change lanes, then he looks sideways at the other lane to check whether the cell next to the subject vehicle is empty and the forward gap on the other lane is equal or longer than his current lane. If one cell is unoccupied or free-cell then its state is 0. Moreover, the subject driver also looks back at the other lane to check road condition. In the real traffic situation, a subject driver also has to look back on the other lane in order to estimate the velocity of the following vehicle to avoid a collision. Eq. (8) accommodates the driver behavior that estimate the velocity of vehicle at the moment before making a lane changing.
As mentioned before, this paper uses the parameter of scope awareness Sa which decide how far the coverage area on
the desired lane that is considered as the scope of awareness by the driver. If there is another vehicle within the area of scope awareness then the subject driver estimates the speed of the vehicle in order to avoid collision during the lane changing maneuver. The subject driver will make a lane changing maneuver if the speed of the vehicle that located within the area of scope awareness is less than the existing gap. The lane changing rules can be summarized as follows:
gapsame < vcurrent (4)
cellnext = 0 (5)
rand() < pchange (6)
gaptarget > gapsame (7)
vVehicle,back ≤ gapback ; X(vehicleback) ϵ Sa (8)
The lane changing rules are applied to vehicle that change from right lane to left lane and conversely. Vehicle is only move sideways and it does not advance. Once all the lane changing maneuvers are made then the updating rules from a single lane model are applied independently to each lane. Fig. 2 shows the schematic diagram of lane changing operation. In this fig. 2, the subject vehicle v(1); x(1) is assumed that have current speed v(1)
t
= 3 cell per time step and the parameter of scope awareness Sa = 4 cells.
Fig. 2 Schematic diagram of a lane changing operation.
In order to avoid the introduction of any unrealistic artifacts in the simulation then this proposed model uses eq. (7) to express the more realistic lane changing decision. According to eq. (7), the driver must consider that the forward gap in the desired lane is more than the gap in the current lane. This consideration is important because this proposed model uses the different desired velocities into the vehicles.
Once the lane changing maneuvers are made to all possibility vehicles then the updating rules from a single lane model are applied independently to each lane. Together with a set of lane changing rules, the road state can be obtained by applying the following rules to all by parallel updated:
Acceleration: v(i)→min(v(i)+1, vmax) (8)
Deceleration: v(i) →min(v(i), gapsame(i)) (9)
Driving: x(i) →x(i)+v(i)
V. SIMULATION RESULTS
The simulation starts with an initial configuration of N vehicles, with fixed distributions of positions on both lanes. This simulation uses the same initial velocity for all vehicle vmin = 0 and the maximum vehicle speed has been set to vmax = 5 cell/time-step. The velocity corresponds to the number of cells that a vehicle advances in one iteration. Many simulations
performed with different density ρ. The density ρ can be
defined as number of vehicles N along the highway over number of cells on the highway L.
This traffic model uses close (periodic) boundary conditions. This means that during one simulation, the total number of vehicles on the highway cannot change. Vehicles go from left to right. If a vehicle arrives on the right boundary then it moves to the left boundary. Since this model assumes symmetry character of the both lanes then the traffic flow characteristics on both lanes are identical.
A. Traffic Flow
Fig. 3 The average flow-density diagram of the proposed model (left) is compared to a two-lane traffic system without using scope awareness parameter (right).
A number of interesting observations can be made:
The proposed model reproduces a recognizable diagram of flow towards density relationship. Flow is linearly increasing together with the increases in density level. A
maximum flow level is achieved at density level ρ=0.5
for each value of Sa. After reaches the critical point of
flow at ρ=0.5, the flow at each level of Sa becomes linearly decreasing in density. In other words, the laminar flow turn into back travelling start-stop waves
after density level ρ=0.5. Another thing that also interest
is in the scope awareness value Sa=3, Sa=4, and Sa=5, this simulation produced almost the same flow level at all density levels. Scope awareness value Sa=1 reached the highest number of flow. This may happen because in the Sa=1, the driver can be described as the most aggressive driver, who makes a lane changing maneuver with only consider the empty area beside him. This behavior also confirms the result on fig. 4 that compared the number of lane changing for each value of scope awareness.
Compared to the model without scope awareness consideration (Fig. 3-right diagram), the usage of Sa parameter produced a better flow of vehicles, especially
above density ρ=0.4. This Sa parameter maintained the
traffic to keep flowing by carefully calculate the appropriate time to make a lane changing decision, thus the lane changing maneuver does not disturb the traffic in the target lane.
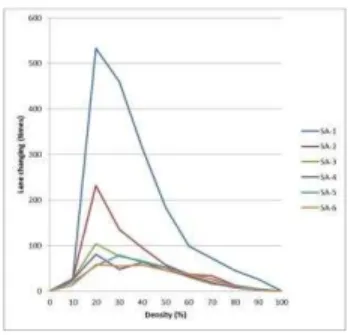
Since the parameter of scope awareness has a strong relationship with the lane changing decision then fig. 4 shown the ratio of lane changing number over density. The results of each Sa value are not surprising. If the distance of scope awareness becomes longer then the lane changing number becomes lower. However, the surprise thing is the behavior of the lane changing variance. For each changes of Sa value into the higher one, the critical point of maximum lane changing decreases almost half than before. The critical point of maximum lane changing for each Sa value is same at
ρ=0.2, except for Sa=5 at ρ=0.3. This is due to the fact that the chances of the vehicles to change the lane become fewer caused by density increases.
Fig. 4 The ratio of lane changing number over density.
B. Space-Time diagram
In order to explore more clearly the effect of scope awareness on the traffic flow then the space-time diagram was reproduced. The space-time diagram represents the location of the vehicles at the certain time. This paper conducted the space-time diagram for density ρ=0.25, ρ=0.5, and ρ=0.75. These three values of density assumed as the light traffic, moderate traffic, and heavy traffic in the real traffic condition, respectively. Fig. 5, fig. 6, and fig. 7 show the result for each density at the all values of scope awareness. To make the comparison fairly then this simulation used initial fixed distributions of positions of the vehicles. The horizontal axis represents space and the vertical axis represents the time. Vehicles go from left to right (space axis) and from top to bottom (time axis).
In the light traffic condition ρ=0.25 (fig.5), it can be seen that the increases of scope awareness distance affect the vehicles flow. Free flow phase showed in Sa=1 diagram (fig.5-a), which are drawn as light area and have a more shallow negative inclination. However, when the Sa value was increased then some solid area starting appear. This solid area with steep positive inclination reflects the traffic jam. One can observed from fig. 5, there are many regions that show the high frequency of short vehicle life lines appearing and disappearing that indicate the great number of lane changing at this traffic
density ρ=0.25. Once the scope awareness increases then this frequency of short vehicle life lines become smaller than before (fig. 5-f).
In the moderate traffic ρ=0.5 (fig. 6), the phenomena that
minimum speed of the vehicle as the consequence of the reduced opportunities for lane changing maneuver.
Fig. 5 Space-time diagram for light traffic condition (density ρ = 25%). Lane changing probability 100%. (a) for Scope awareness Sa=1 ; (b) for Scope awareness Sa=2 ; (c) for Scope awareness Sa=3 ; (d) for Scope awareness Sa=4 ; (e) for Scope awareness Sa=5 ; (f) for Scope awareness Sa=6.
Fig. 6 Space-time diagram for moderate traffic condition (density ρ = 25%). Lane changing probability 100%. (a) for Scope awareness SA=1 ; (b) for Scope awareness SA=2 ; (c) for Scope awareness SA=3 ; (d) for Scope awareness SA=4 ; (e) for Scope awareness SA=5 ; (f) for Scope awareness SA=6.
Fig. 7 Space-time diagram for heavy traffic condition (density ρ = 25%). Lane changing probability 100%. (a) for Scope awareness SA=1 ; (b) for Scope awareness SA=2 ; (c) for Scope awareness SA=3 ; (d) for Scope awareness SA=4 ; (e) for Scope awareness SA=5 ; (f) for Scope awareness SA=6.
However, in the heavy traffic condition (Figure 7), this model showed that the differences value of scope awareness did not affect the traffic condition. In this traffic condition, the opportunity to make a lane changing is very small. This result imply that in the heavy traffic condition, the driver characters that related to lane changing style have no influence to the traffic condition.
VI. SUMMARY AND CONCLUSION
This paper has presented a simple model of the traffic cellular automata to describe a driver behavior in a two lane
highway model. The term of scope awareness introduced to reflect the visibility required by the driver to make a perception of a road condition and the speed of vehicle that exist within the certain area of the road before making a lane changing maneuver. The relation between flow-density and space-time has been investigated in order to examine the effect of scope awareness parameter in the traffic flow. Some conclusions can be observed from this study:
This model describes the realistic traffic situation, in particular capture the situation when driver make a lane changing maneuver. Compared to the conventional approach, the usage of scope awareness model approach produce a better flow of vehicles.
The various value of the scope awareness may represent the characteristic and the experience level of the drivers. The increases of the scope awareness value means the driver become more aware to estimate the road condition in order to make a lane changing maneuver. This proposed model has revealed the phenomena of the
short-thin solid line jam and the wide solid line jam in the traffic flow. This study found that the short-thin solid line caused by the lane changing maneuver of another vehicle from adjacent lane which resulted the subject vehicle has to make a spontaneous braking in order to avoid collision. As the result of this spontaneous braking causing another following vehicles has to adjust or decrease their speed with the vehicle ahead. This phenomenon then produces a short queue of vehicles. On the other hand, a wide solid line appeared as a result of deceleration into the minimum speed of the vehicle as the consequence of the reduced opportunities to make a lane changing maneuver. This simulation results showed that lane changing
maneuvers with taking into account another vehicle speed could reduce the level of traffic congestion. However, in the heavy traffic (high dense) situation, the opportunity to make a lane changing is small, so that the congestion will always exist.
By taking into consideration the scope awareness parameter, the traffic cellular automata model proposed here can reflect certain characteristics of lane changing maneuver in the real traffic situation.
This simulation result can serve as a reference for transportation planning, evaluation, and control. Moreover, this result will pave the way for accurate simulation of a more complex traffic system. Based on the result of this paper, the effect of road shape towards the vehicle deceleration will be studied hereafter.
REFERENCES
[1] K. Arai and S. Sentinuwo, “Spontaneous-braking and lane-changing effect on traffic congestion using cellular automata model applied to the two lane traffic”, (IJACSA) International Journal of Advanced Computer Science and Applications, Vol. 3 (8), 2012.
[3] Nilsson, G. (2004). Traffic safety dimensions and the power model to describe the effect of speed on safety. Lund Bulletin 221. Lund Institute of Technology, Lund.
[4] Salusjärvi, M., 1981. The speed limit experiments on public roads in Finland. Technical Research Centre of Finland. Publication 7/1981. Espoo, Finland.
[5] G. M. Fitch, S. E. Lee, S. Klauer, J. Hankey, J. Sudweeks, and T. Dingus. Analysis of Lane-Change Crashes and Near-Crashes. National Technical Information Service, Springfield, VA 22161, 2009.
[6] Lewin, I. (1982). Driver training a perceptual-motor skill approach. Ergonomics,25, 917–924.
[7] Elander, J., West, R., & French, D. (1993). Behavioral correlates of individual differences in road traffic crash risk: An examination of methods and findings. Psychological Bulletin, 113, 279–294.
[8] Shinar, D., Psychology on the road: The human factor in traffic safety. Wiley New York, (1978).
[9] Sun, D. J., & Elefteriadou, L. (2011). Lane-changing behavior on urban streets: a focus group-based study. Applied ergonomics, 42(5), 682–91. doi:10.1016/j.apergo.2010.11.001.
[10] X. G. Li, B. Jia, Z. Y. Gao, and R. Jiang, “A realistic two-lane cellular automata traffic model considering aggressive lane- changing behavior of fast vehicle,” PhysicaA, vol. 367, pp. 479– 486, 2006.
[11] K. Nagel and M. Schreckenberg, “A cellular automaton model for freeway traffic,” Journal of Physics I France, vol. 2, no. 12, pp.2221 -2229, 1992
[12] K. Nagel, Wolf, Wagner, and Simon, “Two-lane traffic rules for cellular automata: A systematic approach,” Physical Review E, vol.58, no.2, 1998.
[13] S. Maerivoet and B. D. Moor, “Transportation Planning and Traffic Flow Models,” 05-155, Katholieke Universiteit Leuven, Department of Electrical Engineering ESAT-SCD (SISTA), July 2005.
[14] M. Rickert, K. Nagel, M. Schreckenberg, and A. Latour, “Two Lane Traffic Simulations using Cellular Automata,” vol. 4367, no. 95, 1995. [15] W. Knospe, L. Santen, A. Schadschneider, and M. Schrekenberg,
“Disorder effects in cellular automata for two lane traffic,” Physica A, vol. 265, no. 3-4, pp. 614–633, 1998.
[16] A. Awazu, “Dynamics of two equivalent lanes traffic flow model: selforganization of the slow lane and fast lane,” Journal of Physical Society of Japan, vol. 64, no. 4, pp. 1071– 1074, 1998.
[17] E. G. Campri and G. Levi, “A cellular automata model for highway traffic,” The European Physica Journal B, vol. 17, no. 1, pp. 159–166, 2000.
[18] L. Wang, B. H. Wang, and B. Hu, “Cellular automaton traffic flow model between the Fukui-Ishibashi and Nagel- Schreckenberg models,” Physical Review E, vol. 63, no. 5, Article ID 056117, 5 pages, 2001. [19] B. Jia, R. Jiang, Q. S. Wu, and M. B. Hu, “Honk effect in the two-lane
cellular automaton model for traffic flow,” Physica A, vol. 348, pp. 544– 552, 2005.
[20] D. Chowdhury, L. Santen, and A. Schadschneider, “Statistical physics of vehicular traffic and some related systems,” Physics Report, vol. 329, no. 4-6, pp. 199–329, 2000.
[21] W. Knospe, L. Santen, A. Schadschneider, and M. Schreckenberg, “A realistic two-lane traffic model for highway traffic,” Journal of Physics A, vol. 35, no. 15, pp. 3369–3388, 2002.
[22] W. Knospe, L. Santen, A. Schadschneider, and M. Schreckenberg, “Empirical test for cellular automaton models of traffic flow,” Phys. Rev. E, vol. 70, 2004.
[23] Nagatani, T., "Self Organization and Phase Transition in the Traffic Flow Model of a Two-Lane Roadway," Journal of Physics A, Vol. 26, pp. 781-787, 1993.
[24] Shahar, A., Van Loon, E., Clarke, D., & Crundall, D. Attending overtaking cars and motorcycles through the mirrors before changing lanes. Accident; analysis and prevention, 44(1), 104–10, 2012.
[25] Rayner, K., Warren, T., Juhasz, B.J., Liversedge, S.P. The effect of plausibility on eye movements in reading. Journal of Experimental Psychology: Learning, Memory and Cognition 30, 1290–1301, 2004. [26] Benjaafar, S., & Dooley, K. (1997). Cellular automata for traffic flow
modeling. Minneapolis, MN, University of. Retrieved from http://ntl.bts.gov/lib/21000/21100/21189/PB99103996.pdf.
[27] Laagland, J. (2005). How To Model Aggressive Behavior In Traffic
simulation. Retrieved from
http://citeseerx.ist.psu.edu/viewdoc/download?doi=10.1.1.66.2976&rep= rep1&type=pdf
[28] Paz, A., & Peeta, S. (2009). Information-based network control strategies consistent with estimated driver behavior. Transportation Research Part B: Methodological, 43(1), 73–96. doi:10.1016/j.trb.2008.06.007.
AUTHORS PROFILE
Kohei Arai received BS, MS and PhD degrees in 1972, 1974 and 1982, respectively. He was with The Institute for Industrial Science and Technology of the University of Tokyo from April 1974 to December 1978 and also was with National Space Development Agency of Japan from January, 1979 to March, 1990. During from 1985 to 1987, he was with Canada Centre for Remote Sensing as a Post-Doctoral Fellow of National Science and Engineering Research Council of Canada. He moved to Saga University as a Professor in Department of Information Science on April 1990. He was a counselor for the Aeronautics and Space related to the Technology Committee of the Ministry of Science and Technology during from 1998 to 2000. He was a councilor of Saga University for 2002 and 2003. He also was an executive councilor for the Remote Sensing Society of Japan for 2003 to 2005. He is an Adjunct Professor of University of Arizona, USA since 1998. He also is Vice Chairman of the Commission A of ICSU/COSPAR since 2008. He wrote 30 books and published 322 journal papers.