www.atmos-chem-phys.net/12/869/2012/ doi:10.5194/acp-12-869-2012
© Author(s) 2012. CC Attribution 3.0 License.
Chemistry
and Physics
Influence of the North Atlantic Oscillation on air pollution transport
T. Christoudias1, A. Pozzer2,3,*, and J. Lelieveld2,3,4
1Computation-based Science and Technology Research Center, The Cyprus Institute, Nicosia, Cyprus 2Energy, Environment and Water Research Center, The Cyprus Institute, Nicosia, Cyprus
3Air Chemistry Department, Max Planck Institute of Chemistry, Mainz, Germany 4King Saud University, Riyadh, Saudi Arabia
*now at: Abdus Salam International Center for Theoretical Physics, Earth System Physics, Trieste, Italy
Correspondence to:T. Christoudias ([email protected])
Received: 27 July 2011 – Published in Atmos. Chem. Phys. Discuss.: 19 September 2011 Revised: 23 December 2011 – Accepted: 9 January 2012 – Published: 19 January 2012
Abstract. We examined the influence of the North Atlantic Oscillation (NAO) on the atmospheric dispersion of pollu-tion by computing the emission, transport and removal of idealized insoluble gaseous and water-soluble aerosol trac-ers, tagged by the continent of origin. We simulated a period of 50 yr (1960–2010), using the ECHAM5/MESSy1 atmo-spheric chemistry (EMAC) general circulation model. The model accounts for anthropogenic, biogenic and biomass burning sources, removal of trace gases through OH oxi-dation, and precipitation, sedimentation and deposition of aerosols. The model is shown to reproduce the observed spa-tial features of the NAO, moisture transports and precipita-tion. During high NAO phase seasons the axis of maximum westerly North American trace gas transports extends rela-tively far to the north and east over Europe. The NAO phase is significantly correlated with North American insoluble gas and soluble aerosol tracer concentrations over the northwest-ern Atlantic Ocean and across northnorthwest-ern Europe, and with Eu-ropean trace gases and aerosols over Africa and north of the Arctic circle. We find a strong anti-correlation between the phase of the NAO and European pollutant gas concentration over western and central Europe.
1 Introduction
The North Atlantic Oscillation (NAO) is a major recurring large-scale pattern of interannual variability in the atmo-spheric circulation of the Northern Hemisphere. The NAO is manifested by swings in the meridional atmospheric pres-sure difference between the sub-polar and sub-tropical At-lantic Ocean, most prominently during boreal winter, and is associated with changes in the mean wind speed and
di-rection (Hurrell et al., 2003). In periods of higher than av-erage pressure difference (positive NAO phase), when both the tropical high and polar low pressure features are rel-atively stronger, the north-south gradient produces an en-hanced zonal (west to east) flow. When both the tropical high and polar low pressure features are relatively weak (nega-tive NAO phase), the synoptic scale flow has a reduced zonal component. Thus, influences on the interannual variability of hemispheric-scale pollution transport pathways related to the NAO are expected.
has a lifetime of 1–3 months in the atmosphere. Anthro-pogenic CO emissions are distributed similarly to those of many gaseous and particulate anthropogenic pollutants. To obtain a realistic description of tracer lifetime and abundance in the atmosphere we include a removal mechanism through oxidation by the hydroxyl (OH) radical, the main oxidant controlling the oxidizing capacity of the atmosphere. The OH radical is highly reactive and oxidises CO to form car-bon dioxide CO2.
Aerosols are a major component of atmospheric pollution and have important effects on human health (Huntingford et al., 2007), the environment and hydrological cycle (Ra-manathan et al., 2001) and climate (Isaksen et al., 2009). To study the impact of the NAO on tropospheric aerosol pol-lution we simulated the emissions and transport of idealised water-soluble aerosols. To decouple from the effects of initial distributions and allow for the direct comparison of the NAO effects on aerosol transport with those on trace gases, and to highlight differences in removal mechanisms, identical emis-sion patterns are used for gases and aerosols. Aerosols in the present model setup are not chemically active but are affected by sedimentation and dry and wet deposition processes and are predominantly removed from the atmosphere by precipi-tation.
We briefly describe the model in Sect. 2, including the emissions of tagged tracers and removal mechanisms (Sect. 2.1). The simulation of the spatial structure and tem-poral evolution of the NAO is presented in Sect. 2.2. Sea-sonal averages for simulated fields are presented throughout the paper. The analysis of our results regarding the influence of the NAO on the intercontinental transport of tracer gases and aerosols is discussed in Sect. 3. The summary and con-clusions are given in Sect. 4.
2 Model simulation
The EMAC model is a numerical chemistry and climate sim-ulation system that includes sub-models describing tropo-spheric and middle atmosphere processes and their interac-tion with oceans, land and human influences (J¨ockel et al., 2005). It uses the first version of the Modular Earth Sub-model System (MESSy1) to link multi-institutional com-puter codes. The core atmospheric model is the 5th gener-ation European Centre Hamburg general circulgener-ation model (ECHAM5, Roeckner et al., 2006).
MECCA1 (Sander et al., 2005) for tropospheric and strato-spheric chemistry, though highly simplified, RAD4ALL for radiation and heating processes, CLOUD for cloud cover and micro-physics processes including precipitation, and CON-VECT for the vertical transports of trace species associated with convection. The DRYDEP (Kerkweg et al., 2006) and SCAV (Tost et al., 2006, 2007) submodels are used to simu-late aerosol dry and wet deposition processes, respectively.
Large-scale stratiform and small-scale convective precipi-tation are the dominant mechanisms for the removal of water-soluble chemically inert aerosols in the model. Our simula-tion is shown to reproduce the basic features of the average distribution of precipitation observed by Adler et al. (2003, Global Precipitation Climatology Project (GPCP)) in the re-gion of interest between 1979–2004 in Fig. 1. In the do-main 20◦–80◦N and 90◦W–40◦E, average precipitation in excess of 10 cm month−1 follows a southwest to northeast pattern over the Atlantic Ocean with maximum values of the order of 15–20 cm month−1 occurring off the eastern coast of the United States. Finer scale features over the south-eastern United States and the western Scandinavian coast are also reproduced. The model overestimates precipitation over some parts of southern Europe close to the Mediterranean Sea though with an extent and magnitude that is expected to have limited influence on the results.
2.1 Emissions
Fig. 1.Observed (Adler et al., 2003, Global Precipitation Climatology Project (GPCP)) (left) and modeled (right) average precipitation (in cm month−1) between 1979–2004.
Fig. 2.Depiction of the regions used for the computation of emis-sions.
was included using the Global Fire Emissions Database (GFED version 3, van der Werf et al., 2010).
We use the base year 2005 with a monthly temporal resolu-tion climatology for all emissions, except for biomass burn-ing for which a 10 yr monthly average climatology (2000– 2009) is used. The CO tracer is tagged by the regions of emission, i.e. from North America and Europe (see Fig. 2). Emissions from eastern Russia are very small and are not in-cluded in our definition of Europe. We do not account for the atmospheric chemical production of CO (∼1000 Tg yr−1, Seinfeld and Pandis, 1997).
Loss of the tagged CO tracers is computed using the monthly atmospheric concentration of OH from the full-chemistry simulation in Pozzer et al. (2012). CO is removed from the atmosphere via the mechanism:
CO+OH→CO2+HO2
In the absence of a full chemistry mechanism in the model, which would account for the recycling of OH (Lelieveld et al., 2004), we apply the following simplification:
CO+OH→CO2+OH
This ensures a realistic spatio-temporal representation of the lifetime of CO in the atmosphere while preventing that OH is depleted by the reaction with CO.
Aerosols are emitted using regional emission patterns and concentrations identical to CO. This facilitates the direct comparison of the effects of the NAO on the transport of trace gas and aerosol pollutants and their removal mecha-nisms. Water-soluble aerosols with a standard lognormal dis-tribution of mean radius 0.5 µm (σ=1.0) and a molar mass of 96.076 g mol−1(equal to sulfate) with a Henry coefficient equal to 1.0 mol l−1atm−1 and a density of 1841.0 kg m−3 are used.
2.2 North Atlantic Oscillation as represented by EMAC
The EMAC model, forced by the realistic AMIP II sea sur-face temperature and ice coverage boundary conditions, gen-erates its own meteorology and climate variability, which cannot be identical to the true observed variability during the period 1960–2010. Nevertheless, the characteristics of the generated NAO variations (spatial structure and temporal variability) are found to be similar to observations.
There is no unique way to define the spatial structure and temporal evolution of the NAO. We applied several common approaches to evaluate our model. The NAO primary cen-ters of action are identified in maps of 500 hPa geopotential height distributions as regions of maximum anti-correlation over the North Atlantic (Fig. 3). The 500 hPa height time series at a reference point (65◦N, 30◦W) is correlated with the corresponding time series at all points, revealing a north-south dipole, with one centre over the North Atlantic close to the Arctic and the other over the subtropical Atlantic, as expected.
Fig. 3. One-point correlation map of model 500 hPa geopoten-tial height for boreal winter (December-February) over the period 1960–2010. The reference point is 65◦N, 30◦W.
level pressure (SLP) anomalies field (Fig. 4, top) explains 38 % of the total variance and compares well with the NAO pattern observed by Hurrell (2010). In this approach, the NAO is identified from the spatially and temporally mutu-ally orthogonal eigenvectors of the cross-covariance matrix of time varying values of SLP. Again, a north-south pres-sure difference dipole over the Atlantic Ocean in the northern hemisphere is apparent. By regressing the SLP anomalies on the principal component time series the pattern is obtained in terms of pressure amplitude, with maximum departure of the field at the centre of the poles of the order of±3 hPa, in good agreement with the equivalent analysis of observations by Hurrell (2010).
The normalised principal component time series of the leading EOF is correlated to the model seasonal NAO index (determined as the difference in normalised sea level pres-sure between a stationary point at Ponta Delgada, Azores, and a stationary point in Stykkish´olmur/Reykjav´ık, Iceland; adapted from Hurrell, 1995) with a correlation coefficient of 0.93 (Fig. 4, bottom). This result, similar to observations, further indicates that the leading EOF captures the tempo-ral variation also described by the NAO index and allows to interchange the use of the pressure difference index and the EOF time series to diagnose the temporal variation of the pattern.
3 Results
3.1 Vertically integrated transports
The vertically integrated tracer transport vector is defined as
Q=1 g
Z pS
0 qudp
whereq is the tracer mole ratio in mol mol−1, uthe hori-zontal vector wind, andp is pressure; pS denotes surface pressure andgrepresents gravity. This variable is analogous
Fig. 4. Top: leading empirical orthogonal function (EOF1) of the winter (December–February) mean sea level pressure (SLP) anoma-lies in the North Atlantic sector (20◦–80◦N, 90◦W–40◦E) which explains 38 % of the total variance. The pattern is displayed in terms of amplitude (hPa), obtained by regressing the SLP anomalies on the principal component time series. Bottom: principal component time series (red, blue) of the leading EOF plotted with the modeled NAO index (black) based on the normalised SLP difference be-tween Ponta Delgada, Azores, and Stykkish´olmur/Reykjav´ık, Ice-land. The correlation coefficient is 0.93.
to the vertically integrated moisture transport (see Fig. 5), which was used to test our model simulation against the ob-servations compiled by Hurrell (1995). During seasons of low or negative NAO index moisture transport over the At-lantic Ocean follows a westerly zonal path with maximum vector magnitudes occurring in the western part of the do-main, stretching across the mid-Atlantic. During seasons of high NAO index the axis of maximum moisture transport shifts to a more southwest-to-northeast orientation over the Atlantic and extends farther to the northern and eastern part of Europe.
Fig. 5.Average vertically integrated moisture (in kg kg−1) transport vectors for winters with low or negative (left) and high (right) EOF time series. Red contour lines correspond to vector magnitudes.
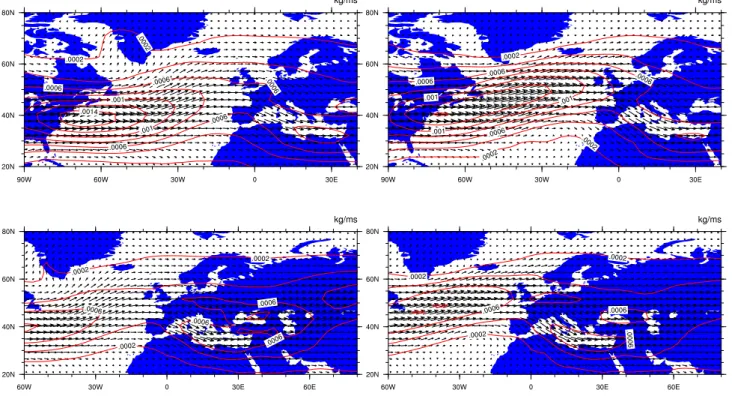
Fig. 6. Average vertically integrated CO tracer (in mol mol−1) transport vectors with North American origin (top) and European origin (bottom) for winters with low or negative (left) and high (right) EOF time series. Contour lines correspond to vector magnitudes.
CO tracer originating in Europe shows similar results over the Atlantic Ocean and a relative increase in transport over mainland Europe towards the East (Fig. 6, bottom).
3.2 NAO index – tracer concentration correlation
After identifying the principal component time variation, we examine the relation of the NAO with tracer concentrations. The correlation of the principal component time series with gas and aerosol concentration anomalies has been calculated for the model surface level and for the meridional vertical profile at 30◦W. The results can be seen in Figs. 7 and 8 for the gaseous tracers and aerosols originating in the North American and European regions, respectively.
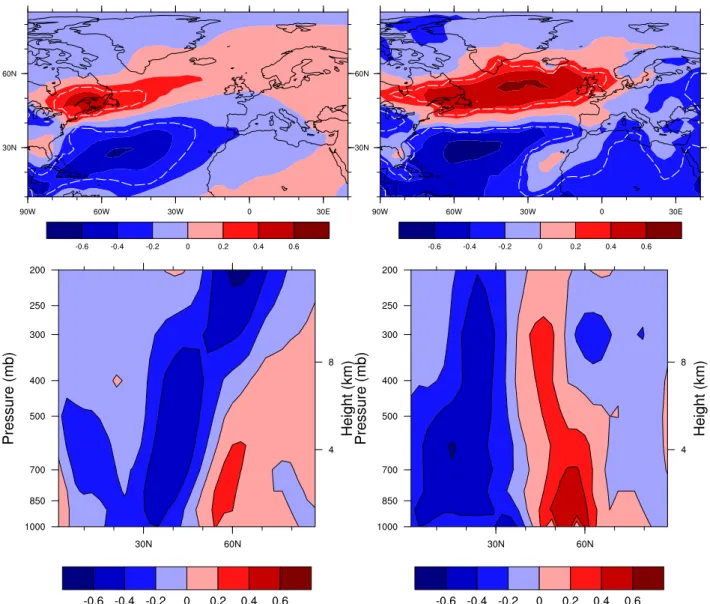
Fig. 7.Correlation of winter (December–February) seasonal surface concentration anomalies (top) and meridional vertical profiles at 30◦W (bottom) with the principal component of the EOF time series of SLP in the North Atlantic sector for gaseous tracers (left) and soluble aerosols (right) emitted from North America. White dashed contour lines indicate the local 95 % level of significance.
During conditions associated with the negative NAO phase, transport is directed more strongly to the east and southeast as opposed to the more northeastward flow un-der positively high NAO phase. This is suggested by the anti-correlation of the CO tracer over the western parts of Africa. The correlation changes to positive values over the eastern parts of Africa. This is probably related to enhanced transport of North American CO during high NAO along an anticyclonic path first leading towards northern Europe and then southwards to eastern Europe and finally onwards to Africa. A stronger Azores High during the positive NAO phase leads to enhanced north to south transport over Eastern Europe. This pathway can potentially have a different effect on the water-soluble tracer due to efficient washout along this path, leading to reduced soluble aerosol concentrations dur-ing high NAO.
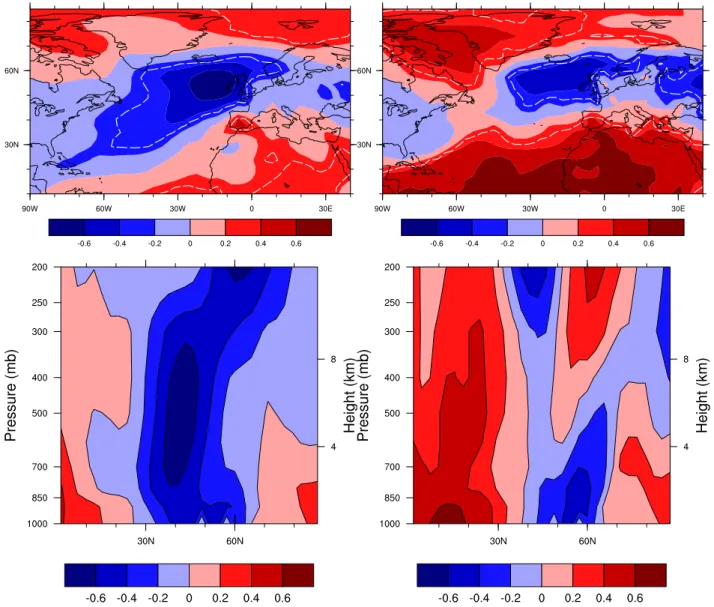
Fig. 8.Correlation of winter (December-February) seasonal surface concentration anomalies (top) and meridional vertical profiles at 30◦W (bottom) with the principal component of the EOF time series of SLP in the North Atlantic sector for gaseous tracers (left) and soluble aerosols (right) emitted from Europe. White dashed contour lines indicate the local 95 % level of significance.
northward transport over the northern parts of Europe and en-hanced southward transport over the southern parts. The Eu-ropean tracer is thus relatively depleted over central Europe, as it is either carried towards southern Europe and northern Africa (creating positive anomalies there) under the influence of the Azores High, or to the Arctic under the influence of the Icelandic low.
During conditions associated with the negative NAO phase, conversely, the air is more stagnant over Central Eu-rope allowing EuEu-ropean pollutants to accumulate. The strong negative anomaly over the western Atlantic is thus simply an effect of reduced direct outflow of European air pollu-tion to this region due to the enhanced north-south pressure gradient and associated westerlies. In the vertical profiles, a strong anti-correlation centred at 500 hPa, with a vertical
mechanisms were included based on oxidation of CO by the OH radical and sedimentation and dry and wet deposition of aerosols. The model simulation of the boreal winter NAO spatial pattern was tested against observations using common and established approaches. Good agreement with results re-ported from observations was obtained throughout.
The NAO phase is related to pollution transport from North America towards Europe, mostly in the free tropo-sphere. The NAO is associated with stronger-than-average westerlies across the middle latitudes of the Atlantic that transport air pollution from North America towards Europe and Northwestern Africa, similar to moisture transport.
The NAO exerts a clear influence on the atmospheric dis-tribution of aerosol pollution. The NAO phase strongly af-fects the magnitude and direction of moisture transport, in-cluding water-soluble aerosols emitted in North America and Europe, over the Atlantic Ocean. The NAO also affects the location and extent of the spatial pattern of precipitation. During high NAO index periods, drier than average condi-tions occur over much of central and southern Europe, the Mediterranean and parts of the Middle East, whereas more precipitation than average falls over a region from Iceland through Scandinavia (Hurrell, 1995). As precipitation is the main mode of removal of water-soluble aerosols from the atmosphere, the distribution of particulate pollutants, espe-cially from Europe, is indirectly influenced by the NAO. The response of the aerosols is relatively strong, as they are in-fluenced both by NAO-related transport and wet deposition anomalies, whereas CO is unaffected by precipitation.
Hurrell (1995) concludes that decadal variability in the NAO has become especially pronounced since 1950, with unprecedented strongly positive index values since 1980. If this trend persists, e.g. associated with climate change (In-tergovernmental Panel on Climate Change, 2007), it can be expected that in the future the NAO will have a growing in-fluence on intercontinental pollution transport between North America and Europe and from Europe towards the Arctic.
Acknowledgements. We are most grateful for the comments, con-structive criticism and very useful suggestions by the anonymous referees. The research leading to these results has received funding from the European Research Council under the European Union’s Seventh Framework Programme (FP7/2007-2013)/ERC grant agreement no. 226144.
Edited by: B. Vogel
uals and its relationship to the North Atlantic Oscillation, At-mos. Chem. Phys., 3, 2053–2066, doi:10.5194/acp-3-2053-2003, 2003.
Dentener, F., Keating, T., and Akimoto, H. (Eds.): Hemispheric Transport of Air Pollution, United Nations, ISBN: 978-92-1-117043-6, 2010.
Doering, U., Monni, S., Pagliari, V., Orlandini, L., van Aardenne, and SanMartin, F.: CIRCE report D8.1.1 “ Emission inventory for the past period 1990–2005 on 0.1×0.1 grid ”, Tech. rep., Project FP6: 6.3 , No. 036961, 2009a.
Doering, U., van Aardenne, J., Monni, S., Pagliari, V., Orlandini, L., and SanMartin, F.: CIRCE report D8.1.2 - Evaluation emission database 1990-2005, Tech. rep., Project FP6: 6.3, No. 036961, 2009b.
Eckhardt, S., Stohl, A., Beirle, S., Spichtinger, N., James, P., Forster, C., Junker, C., Wagner, T., Platt, U., and Jennings, S. G.: The North Atlantic Oscillation controls air pollution transport to the Arctic, Atmos. Chem. Phys., 3, 1769–1778, doi:10.5194/acp-3-1769-2003, 2003.
Eyers, C. J., Addleton, D., Atkinson, K., Broomhead, M., Christou, R., Elliff, T., Falk, R., I., G., Lee, D. C. M., Michot, S., Middel, J., Newton, P., P., N., Plohr, M., Raper, D., and Stanciou, N.: AERO2k, Global Aviation Emissions Inventories for 2002 and 2025, Tech. rep., QINETIQ/04/01113, 2004.
Guenther, A., Hewitt, C. N., Erickson, D., Fall, R., Geron, C., Graedel, T., Harley, P., Klinger, L., Lerdau, M., McKay, W. A., Pierce, T., Scholes, B., Steinbrecher, R., Tallamraju, R., Taylor, J., and Zimmerman, P.: A global model of natural volatile or-ganic compound emissions, J. Geophys. Res., 100, 8873–8892, 1995.
Hoor, P., Borken-Kleefeld, J., Caro, D., Dessens, O., Endresen, O., Gauss, M., Grewe, V., Hauglustaine, D., Isaksen, I. S. A., J¨ockel, P., Lelieveld, J., Myhre, G., Meijer, E., Olivie, D., Prather, M., Schnadt Poberaj, C., Shine, K. P., Staehelin, J., Tang, Q., van Aardenne, J., van Velthoven, P., and Sausen, R.: The impact of traffic emissions on atmospheric ozone and OH: results from QUANTIFY, Atmos. Chem. Phys., 9, 3113–3136, doi:10.5194/acp-9-3113-2009, 2009.
Huntingford, C., Hemming, D., Gash, J., Gedney, N., and Nuttall, P.: Impact of climate change on health: what is required of climate modellers?, Transactions of the Royal Society of Tropical Medicine and Hygiene, 101, 97–103, doi:10.1016/j.trstmh.2006.11.001, 2007.
Hurrell, J. W.: Decadal Trends in the North Atlantic Oscillation: Regional Temperatures and Precipitation, Science, 269, 676– 679, 1995.
Hurrell, J. W.: CGD’s Climate Analysis Section: Detailed Descrip-tions of Climate Indices, http://www.cgd.ucar.edu/cas/jhurrell/ indices.info.html#naopcd%jf, 2010.
Overview of the North Atlantic Oscillation, in: The North At-lantic Oscillation: Climatic Significance and Environmental Im-pact, edited by: Hurrell, J. W., Kushnir, Y., Ottersen, G., and Visbeck, M., 1–35, Geophysical Monograph, 2003.
Intergovernmental Panel on Climate Change: Climate Change 2007: The physical Science Basis, in: The Properties of Gases and Liquids, 3rd edition, edited by: Solomon, S., Qin, D., Man-ning, M., Chen, Z., Marquis, M., Averyt, K. B., Tignor, M., and Miller, H. L., IPCC Fourth Assassement report (AR4), 2007. Isaksen, I. S. A., Granier, C., Myhre, G., Berntsen, T. K., Dalsøren,
S. B., Gauss, M., Klimont, Z., Benestad, R., Bousquet, P., Collins, W., Cox, T., Eyring, V., Fowler, D., Fuzzi, S., J¨ockel, P., Laj, P., Lohmann, U., Maione, M., Monks, P., Prevot, A. S. H., Raes, F., Richter, A., Rognerud, B., Schulz, M., Shin-dell, D., Stevenson, D. S., Storelvmo, T., Wang, W.-C., van Weele, M., Wild, M., and Wuebbles D.: Atmospheric compo-sition change: Climate-Chemistry interactions, Atmos. Environ., 43, 5138–5192, 2009.
J¨ockel, P., Sander, R., Kerkweg, A., Tost, H., and Lelieveld, J.: Technical Note: The Modular Earth Submodel System (MESSy) – a new approach towards Earth System Modeling, Atmos. Chem. Phys., 5, 433–444, doi:10.5194/acp-5-433-2005, 2005. J¨ockel, P., Tost, H., Pozzer, A., Br¨uhl, C., Buchholz, J., Ganzeveld,
L., Hoor, P., Kerkweg, A., Lawrence, M. G., Sander, R., Steil, B., Stiller, G., Tanarhte, M., Taraborrelli, D., van Aardenne, J., and Lelieveld, J.: The atmospheric chemistry general circulation model ECHAM5/MESSy1: consistent simulation of ozone from the surface to the mesosphere, Atmos. Chem. Phys., 6, 5067– 5104, doi:10.5194/acp-6-5067-2006, 2006.
Kerkweg, A., Buchholz, J., Ganzeveld, L., Pozzer, A., Tost, H., and J¨ockel, P.: Technical Note: An implementation of the dry removal processes DRY DEPosition and SEDImentation in the Modular Earth Submodel System (MESSy), Atmos. Chem. Phys., 6, 4617–4632, doi:10.5194/acp-6-4617-2006, 2006. Lelieveld, J., Dentener, F. J., Peters, W., and Krol, M. C.: On the
role of hydroxyl radicals in the self-cleansing capacity of the tro-posphere, Atmos. Chem. Phys., 4, 2337–2344, doi:10.5194/acp-4-2337-2004, 2004.
Li, Q., Jacob, D. J., Bey, I., Palmer, P. I., Duncan, B. N., Field, B. D., Martin, R. V., Fiore, A. M., Yantosca, R. M., Parrish, D. D., Sim-monds, P. G., and Oltmans, S. J.: Transatlantic transport of pollu-tion and its effects on surface ozone in Europe and North Amer-ica, J. Geophys. Res., 107, ACH 4, doi:10.1029/2001Jd001422, 2002.
Moulin, C., Lambert, C. E., Dulac, F., and Dayan, U.: Control of atmospheric export of dust from North Africa by the North At-lantic Oscillation, Nature, 387, 691–694, 1997.
Pozzer, A., J¨ockel, P., and Van Aardenne, J.: The influence of the vertical distribution of emissions on tropospheric chemistry, At-mos. Chem. Phys., 9, 9417–9432, doi:10.5194/acp-9-9417-2009, 2009.
Pozzer, A., de Meij, A., Pringle, K., Tost, H., Doering, U. M., van Aardenne, J., and Lelieveld, J.: Aerosol simulation with high res-olution emissions with the EMAC model, Atmos. Chem. Phys., in press, 2012.
Ramanathan, V., Crutzen, P., Kiehl, J., and Rosenfeld, D.: Aerosols, climate, and the hydrological cycle, Science, 294, 2119–2124, 2001.
Roeckner, E., Brokopf, R., Esch, M., Giorgetta, M., Hagemann, S., Kornblueh, L., Manzini, E., Schlese, U., and Schulzweida, U.: Sensitivity of simulated climate to horizontal and vertical reso-lution in the ECHAM5 atmosphere model, J. Clim., 19, 3771– 3791, 2006.
Sander, R., Kerkweg, A., J¨ockel, P., and Lelieveld, J.: Technical note: The new comprehensive atmospheric chemistry module MECCA, Atmos. Chem. Phys., 5, 445–450, doi:10.5194/acp-5-445-2005, 2005.
Seinfeld, J. H. and Pandis, S.: Atmospheric Chemistry and Physics: From Air Pollution to Climate Change, Wiley-Interscience, 1997.
Simpson, D., Fagerli, H., Jonson, J., Tsyro, S., Wind, P., and Tuovi-nen, J.-P.: Unified EMEP Model Description., Tech. rep., Nor-wegian Meteorological Institute, 2003.
Taylor, K., Williamson, D., and Zwiers, F.: The sea surface temper-ature and sea ice concentration boundary conditions for AMIP II simulations; PCMDI Report, Tech. Rep. 60, Program for Climate Model Diagnosis and Intercomparison, 2000.
Tost, H., J¨ockel, P., Kerkweg, A., Sander, R., and Lelieveld, J.: Technical note: A new comprehensive SCAVenging submodel for global atmospheric chemistry modelling, Atmos. Chem. Phys., 6, 565–574, doi:10.5194/acp-6-565-2006, 2006.
Tost, H., J¨ockel, P., Kerkweg, A., Pozzer, A., Sander, R., and Lelieveld, J.: Global cloud and precipitation chem-istry and wet deposition: tropospheric model simulations with ECHAM5/MESSy1, Atmos. Chem. Phys., 7, 2733–2757, doi:10.5194/acp-7-2733-2007, 2007.