Vol-7, Special Issue3-April, 2016, pp392-403 http://www.bipublication.com
Research Article
Comparison of Pinavia Interchange Vs Interchange's All Directional and
Nano of Traffic Operation and Safety with Traffic simulation
Abolfazl samadi Heidar Abadi*1 and Ali Abdi2
1
M.Sc. of Highway and Transportation Engineering Islamic Azad University, Science and Research Branch, Tehran
2
Assistant Prof., Highway and Transportion Eng. Dept., Imam Khomeini International University
ABSTRACT
in this study, one of the newest types of interchange, which has recently attracted the attention of researchers and designers, i.e. Pinnavia and one of most recent interchange, i.e. the nano interchange and one of the world's most popular interchange, ie the all directional interchange are thoroughly investigated and the reasons for using it will be expressed. In this research, replacement of the Pinnavia interchange with the nano interchange, the all directional interchange with the input vehicle volume of 10000 in an hour and speeds of 70 and 90 km/sec, 2 percent of 10% and 20% heavy vehicles, two turnover ratio of 70 to 30 of left heavy, direct-equal of 50 to 50, under the number of 24 scenarios have been studied using a microscopic simulation by the AIMSUN software. Traffic operation analysis was conducted for the whole interchange. Moreover, parameters of Speed, Delay Time and, Density were compared. SSAM is an application that evaluates the traffic safety by the traffic noise and processing of vehicles routing. Interchange occurs when two road users are in collision position with no escape possibility. The safety estimation has been carried out for the whole interchange with the traffic volume of 10000 vph in highway, ramp volume of 1600 and 1000 vehicles in houre and 20% heavy vehicles which is one f the worst scenario cases. The results of this research reveal the better performance of the nano interchange in most traffic parameters such as, delay time,density and average speed. In terms of safety, the pinnavia interchange operation is better than the performance of the nano and All-directional Interchanges. Moreover, speed increment made a better traffic performance in the pinnavia interchange. In other words, operation of the the pinnavia interchange is better than the performance of the nano and All-directional Interchanges in the speed of 90 Km/h.
Key world: Traffic Operation, Safety, pinnavia, nano, All Directional,
1. INTRODUCTION
While the annual budget for the implementation of projects to improve the performance of road traffic flow and decrease of mental time travel in the city, establishing as well as reduce traffic load in high density cities spend. In some cases, due to lack of comprehensive studies, the effect of undesirable impacts on the entire urban network will. Construction of interchanges with high-cost projects component, Physical isolation with the aim of creating a continuous traffic flow and traffic extracted routes and low delay time and increase the capacity of interchange s. Hence the choice of the best type of traffic that
increase safety in the comment, the design of the interchange. One of the problems that exist in the community use of the experiences and achievements of other countries and using it without studying specific Iran-country conditions. The result of such an undertaking, although maybe be useful at first, but continue on with regard to the conditions of our country and culture with other countries is different, and at first the terms yet, may cause a several problems in the future.(Samadi,2016).
Since the pinavia interchange in no country is not made only in the city of Vilnius, Lithuania in the research plan of the country. As well as Nano interchange is not made in any country and its first original design by two students at the University of North Carolina is raised, So for employing it in Iran must be that all conditions are checked.
In this study three interchanges under two
modes have been compared with the
encapsulation. In the first part of the pinavia interchange and traffic for all in terms of performance, such as: delay Time, Densitey, Speed Mean For the entire interchange under microscopic-scale simulation method using the Aimsun Simulator traffic and compare the. In the second part of three interchange s separately about the safety performance evaluation of simulation software based on two types of collisions: 1. change the Line 2. The crash of the back
2. Overview research:
With the publication of internal papers on the Internet and in between questions that are of the masters. So far in Iran, explores the pinavia interchange and compare it with the new Nano interchange direction. Design of the pinavia interchange in 2008 by the senior engineer and lecturer in the Department of engineering management of the country's Military Academy of Lithuania has pioneered this project
(AušriusJuozapavičius, 2014). A new type of road junction connecting perfectly pinavia and was recorded in the year 2011. Therefore, despite its various dimensions of the issue recently continued especially in the comparative
assessment and discussion with other interchanges can be studied. Design of the interschange of the Nano, the first time by two students of civil engineering, University of the State of North carolina names J-moon and j hang u , both of which were under the supervision of Dr. Hummer activity. Moon on November 2004 plan your presentation, and then "J- HANG U" in the previous study, completed in the year 2005 your project starts and ends in the year 2007 range (Harris, 2007). The present research on the interchange of the pinavia with two other simulation of interchange under different scenarios considered traffic And also after the simulated interchange safety are evaluated and the result is compared to each of the untamed are built. If the overall look about the process of doing research. In the first part of the research, introduced the simulated interchange and past research that found on the desired interchange is taken, In the second part of the research, the design and replacement of the interchange of pinavia and nano and analyzed all the direction given. In the third part of the process of doing the work and simulation of traffic in every interchange , and the performance of the State's total safety performance evaluation of the entire interchange . In the fourth part presents the results of research and research findings. In the fifth part of the research to the conclusion of future research opportunities In the case of reviews made history research about the Pinavia and Nano interchanges research with no subject in Iran has pinavia interchange and only 4 article abroad with the subject of the interchange there is pinavia interchange . And also about the history of nano research thesis and the interchange of the two outside the country, there are two articles.
INTERCHANGE OF A NEW 1 GENERATION PINAVIA" (AušriusJuozapavičius, 2014). In the third and fourth articles of the same title
"IMPROVEMENT POSSIBILITIES OF
VILNIUS CITY TRANSPORTATION
SYSTEM BY USING PINAVIA
INTERCHANGE” with the use of the interchange of the pinavia that this article is using simulators, as well as by employing the four interchange points in the four North-South and East-West vlinius city is done (Aušrius, 2010). Article about the first dissertation in 2007 Nano as nano-interchange scheme as an all direction interchange which has been using the Vissim simulation to examine different scenarios the traffic (Harris, 2007). At the end of the next letter in the year 2009 as the Nano-interchange of geometric designs characteristic of economic and privacy the way that completing thesis year 2007 and more complete in terms of geometric design and the required amount of privacy and economic way (Meredith L. , 2009). At the interchange of the two articles first article titled "introduction to nano Nano interchange" in 2010 on the thesis of the year 2007. To introduce the Nano interchange and its advantages and disadvantages (Jae-Pil, 2010). And also the second article entitled "save space using the interchange of nano-interchange" in 2011 to save urban areas dense with use of privacy the way required by the interchange of the Nano (Jae-Pil Moon, 2011). After doing exploring texts and essays and thesis mentioned in the previous section and the existence of a vacuum and gaps in the past about the pinavia interchange content and the Nano interchange that any direct comparison between these two interchanges. So to do the present project reviews and comparisons with two other interchange s such as pinavia interchange is a junction of common and frequently asked questions that are made in the country. That is, All-directional and crossing an interchange called the new Nano, which is the primary route to the preliminary studies and in no place has not yet been made about cloning and comparison. And to answer the question that is
the pinavia interchange traffic in terms of performance and safety can be a good alternative to conventional interchange s. That answers these questions at the end of the letter (s. a. Samadi 94).
The introduction of the pinavia interchange
pinavia interchange with unusual characteristics in spite of normal traffic flow distribution function and free access to a large area needs, That could be for logistics centers or Park and ride system is suitable, As well as a strategy for rebuilding the infrastructure of shhrast, where the unique features of this new interchange will allow that without any change to the road infrastructure in the downtown section to solve the problems of traffic congestion by attracting
investors from the private sector
(AušriusJuozapavičius, 2014). The first describes about the interchange of various visual layout pinavia, And follow these descriptions take advantage of the public transportation system in the urban transport system. More versatile the pinavia interchange, and it reduces the flow of traffic compared to other interchange s. A different alternative is the pinavia interchange in Figure 1 can be viewed.
Figure 1: different pinavia interchange alternative The introduction of the Nano interchange
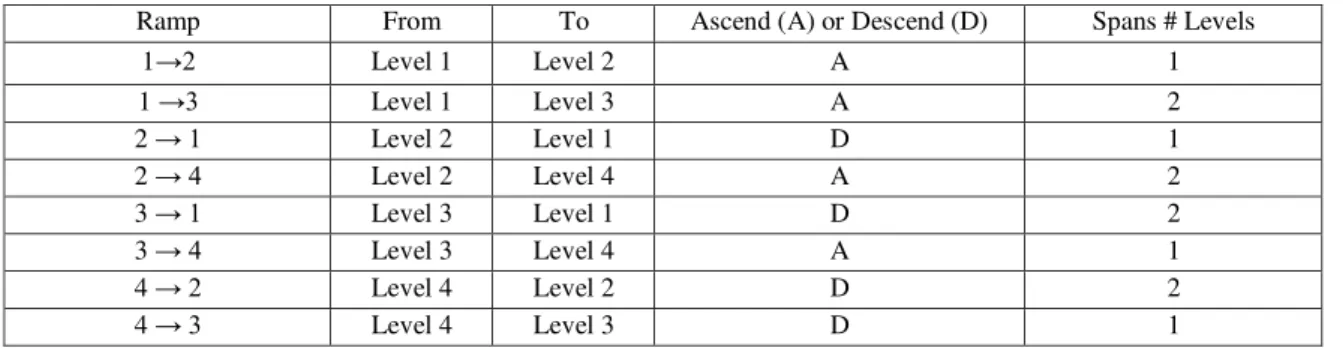
Nano-interchange directly to two-track so that the freeways because of the different levels in the two ramps are connected by direct. Figure 2 displays the view exists, the Nano approach . As shown in Figure 4-1 table 2 and specified path at the highest altitude level. And then to arrange the route 3 and 2 and 1. As well as table 1 how to connect and get the status of the ramps.
Figure 2: image Nano interchange
Table 1: move in the Interchange of nano 3. The hypothesis
1. In terms of performance pinavia of two traffic Nano-interchange and all-direction interchange is more suitable.
2. pinavia interchange of two interchange safety Nano-interchange and all-direction interchange is more suitable.
4. Do the research
For a detailed comparison of the performance traffic of pinavia and all-directional and nano interchange's, the volume is different from the flow of traffic in the form of different scenario with the size of the vehicle at 10000 on the model application. For each scenario, 70 and 90 km two speed ramps on the clock and two values 10 and 20 percent heavy vehicles was considered. The value of the traffic volume on the ramps in two heavy left circulation mode with the ratio of traffic volume, 70 to 30 and the
mode is equal to the ratio of the volume of traffic in terms of fifty to fifty. Generally three types of interchange s, 2 speed, 2 type than on the traffic flow to the left and right ramps, and 2 the percentage of heavy vehicles, which comes in a different mode, a total of 24. The head of each scenario, the model 15 times for an hour (8 to 9 in the morning traffic peak) in software implementation and output it as average. Generally, the number of times that the software runs is equal to:
The 2 ratio flow left and equal move × and 2 the amount of the percentage of heavy vehicles × 2 different interchange the ramp speed × 3 interchange's × 15 repetitions = 360 software run in total
For a detailed comparison between Safety the pinavia And Nano-interchange not made due to these interchange s and the lack of information
from police reports and accident collision points, compared with safety real accidents is not possible. Due to the nature of being probabilistic and accidents, the above process for the evaluation of road safety in the hands of the construction cannot be used. Hence one of the methods that are used in these terms, the equivalent of a safety assessment. In this respect, with the SSAM is software conflict analysis and processing of traffic safety traffic cars, track's assessment. The purpose of the interference, it is time that the two users that no practical road, leading to the escape at the position of the collision (Lili Pu and Rahul Joshi, 2008). The application of simulation analysis with information that receives such as Aimsun microscope: the position of the cars, speed, acceleration and braking, the probability of hitting the cars measurements. This software is based on two types of collisions: 1. change the
Spans # Levels Ascend (A) or Descend (D)
To From
Ramp
1 A
Level 2
Level 1 1→2
2 A
Level 3
Level 1 1 →3
1 D
Level 1
Level 2 2 → 1
2 A
Level 4
Level 2 2 → 4
2 D
Level 1
Level 3 3 → 1
1 A
Level 4
Level 3 3 → 4
2 D
Level 2
Level 4 4 → 2
1 D
Level 3
Level 4 4 → 3
Line 2. The crash of the back to estimate the probability of colliding cars.
The estimate for the whole Safety interchange and with the volume of traffic on the freeway and in 6000 vph volume ramps vph 1000 and 1600 vph and 20% of heavy vehicles, which is one of the worst cases scenario. Also in this study, try to be the criterion of time to collision (TTC) at the level of safety compared to the entire network of each of the scenarios were selective. TTC time interval, which is expected to double by the length of the vehicle, if it should continue with its current speed of the current in the line to continue their movement, to deal with each other. TTC a measure which had most of the other indicators in the software used in this study, SSAM threshold of TTC, 1.5 seconds in order to. It was thus that the software all TTC that more than 1.5 seconds, the calculations will not be imported.
After performing the desired simulation to the analysis of sensitivity. The order of sensitivity analysis in order to know that, with the increase or decrease a value of input parameter
simulation software how much output
parameters on the impressive and effective. To do so the two types of heavy vehicle 10 percent and 20 percent, and the two types of speed of 70 and 90 km/h for the analysis of the sensitivity of the method. In general the output obtained from Aimsun software and compared for each interchange SSAM to the interchange of the pinavia And Nano And all direction in table 2.
Table 2: the output obtained from Aimsun software and SSAM for each interchange
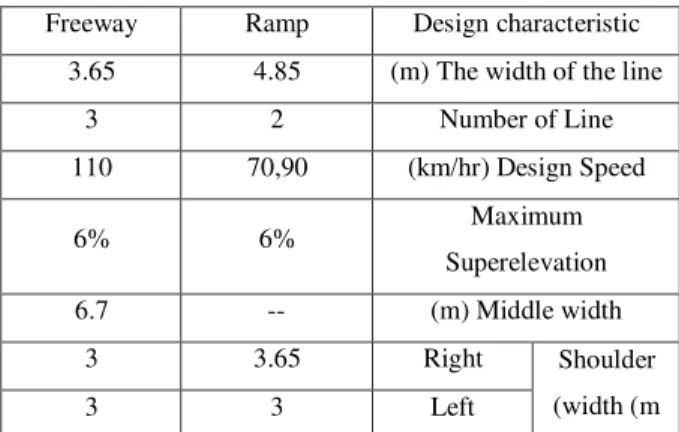
In table 3 the overall design of the attributes for each of the three standards-based interchange ASHTO (HIGHWAY DESIGN MANUAL, 2011) and (the geometric plan of the regulations
the way journal 161, 1375) and (geometric way plan regulations of Iran 415 magazine, 1391), such as: the width of the line and the number and speed of online design and maximum width of shoulder width and Superelevation and the middle of the right and left sides of the main route for ramps are shown.
Table 3: General design features for the four interchange
Design characteristic Ramp
Freeway
The width of the line )
m ( 4.85 3.65
Number of Line
2 3
Design Speed )
km/hr ( 70,90 110
Maximum
Superelevation
6% 6%
Middle width )
m (
6.7
Shoulder
width (m ( Right 3.65
3
Left 3
3
Research on the traffic volume on-ramps to the heavy turnover ratio to the left with a ratio of 70 to 30, traffic volume and circulating ratio equal to the ratio of traffic volume is 50 to 50. For example, in Figure 3 distribution of traffic volume of 1600 and left 70 to 30 ratio with round has been shown.
Figure 3: distribution of traffic on the ramps with the volume of the 1600 and the ratio of 70 to 30
In table 4 the scenario defined in the Aimsun Simulator software such as 4 different mode equal 50-50% circulating volumes along with 10% of circulating volume and percentage of heavy vehicles against the 50-50 plus 20% of the circulating volume of heavy vehicle and the heavy 30-70 left plus 10% of the circulating volume of heavy vehicle and left the heavy 30-Safety
Interchange The study
area
The collision of
the back Delay Time
(Sec/km) The
parameters Deansity (pc/m/l) Change Line Speed mean
70 plus 20% of heavy vehicles for the four main at the interchange of route. Table 4: scenarios defined for 4 interchange in the Aimsun software
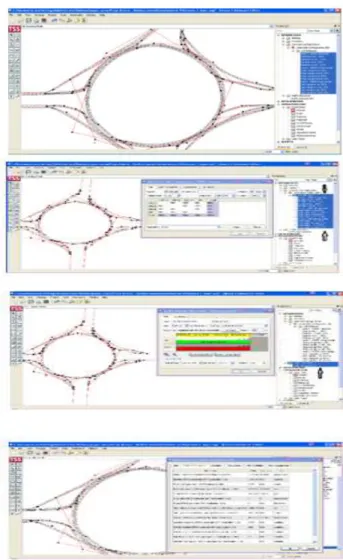
In Figures 4 and 5 the process of doing research for a step by step or the output from simulations for the pictures to come. In Figure 4 the process of doing research to check the performance of any of the three total traffic interchange in the Aimsun software about the simulation can be located. In Figure 5 the process of doing research for the entire intercahnge safety check the operation of each of the three interchanges in software simulation about SSAM is located.
Figure 4: the process of doing the entire simulated traffic interchange in the Aimsun Simulator
Figure 5: the process of doing the entire safety function simulation of interchange Simulator SSAM
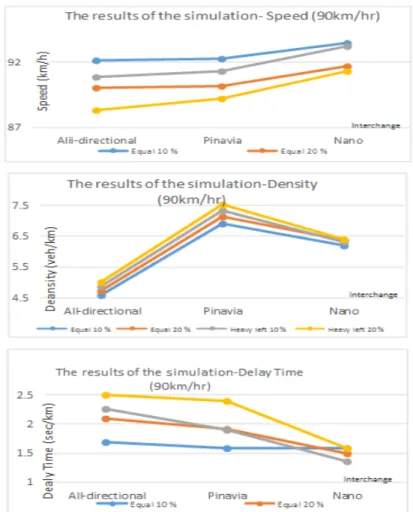
5. The results of the simulation
The results of the three simulation of pinavia and nano and all-diretional interchange under a different scenario, and two different speeds has been conducted and its results in the form of Figure 6 and 7 and tables 5 and 6. As part of the process of doing the research stages of the simulation output is obtained for each simulation 70 and 90 for the interchange of two speeds and two axial approach (fifty to fifty) and left heavy (70-to-30) as well as.
Continue on whatever of traffic simulation software as output achieved book is a chart and graph, and ultimately the entire simulation for two-speed under the said for table 5 and 6. Aimsun software output as before was told to analyze traffic for the entire interchange performance parameters (density, speed, delay Time), as compared in terms of parameters.
Aimsun software output as before was told to analyze traffic for the entire interchange of performance parameters (density, speed, delay Time), as compared in terms of parameters. After comparing three intercahnges in terms of safety performance analysis and performance evaluation of the safety of the interchange to which safety software with SSAM paid that two important factors: 1. change the Line , and 2. The crash of the back, for estimating the number of accidents at interchanges.
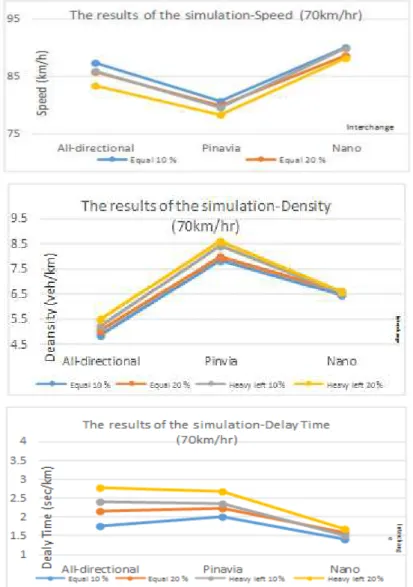
In Figures 6 and 7 and tables 5 and 6 the results of the simulation of traffic performance of three interchanges, such as: the delay time and the density and speed of under 70 and 90 double speed and under 4 modes of axial mode IE traffic and heavy left along with two heavy vehicle 10 and 20 percent. As well as the results in table 7 simulation of safety performance for three interchange under the two types of collisions: 1. change the Line 2. The crash of the back
Figure 6: the performance results chart of traffic simulation under mode 4 and 70 traffic speed
Also from Figure 6 can be such a astenbad that in all 4 scenarios and two simulated traffic performance speed: to arrange the lowest delay time for the interchange of the Nano then all -direction and pinavia at the end of the interchange . Also from Figure 6 we can conclude that every such 4 scenario and two simulated traffic performance speed: to arrange the lowest delay time for the interchange of the Nano then all-direction and pinavia at the end of the interchange. The lowest density for the interchange of the all direction then Nano and pinavia at the end of the interchange . The maximum average speed for the interchange of the Nano then all the direction and pinavia at the end of the interchange .
Table 5: results of a simulation of the interchange with a fixed speed (km/h 70) with a different scenario has been done
70km/h 10%Equal 20%Equal 10%Heavy left 20%Heavy left
All directi
on
Nano Pinavi
a
All directi
on
Nano
Pinavi
a
All directi
on
Nano
Pinav
ia
All direct
ion
Nano
Pinavi
a
Delay Time
(sec/km) 1.77 1.42 2.02 2.15 1.59 2.24 2.41 1.52 2.35 3.48 1.68 2.68
Density
(veh/km) 4.86 6.45 7.86 5.04 6.60 7.98 5.22 6.55 8.43 5.49 6.62 8.58
Speed
Figure 6: performance results chart of traffic simulation under mode 4 traffic and 90 speed.
In Figure 6 and table 6 the results of the output performance of the three traffic interchange pinavia and nanao and all direction. In between the simulated scenario scenario heavy with left 20% of heavy vehicles and the speed of 90 km/h is the most critical scenario is defined for 4 each scenario between the three interchangs. Also from Figure 6 can be such that in all 4 scenarios and two simulated traffic performance speed: to arrange the lowest delay time for the interchange of the Nano then the interchange of the pinavia and at the end of the interchange of the all direction. The lowest density for the interchange of the all direction then the interchange of Nano and pinavia at the end of the interchange. The maximum average speed for the interchange of the Nano then the interchange of pinavia and at all- direction the end of the interchange.
Table 6: results of a simulation of the interchange with a fixed speed (km/h 90) with a different scenario has been done
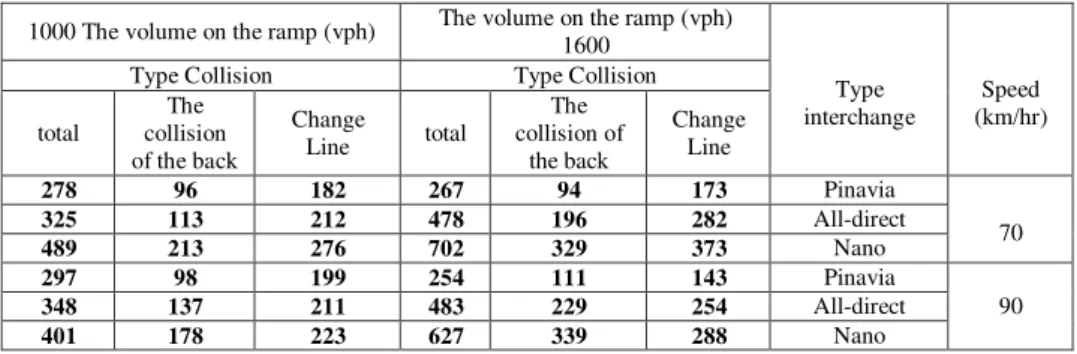
According to table 7 the number of collisions in three pitching Simulator SSAM. number of accidents at pinavia the interchange of both speed and two different size type on-ramps is less than the interchange of nano and the interchange of the all direction. As well as the number of traffic accidents caused by the change of the route most of the clash of the rear of the junction for all three. And also it can be said that
90km/h %10Equal %20Equal %10Heavy left %20Heavy left
All
direction Nano Pinavia All directio
n
Nano
Pinavia
All directio
n
Nano
Pinavi
a
All directi
on
Nano
Pinavia
Delay Time
(sec/km) 1.69 1.59 1.59 2.09 1.50 1.919 2.26 1.36 1.90 3.09 1.59 2.39
Density
(veh/km) 4.58 6.21 6.90 4.726 6.38 7.12 4.87 6.31 7.32 5.03 6.39 7.54
Speed
the number of collisions in the SSAM Simulator with speed at interchange s reducing the number of traffic accidents in each of three equal to the ratio of the interchange.
Table 7: number of collisions with the traffic Simulator software SSAM 6. Calibration and analysis of the sensitivity of the
The order of sensitivity analysis in order to know that, with the increase or decrease a value of the input parameter to the simulation software how much output parameters on the impressive and effective. To compare this output parameter, both the interchange and the interchange of nano-pinaiva such as: delay time. The density. And speed based on the two types of heavy vehicle 10% and 20%, and two speeds of 70 and 90 km/h under 4 different scenarios that charts Figure 8 and Figure 9 and Figure 10 illustrates this issue.
Figure 7: sensitivity analysis of time delay chart
Figure 8: sensitivity analysis, chart speed
Figure 9: sensitivity analysis of the density chart
Speed ) km/hr ( Type interchange
The volume on the ramp (vph) 1600
The volume on the ramp (vph) 1000 Type Collision Type Collision Change Line The collision of the back total Change Line The collision of the back total 70 Pinavia 173 94 267 182 96 278 All-direct 282 196 478 212 113 325 Nano 373 329 702 276 213 489 90 Pinavia 143 111 254 199 98 297 All-direct 254 229 483 211 137 348 Nano 288 339 627 223 178 401 1 2 3
pinavia All-d irect io nal Nano pinavia All-d irect io nal Nano
D e a ly T im e (s e c/ km ) In te rc h a n g e
Sensit ivi ty anal ysis of delay t ime w it h an increase in t he percentage of heavy vehicl e
Equ al 10% Equ al 20% Heavy left 10% Heavy left 20 %
60 70 80 90 100
Pinav ia All-d ir ect io nal Nano Pinav ia All-d ir ect io nal Nano
S p e ed (k m /h r) In te rc h a n g e
Sensit ivi ty analysis of Speed w it h an increase in t he percent age of heavy vehicle
Equ al 10% Equ al 20% Heav y left 10% Heavy left 20%
4 6 8 10
Pi navia Al l-direct io nal Nano Pinavia All-di rec t io nal Nano
D en si ty (v eh /k m ) In te rc h a n g e
Se nsi t ivi ty anal ysis o f De nsit y w it h a n i ncr ea se i n t he pe rcentage o f hea vy ve hi cl e
Equ al 10% Equ al 20% Heavy l eft 10% Heav y left 20%2
70 km / hr 90 km / hr
70 km / hr 90 km / hr
As shown in Figure 7 and Figure 8 and Figure 9. With an increase of 10 per cent of the heavy vehicle and also believe in the change mode of approach to heavy left mode and reduce the speed of 90 to 70 values of density and the delay time and average speed for the three: the interchange of 1.2% and 1.5% and 6.67%. In the calibration section of traffic simulation software based on behavioral models of action and since the behavior of users in different regions, each region must be paid (calibration) these models do. In the process of modeling the automotive software, model parameters, change models, looking for the line and the General parameters are adjustable. By examining the behavior of drivers and calibration parameters extracted for items: the driver's reaction time (seconds, 1.55) reaction time stop (1.1 seconds) the desired maximum speed (75 km/h) the minimum distance between the cars (1.2 m) maximum time observe right of way (5 seconds) when at least srfasalh (0.9 seconds). The desired interchange at 2 before and after calibration mode in the software looks like and 19 per cent of that analysis to reduce travel time, reduce error 7% average error, 13% reduce the time delay error, reduce the length of the queue, reducing the average 14 percent to 7 percent of the time and the number of stops and reduced the total mileage of 21 percent was predicated.
7. Summary All interchanges
By comparing the results of the graphs and tables about all three of the interchange at a speed of 70 km/h in terms of the performance of the pinavia interchange traffic with a speed of 70 km/h relative to the interchange of pinavia 50 km/h speed with fifty more suitable and more satisfying.
That is, in terms of traffic based on the rankings of the best performance of the first interchange of the Nano then the interchange of all direction and with little difference between the interchange of pinavia. By comparing the results of the graphs and tables about all three of the
interchange at the speed of 90 km/h in terms of traffic performance, as can be seen with an increase in the speed of traffic interchange performance pinavia got to get better.
So that at the speed of 90 km/hr traffic between the three best performance of speed. At the speed of 90 km/hr pinavia interchange to the interchange of all much better than the performance of the traffic direction. But lower than the interchange of nano.
Safety:
The results showed that the safety table for 1600 vehicle ramps the volume in hours, the number of accidents in the interchange of nano about 1.5 times the number of accidents interchange of all directional and as well as the interchange of pinavia 2.5 times less than the interchange of nano. And for the size of the vehicle on ramps 1000 hours, a lot of difference between Nano and interchange crashes seen all the interchange point. But as can be seen in the interchange of the Pinavia has the minimum number of crashes between the interchanges are simulated. In the interchange pinavia whatever the speed of the ramp can be further reduced the number of traffic accidents. As well as whatever is more ramps and freeway traffic volume, the probability of the occurrence of accidents in interchange of nano and interchange of all direction more than the interchange of pinavia.
8. CONCLUSION
Nano and all direction interchange about evaluation and comparison. Also in the safety assessment method of safety assessment model (SSAM) was used, which is equivalent to the number of associations in the three interchanges were evaluated. As it became clear.
According to the survey taken, traffic performance evaluation showed, the interchange of nano-simulation mode the situation better than pinavia and all the interchange All-direction . But it is worth mentioning that the pinavia interchange at the speed of 90 km/h traffic interchanges with similar performance and near the Nano and All-direction interchange of all traffic direction and better performance.
The conclusions of the research to prove or reject hypotheses
Traffic interchange of nano performance in all three speed 70 and 90 km/h is better than two interchange of pinavia and the all direction interchange. And represents the first hypothesis is that the research that's being better traffic interchange function pinavia to two other interchanges we reject the premise. Interchange safety performance on both the speed of 70 and 90 km/h is better than two Nano-interchanges and all direction .And represents the second hypothesis is that the research that's being better safety performance pinavia to the interchange of two other interchanges had to prove the assumption. Of the main problems of the interchange of the pinavia can be pointed to the following geometric figure: the ramps are kind of low speed especially for fifty km/h is a good traffic performance relative to the interchange of nano interchange and all direction interchange. Because of the interchange of the ramp being circular pinavia for the design of the ramps is a great way to speed up the privacy needs.
9. REFERENCE
1. Aušrius Juozapavičius and Stanislovas Buteliauskas, 2010, “Improvement Possibilities of City Transportation System byUsing PINAVIA Interchange" Environmental Research, Engineering and Management,. No.3(53), Pages. (36-42)
2. AušriusJuozapavičius and
StanislovasButeliauskas, June 15 2014,
"INTERCHANGE OF A NEW
GENERATION PINAVIA" Submission date
3. Aušrius Juozapavičius and Stanislovas
Buteliauskas, 2014, " Evaluation of Park&Ride Facility inside the PINAVIA Junction from the Perspective of Sustainable Development" The International Journal Of Engineering And Science (IJES)-Volume 3, Issue 4,
4. Harris, Meredith Louise, year 2007, “Nano-Interchange vs. the All-Directional Four-level: A Comparison of Geometrics, Construction
Costs, and Right of Way Requirements”, M.S.
Thesis, North Carolina State University,
5. HIGHWAY DESIGN MANUAL,
2015,AASHTO MANUAL GREEN
BOOK2011 ,
6. Jae-Pil Moon , Joseph E. Hummer, Meredith H. Van Duyn, E.I. ,year 2010," Introduction of the New Nano Interchange Design as a Directional
Freeway-to-Freeway Interchange" , Submitted
for the 4th International Symposium on Highway Geometric Design ,
7. Jae-Pil Moon, Joseph E. Hummer, and Meredith H. Van Duyn . 2011. " Saving Space in a Dense City: When Designers Should
Consider the New Nano-Interchange" , KSCE
Journal of Civil Engineering (2011) 15(6):1101-1108
8. Lili Pu and Rahul Joshi, (2008), FHWA-HRT- 08-050, Surrogate Safety Assessment Model (SSAM): Software User Manual.
9. Meredith L. Harris, E.I., 2009 ,“ NANO-INTERCHANGE: CHARACTERISTICS OF
GEOMETRICS, CONSTRUCTION COSTS
AND RIGHT OF WAY REQUIREMENTS”, A
thesis submitted to the Graduate Faculty of North Carolina State University ,
10.Samadi.seyed abolfazl, year 2016, " Comparison of Pinavia Interchange Vs Interchange's All Directional And Nano Of Traffic Operation And Safety with Traffic simulation", Master thesis, Islamic Azad university science And research branch 11.Strategic planning and the supervision of the
President, the geometric design of road regulations, year of publication, number 1375, 161, Vice President of technical affairs strategic surveillance system,