ALINE CARDOSO DE SOUZA1, JOSÉ BRANCO DE MIRANDA FILHO2,
AURILENE SANTOS OLIVEIRA3, JEFFERSON FERNANDO NAVES PINTO4,
CAROLINA MESSIAS SILVA1 and EDÉSIO FIALHO DOS REIS5 1,4 Mestre em Agronomia. Universidade Federal de Goiás, Regional Jataí, Jataí, Goiás, Brasil.
[email protected],[email protected], [email protected].
2Engenheiro-Agrônomo, Doutor. Professor Titular da ESALQ/USP, Piracicaba-São Paulo, Brasil, [email protected] 3Doutoranda em Agronomia, Universidade Federal de Uberlândia (UFU), Uberlândia-Minas Gerais, Brasil.
5Engenheiro-Agrônomo, Doutor. Professor associado da Universidade Federal de Goiás, Regional Jataí, Jataí-Goiás, Brasil.
Revista Brasileira de Milho e Sorgo, v.17, n.1, p. 135-146, 2018
ABSTRACT - The study of genetic variability in populations undergoing recurrent selection is important to quantify
their real potential for breeding purposes. In the present work, three semiexotic maize populations were evaluated on their yield potential and variability for continuing the recurrent selection program. Half-sib families representing three semiexotic populations CRE-01, CRE-02, CRE-03 were evaluated for yield and agronomic traits male flowering (MF), plant height (PH), ear height (EH), ear placement (EP) - ratio = (EH/PH), tassel length (TL), tassel branches (TN), final stand (FS), ears per plot (NE), prolificacy (PR), ear length (EL), ear diameter (ED), ear yield (EY), grain yield (GY). The observed means for grain yield (GY), in percent of the hybrid check, were 93.8%, 89.4%, and 94.6%, showing a relatively good yield potential. Means (cm) for plant height (PH) and ear height (EH) were 221, 237, 241 and 117, 134, 137, respectively, with reductions in relation to the first cycle. Parameters estimates for GY were: additive genetic variance 582.28, 406.70 and 238.11 g2.plant-1; heritability 59.17%, 49.82% and 38.53%; progeny mean basis, and expected gain for progeny selection 8.16%, 6.86% and 3.88%; selection intensity of 20%.
Keywords: Zea mays, recurrent selection, semiexotic population, genetic parameters.
VARIABILIDADE GENÉTICA E GANHO ESPERADO EM TRÊS POPULAÇÕES DE MILHO RESUMO - O estudo da variabilidade genética em uma população sob seleção é importante para quantificar seu
potencial para fins de melhoramento. No presente trabalho foram avaliadas três populações semiexóticas de milho quanto ao seu potencial de produção e de variabilidade para continuar o programa de seleção recorrente em curso. Famílias de meios irmãos representando as três populações (CRE-01, CRE-02, CRE-03) foram avaliadas para caracteres agronômicos florescimento masculino (MF), altura da planta (PH), altura da espiga (EH), posição relativa da espiga (EP), comprimento do pendão (TL), ramificações do pendão (TN), estande final (FS), espigas por parcela (NE), prolificidade (PR), comprimento da espiga (EL), diâmetro da espiga (ED), peso de espiga (EY), peso de grãos (GY). As médias observadas para produção de grãos (GY) foram 93,8%, 89,4% e 94,6% da testemunha, mostrando um bom potencial de produção. As alturas médias da planta (PH) foram 221, 237 e 241 cm e da espiga (EH) foram 117, 134 e 137 cm, com reduções em relação ao primeiro ciclo. As estimativas de parâmetros para GY nas três populações foram, respectivamente: variância genética aditiva 582,28 g2 planta-1, 406,70 g2 planta-1 e 238,11 g2 planta-1; coeficiente de herdabilidade em média de progênies 59,17%, 49,82% e 38,53% e ganho com seleção para 20% de intensidade de 8,16%, 6,86% e 3,88%; ganho com seleção para 5% de intensidade de 10,81%, 10,47% e 5,32%, respectivamente para as populações CRE-01, CRE-02 e CRE-03.
The importance of the maize species as food and especially for animal feed, as well as an expressive economic component, is unquestionable. Its wide distribution in Brazil and all over the world also contributes for the enlargement of the agricultural activities, besides the introduction of new technologies that will result in higher efficiency of the productive system (Hallauer at al., 2010; Santos et al., 2002).
The activity of plant breeding has been practiced since the primordial times of human civilization and was greatly benefited by the advent of the science of genetics in the last century. The genetic advances, as expressed by the increase in productivity and/or quality in the food production system, has been continuously achieved with success but under the basic requirement that is dependent of existence of genetic variability. In addition, the advances in technology for the control of the environmental effect on the expression of genetic variability also contributed to the efficiency of selection methods. The technology of hybrid seed production, introduced in the beginning of the last century also contributed for widening the horizon of maize breeding. The available methodologies for maize breeding are presented by Hallauer at al. (2010); Hallauer et al. (1988); Miranda Filho and Viégas (1987); Paterniani and Miranda Filho (1987), among others.
In Brazil, the introduction of exotic germplasm has largely contributed to increase the variability and the efficiency of breeding programs for the development of cultivars (Miranda Filho, 1992; Regitano Neto et al., 1997). Old varieties such as
Cateto and Dente Paulista were the base for the
development of the first hybrid seeds. In the sequence, an expressive advance was brought about with the introduction of exotic germplasm, mainly Tuxpeño and related races from Mexico and Central America,
which largely contributed for the development of high yielding semident hybrids (Miranda Filho & Viégas, 1987). Several other introductions have contributed to the maize breeding programs along the time. The importance of incorporation of exotic germplasm in maize breeding programs have long been emphasized (Nass et al., 2001), but the pattern of adaptation in general is below an acceptable level, thus making difficult to attain the desirable objectives. Nevertheless, some experiences have been accumulated and surely will contribute to overcome inherent obstacles (Goodman, 2005; Paterniani, 1990). In Brazil, the introduced germplasm has been mostly from tropical origin, thus making to be less difficult to handle as compared to the introduction of temperate germplasm. A work developed by Miranda Filho and Reis (2016), with several levels of exotic germplasm involving five subsets of populations, three of tropical origin and two of temperate origin, indicated good performance for yield (weight of spikes), the average of three sets of tropical origin of 79.5; 74.4 and 76.3% of the control and an average of the two sets of temperate origin of 72.7 and 71.3% of the control.
In spite of the importance of previous actions for the introduction of exotic germplasm in Brazil (Miranda Filho & Viégas, 1987), recently there has been reined interest of maize breeders for new sources, mainly in relation to tolerance to biotic and non-biotic stresses (Basso & Miranda Filho, 2001; Oliveira et al., 2015a).
Population improvement by using the method of recurrent selection (intra or interpopulation) has been extensively used and several mating schemes are available to be used in breeding programs (Hallauer et al., 2010; Paterniani & Miranda Filho, 1987). All methods are quite feasible and in general have shown high efficiency not only for population improvement
but also for the evaluation of the potential of germplasm to be used in breeding programs (Borém & Miranda, 2009).
Each cycle of recurrent selection is completed after closing the three steps designated as (a) development of genotypes or progenies, (b) evaluation and selection of progenies, and (c) recombination of the selected progenies. However, the success of the breeding program depends essentially on the amount of genetic variability of important quantitative traits that will be submitted to selection (Hallauer et al., 2010). Under this view, the present work pursued the following objectives: (i) Quantification of the genetic variability of important agronomic traits in three semiexotic populations the maize. (ii) Evaluation of the expression of grain yield and other traits of the three populations in relation to their potential to be used as basic germplasm for the development of cultivars (improved varieties and hybrids from inbred lines) with acceptable pattern in the maize crop production.
Material and Methods
A sample of 682 inbred (S4) lines with potential for resistance to corn stunt complex was introduced from CIMMYT (Centro Internacional
de Mejoramiento de Maíz y Trigo, Colombia).
Fifty-one lines were preliminary selected for incorporation into three local and adapted populations [P-3041 ≡ F2 generation of a commercial hybrid; CMS-14C ≡ population derived from Pool-25 (CIMMYT, Mexico); and ESALQ-PB23 ≡ broad base (composite) population]. Crosses of the three base populations with the introduced lines were used for the synthesis of the three semiexotic populations designated as CRE-01, CRE-02 and CRE-03, after recombination of
testcrosses represented by 30, 39 and 32 exotic lines, respectively. Oliveira et al. (2015a) and Oliveira et al. (2015b) give more details about the origin of the three semiexotic populations.
Oliveira et al. (2015b) reported on the evaluation of half-sib families from the three semiexotic populations, represented by samples of size 200, 180 and 180 for 01, 02 and CRE-03, respectively; for each population the whole sample was divided into four experiments of sizes 50, 45 and 45, respectively. The 20 higher yielding (grain yield) families from each populations were recombined to complete the cycle of recurrent selection; selection intensities were then 10.0%, 11.1% and 11.1% and the effective population size was Ne = 80 for all populations. The basic material of the present work was represented by half-sib families obtained in isolated blocks of recombination for each population (CRE-01, CRE-02 and CRE-03); sample sizes were 90, 140 and 80, respectively, which were divided into smaller experiments, as follows: two with 45 families in CRE-01; three with sizes 55, 46 and 39 in CRE-02; and two of sizes 40 in CRE-03.
The yield trials were in completely randomized blocks with three replications in one location (Universidade Federal de Goiás, Regional Jataí-GO), evaluated under the condition of first crop (normal season). Plots were 4.00 m long spaced 0.90 m apart with 20 plants per plot after thinning. The following traits were analyzed: male flowering (MF) in days, plant height (PH) in centimeters, ear height (EH) in centimeters, ear placement (EP: ration EH/PH), tassel length (TL) in centimeters, number of primary branch (TN), final stand (FS: number of plants per plot), number of ears per plot (NE), prolificacy (PR: average number of ears per plant), ear length (EL) in centimeters, ear
diameter (ED) in centimeters, ear yield (EY) in t ha-1, and grain yield (GY) in t ha-1. The traits PH, EH, EL and ED were expressed as the mean of a random sample of five plants (PH, EH) or ears (EL, ED) per plot; (EY and GY) were expressed as the plot total adjusted to 20 plants per plot by using the linear regression coefficient of yield over the stand variation (Vencovsky & Barriga, 1992) and expressed in t ha-1. Two commercial hybrids (P30K75 and SHS 4080) were used as checks, intercalated between sets of ten plots of families.
In the analyses of variance, the following model was considered: Yij = m + ti + bj + eij, in which Yij is the experimental unit referring to the ith treatment in the jth block, represented by plot total (EY and GY), sample means (PH, EH, EL, ED) or the specific unity for the other traits. In that model, m is the general mean, and the effect ti with I-1 degrees of freedom is partitioned to represent the variation among half-sib families (fi effects), the contrast between check means and the contrast families vs. checks with n-1, 1 and 1 degrees of freedom, respectively; n is the number of half-sib families. The random effects bj and eij refer to the variation among blocks and the experimental error, respectively, with J-1 and (I-1)(J-1) degrees of freedom.
For the purposes of this work, the following expectations are of interest: E(fi) = E(eij) = 0, E() = (genetic variance among half-sib families), and E() = s2 (plot-to-plot error variance). In the analysis of variance the mean squares for Families and Error have the following expected values: E(Mf) = s2 + 3 and E(Me) = s2. The estimation of the components of variance and other related parameters were obtained according to methods acording Andrade and Miranda Filho (2008) and Vencovsky and Barriga (1992).
Results and Discussion
Observed means of fourteen traits are shown in Table 2 for half-sib families and checks in the analysis of three semiexotic populations (CRE-01, CRE-02, CRE-03); all the results are shown in that sequence. Means for MF (male flowering, days) were 60.9, 63.1 and 61.7, all above the check mean (4% to 6% or 2.4 to 3.5 days). Recently, earliness has been an important trait in most maize breeding programs because, despite the positive correlation with grain yield (0.14 on the average of 13 estimates (Hallauer et al., 2010)), it increases the feasibility of the second crop (usually maize after soybean), mainly in the Central-West region of Brazil. Therefore, the decrease in days to flower would be desirable in the three semiexotic populations if they are to be used for those conditions. Troyer (1994) presented a detailed discussion on the importance of breeding for early maize for the northern part of the American Corn Belt, mainly to develop germplasm adapted to the short crop duration at higher latitudes. Early maize are then desirable to attend some needs such as: (a) to avoid the risk of drought during the crop development, as occurs in the Central-West region in Brazil; (b) to escape from frost risk in the autumn season, as occurs frequently in the South region in Brazil; (c) to escape from snowfall at the maize harvest time in high latitude regions; (d) simply to shorten the crop cycle to make possible a second crop or to take advantage in the market prices.
For PH (plant height) means were 221.4, 237.0, 241.5 cm and EH (ear height) were 116.7, 134.6, 137.3 cm; for both, PH and EH, estimates were above the check means, in the range of 10% to 14% and 9% to 17%. For both traits the relative values were CRE-01 < CRE-02 < CRE-03, which are the same as those reported by Oliveira et al. (2015a) and Oliveira et al.
(2015b) for the same populations; the authors also found higher means for families as compared to check means in both experiments. The importance of plant height and ear height, and indirectly ear placement, in typically tropical germplasm, has long deserved attention of maize breeders for the development of modern cultivars with a better plant architecture toward the control of plant lodging and mechanical harvest. However, there is a positive genetic correlation between yield with PH (r = 0.26) and EH (r = 0.31) as reported by Hallauer et al. (2010) on the average of 23 studies. Andrade and Miranda Filho (2008) also found positive correlation between ear weight and grain weight with PH (~0.60) and EH (~0.50), respectively, in the maize population ESALQ-PB1. Farias Neto and Miranda Filho (2001) reported genetic correlation of PH x EY and EH x EY in the order of 0.19 and 0.29 in subpopulations selected to increase tassel size and of 0.23 and 0.39 in subpopulations selected to increase
ear height. The corresponding estimates within subpopulations selected independently to decrease tassel size and ear height were 0.087, 0.176, 0.342 and 0.503, respectively. Therefore, the trend of positive correlation as mentioned above indicates that care must be taken in selection to reduce PH or EH, in the sense to avoid undesirable change in yield potential. An important parameter that deserves attention in maize breeding is the ear placement (EP = EH/PH), which is essentially a measure of the relative position of the ear in the stalk. It is well known that maize germplasms of tropical origin in general exhibit EP > 0.50, and values near or above 0.60 are not uncommon. Andrade and Miranda Filho (2008) reported EP = 0.53, varying from 0.47 to 0.59 in half-sib families of the population ESALQ-PB1.
The tassel characteristics (TL - length and TN - tassel branch number), that essentially exhibit the tassel size, showed means around 0.38 m and Table 1 - Observed means of fourteen traits in half-sib families (m0) from three semiexotic maize populations (CRE-01, CRE-02, CRE-03) and hybrid checks (mc).
t [Unities of measurement: (MF)- days, (PH)- cm, (EH)- cm, (EP)- ratio = (EH)/(PH), (TL)- cm, (TN)- number of primary branches, (LB)- number of lodged and broken plants per plot, (FS)- number of plants per plot, (NE)- number of ears, (PR)- average number of ears per plant, (EL)- cm, (ED)- cm, (EY)- t ha-1, (GY)- t ha-1]. m
0% = 100 m0/ mc
Traits CRE-01 CRE-02 CRE-03
m0 mc m0% m0 mc m0% m0 mc m0%
Male flowering (MF) 60.9 58.5 104.2 63.1 59.6 106.0 61.7 58.9 104.8
Plant height (PH) 221.4 200.1 110.7 237.0 207.7 114.1 241.5 221.2 109.2
Ear height (EH) 116.7 106.8 109.2 134.6 115.5 116.6 137.3 124.3 110.5
Ear placement (EP) 0.52 0.53 99.8 0.57 0.56 101.8 0.57 0.54 105.0
Tassel length (TL) 38.9 36.5 106.6 37.6 37.3 101.0 38.7 37.2 103.9
Tassel branches (TN) 13.8 12.3 111.5 14.7 12.1 122.0 14.7 12.6 116.5
Lodging/breakage (LB) 0.36 0.25 --- 0.39 0.22 --- 0.85 0.25 ---
Final stand (FS) 11.4 19.7 58.2 16.2 19.7 82.4 15.4 19.5 79.1
Ears per plot (NE) 13.4 21.1 63.7 16.8 19.8 84.7 15.3 19.9 77.0
Prolificacy (PR) 1.22 1.08 113.4 1.04 1.02 102.5 1.00 1.04 96.4
Ear length (EL) 17.5 18.1 96.5 17.7 17.1 103.5 16.7 17.6 95.4
Ear diameter (ED) 4.93 4.80 102.7 4.94 4.66 106.2 4.90 4.8 101.5
Ear yield (EY) 10.74 11.53 93.1 9.485 10.52 90.1 10.22 10.83 94.3
& Miranda Filho, 2001). The importance of tassel size in maize breeding is also related to its effect on plant development under stress, because there are evidences that the correlation between yield and tassel size tends to be higher and negative under stresses caused by unfavorable environments (Sangoi et al., 2002). In the present study, the tassel characteristics were considered intermediate in magnitude and within the acceptable pattern of modern varieties or hybrids.
Plant lodging and stalk breakage, usually evaluated together as one trait, is very inconsistent because it depends on the environment effects such as strong wings and incidence of stalk rot caused by fungi like Diploidia and Fusarium. This trait was practically inexistent in the experiments, with average occurrence of less than one affected plant per plot. For that reason, the trait was not included in the analysis of variance and estimation of parameters.
The observed final stand (ST - number of plants per plot) and NE (number of ears per plot) were both in the sequence CRE-01 < CRE-03 < CRE-02, within the range between 11 and 17. The traits were included in the analysis of variance but not in the estimation of parameters, which would not be of interest for breeding purposes. However, the ratio PR = NE / ST is a measure of prolificacy that is an important trait to be considered in breeding programs. The level of prolificacy was considered low in all three populations, with means of 1.22, 1.04 and 1.00 in the sequence.
Ear length of family means were 17.5, 17.7 and 16.7 cm on the average for populations; such values are equivalent to 96.5%, 103.5% and 95.4% of the check mean. However, the range of variation was relatively wide, with limits of 15.5 to 19.9 in CRE-01 and CRE-02 and of 13.9 to 19.0 in CRE-03. For ear diameter (cm) all three populations showed 14 branches, in the set of three populations. Such
results showed to be somewhat lower than the means for three populations (Dent Composite, Flint Composite, Centralmex) that were around 65 cm and 20 branches, respectively, reported by Geraldi et al. (1985); they were also lower but closer to 40.9 and 18.4, respectively, reported by Andrade and Miranda Filho (2008) for the population ESALQ-PB1. Mock and Pearce (1975) discussed the importance of some traits in the formulation of an ideotype of maize, which included the tassel size for its negative correlation with grain yield. Paterniani (1981) also emphasized the effect of tassel size on the maize plant development and the importance of this trait in breeding programs. The author also reported on the positive correlation between TN and EP (ear placement), varying from 0.24 to 0.85 in sets of races representing ten countries. The additive genetic correlation between GY and TN has been reported as negative by Souza Júnior et al. (1985) in Suwan-DMR (-0.441); Geraldi et al. (1985) in Dent Composite (-0.501), Flint Composite (-0.642) and Centralmex (-0.709), averaging 0.650. However, the correlation between traits is not fully consistent because it is affected by the genetic structure of the base population, so that the estimated parameter can change from one population to another. In fact, Andrade and Miranda Filho (2008) found a positive correlation (0.207) between GY and TN in the original population ESALQ-PB1. After six cycles of divergent selection for tassel size in the same population (ESALQ-PB1), the means for TN (average of two locations) increased to 39.0 in the positive selection (T+) and decreased to 8.2 in the negative selection (T-); the genetic correlation between GY and TN was negative (-0.022) in T+ and positive (0.456) in T- (Farias Neto & Miranda Filho, 2001). Other authors also found positive correlation between GY and TN (Farias Neto
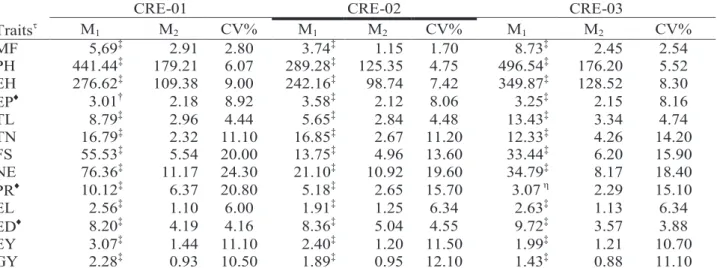
Table 2 - Mean squaresƒ for Families (M
1) and Error (M2) and coefficients of variation (CV) in the analysis of variance for fourteen traits in half-sib families from three semiexotic maize populations (CRE-01, CRE-02, CRE-03).
t [Unities of measurement: (MF: Male flowering) - days, (PH: Plant height) - cm, (EH: Ear height) - cm, (EP: Ear placement) - ratio = (EH/PH), (TL: Tassel length) - cm, (TN: Tassel branches) - number of primary branches, (FS: Final stand) - number of plants per plot, (NE: Ears per plot) - number of ears, (PR: Prolificacy) - average number of ears per plant, (EL: Ear length) - cm, (ED: Ear diameter) - cm, (EY: Ear yield) - t ha-1, (GY: Grain yield) - t ha-1. ¨[Multiplier of mean squares: 102 for PR and ED, 103 for EP]. ƒ[Mean squares in the combined analysis of 2, 3 and 3 experiments in CRE-01, CRE-02, and CRE-03, respectively; MS for replications not shown. The corresponding numbers of families in each individual experiment were 45 and 45 in CRE-01; 55, 45 and 39 in CRE-02; and 40 and 40 in CRE-03. The corresponding degrees of freedom for Families and Error were 88 and 184, 137 and 286, and 78 and 164, respectively;]. η, †, ‡ : non-significant and significant (F test) at P < 0.05 and P < 0.01.
means close to 4.90 cm, but expressing 102.7%, 106.2% and 101.5%, of the check mean. Oliveira et al. (2015b), working with the same populations in the first cycle of selection, found values for EL (15.1 cm to 15.4 cm) and ED (4.7 cm for the three populations) somewhat lower under the condition of second crop (safrinha). Ear weight (EY in t ha-1) showed family means of 10.74, 9.48 and 10.22, which are equivalent to 93.1%, 90.1% and 94.3% of the hybrid checks; such observations are indicative of the good yield potential of the populations under study. The ranges for EY were 8.64 to 13.60, 6.90 to 10.77, and 8.18 to 11.84, respectively. Oliveira et al. (2015b) showed EY of 7.21, 7.39 and 7,48 (t ha-1) in the same populations in the first cycle of recurrent selection with half-sib families evaluated under the condition of second crop (safrinha); the yield of inbred families (S1) were 6.47, 5.53 and 5.93, respectively.
Grain yield (GY in t ha-1) showed family means of 9.17, 8.01 and 8.45, which are equivalent to 93.8%, 89.4% and 94.6% of the hybrid checks. The rank of the three populations was the same for EY and GY. Within populations, the ranges for GY were 7.29 to 11.43, 5.75 to 10.09 and 6.53 to 9.86, respectively. The yield level expressed as GY was lower in the condition of second crop (Oliveira et al., 2015b), or exactly 5.68 t ha-1 in CRE-01 and 5.83 t ha-1 in CRE-02 and CRE-03. It is worth noting that yield levels of open pollinated maize varieties up to 90% of hybrid checks are not common (Andrade & Miranda Filho, 2008; Faluba et al., 2010) and actually assures promising results in research for population improvement or other useful methodology in breeding programs.
The analyses of variance for thirteen traits in half-sib families, combined over experiments, are shown in Table 1 for the three populations. Highly
CRE-01 CRE-02 CRE-03
Traits M 1 M2 CV% M1 M2 CV% M1 M2 CV% MF 5,69‡ 2.91 2.80 3.74‡ 1.15 1.70 8.73‡ 2.45 2.54 PH 441.44‡ 179.21 6.07 289.28‡ 125.35 4.75 496.54‡ 176.20 5.52 EH 276.62‡ 109.38 9.00 242.16‡ 98.74 7.42 349.87‡ 128.52 8.30 EP 3.01† 2.18 8.92 3.58‡ 2.12 8.06 3.25‡ 2.15 8.16 TL 8.79‡ 2.96 4.44 5.65‡ 2.84 4.48 13.43‡ 3.34 4.74 TN 16.79‡ 2.32 11.10 16.85‡ 2.67 11.20 12.33‡ 4.26 14.20 FS 55.53‡ 5.54 20.00 13.75‡ 4.96 13.60 33.44‡ 6.20 15.90 NE 76.36‡ 11.17 24.30 21.10‡ 10.92 19.60 34.79‡ 8.17 18.40 PR 10.12‡ 6.37 20.80 5.18‡ 2.65 15.70 3.07 η 2.29 15.10 EL 2.56‡ 1.10 6.00 1.91‡ 1.25 6.34 2.63‡ 1.13 6.34 ED 8.20‡ 4.19 4.16 8.36‡ 5.04 4.55 9.72‡ 3.57 3.88 EY 3.07‡ 1.44 11.10 2.40‡ 1.20 11.50 1.99‡ 1.21 10.70 GY 2.28‡ 0.93 10.50 1.89‡ 0.95 12.10 1.43‡ 0.88 11.10
significant F-test (P < 0.01) was detected for all traits in the three populations, except EP (P < 0.05 in CRE-01 and non-significant in CRE-03), thus indicating the existence of wide variability at the population level.
For the additive genetic variance ( 2 A
σ
), symbolizing CRE-01, CRE-02 and CRE-03 by 1, 2 and 3, the relative values were approximately 2 < 1 < 3 for MF, PH, EH, TL, and ED; 1 < 2 < 3 for EP; 2 < 1= 3 for EL; and 3 < 2 < 1 for PR, TN, EY and GY (Table 3). The relative values of 2F
σ
(phenotypic variance among family means) were very similar, with EY exceptions to the ranges shown to 2A
σ
. Particularly interesting is the relative values of variance for the yield traits, which were not very different among the three populations. For GY, the estimates ofσ
2A(582.28g2 plant-1, 406.70 g2 plant-1, 238.11 g2 plant-1) were in the same order as the estimates reported by Oliveira et al. (2015b) for the same populations in the first cycle.
The coefficient of heritability (family mean basis) for the 11 traits in the three populations varied from 27.5% (EP in CRE-01) to 86.2% (TN in CRE-01) (Table 4). On the average of the three
populations, the estimates ( 2 f
h
> 60%) were for MF, PH, EH, TL and TN; estimates (40% <h
f2 < 60%)were found in PR, EL, ED, EY and GY; and
2 f
h
< 40% was exhibited only by EP. Andrade and Miranda Filho (2008) reported estimates of 2f
h
in the range of ∼40.0% (PR, EY and GY) to 75.3% (TN) in the maize population ESALQ-PB1; estimates of 2f
h
> 50% also were shown by PH, EH, TL, EL, TW (tassel weight) and RN (kernel row number), ED and KR (kernels per row). In general, most of the traits in the three populations under study in the present project exhibited genetic variability within the pattern that has been observed by other authors.The genetic coefficient of variability is a relative measure of genetic variance and does not follow the same pattern for different traits. However, it is clearly seen that the highest values were for CRE-03 in most traits (MF, PH, EH, TL, EL, ED), while the less variable was CRE-03 for TN, EY and GY. The ratio q = CVg/CVe was presented by Vencovsky and Barriga (1992) as an indicator of a circumstance favoring artificial selection, based on the expression
CRE-01 CRE-02 CRE-03
Traits 2 G
2 F
2 A
2 G
2 F
2 A
2 G
2 F
2 A
MF 0.91 1.88 3.63 0.86 1.25 3.46 2.09 2.91 8.36 PH 87.41 147.15 349.63 54.64 96.43 218.57 106.78 165.51 427.12 EH 55.75 92.21 222.99 47.81 80.72 191.23 73.78 116.62 295.13 EP 2.75 10.02 11.00 4.88 11.94 19.52 3.68 10.84 14.72 TL 1.94 2.93 7.77 0.94 1.89 3.76 3.36 4.48 13.46 TN 4.82 5.60 19.29 4.73 5.62 18.90 2.69 4.11 10.75 PR 12.49 33.73 49.96 8.41 17.28 33.63 2.59 10.24 10.37 EL 0.55 0.85 2.22 0.22 0.64 0.88 0.50 0.88 2.01 ED 1.43 2.73 5.73 1.11 2.79 4.43 2.05 3.24 8.21 EY 175.51 331.36 702.02 130.24 259.52 520.95 83.86 214.34 335.43 GY 145.57 246.04 582.28 101.68 204.20 406.70 59.53 154.72 238.11Table 3 - Estimates of genetic variance among half-sib families ( 2 G
σ
), phenotypic variance among family means ( 2F
σ
), and additive genetic variance ( 2 Aσ
) in three semiexotic maize populations (CRE-01, CRE-02, CRE-03).of genetic variability; the authors hypothesized that values of q near or higher than 1 are favorable for selection. Estimates of q > 1 were detected only for TN in CRE-01 and CRE-02, but 82% of the estimates were higher than 0.5. The yield traits (EY and GY) also showed q < 0.5 in CRE-03. Andrade and Miranda Filho (2008) also reported q < 0.5 for yield traits but 0.5 < q < 0.9 for other ten traits in the same study.
The results as described above are quite common in experiments with open pollinated maize populations and it is well known that when dealing with quantitative traits the success of selection depends not only on the genetic variability, but also on experimental techniques and on the effectiveness in controlling the effect of environment. For that reason, if high selection intensity is to be used in a short-term program, care must be taken to assure a higher level of heritability; for examples, larger plot sizes and/or higher number of replications should be used for that purpose.
Finally, another important information to complete the knowledge about the genetic structure of the semi exotic populations refers to their potential to have an expressive response to artificial selection.
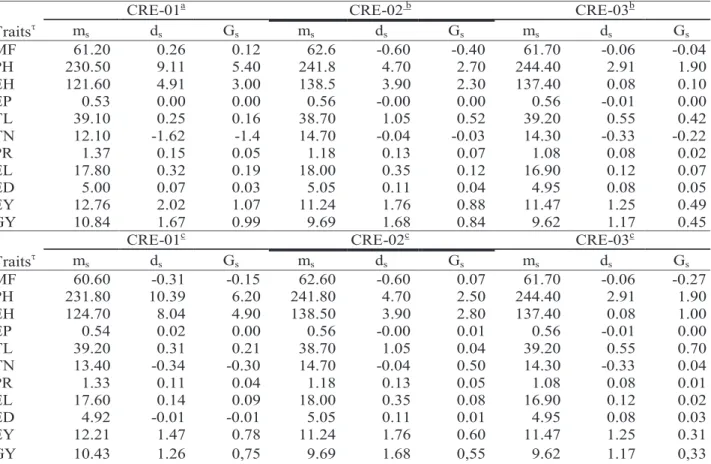
In the present work, the breeding program used two strategies continuously. First, it was considered a high selection pressure (5%) to direct selection for a rapid response toward the development of populations with narrow genetic base, but appropriate to generate inbred lines to be used in hybrid crosses; under such condition it is expected that a low effective size in the recombined sample will lead to a decrease in genetic variability and an increase in the inbreeding level. The second strategy is directed to intrapopulation recurrent selection, which can be carried for many cycles of selection; for that reason, care must be taken to keep the genetic variability in an appropriate level to assure response to selection in a long-term program. The appropriate effective population size also must be considered to avoid the undesirable effect of inbreeding depression. Then, the selection pressure was 20% in the three populations and the expected effective population size were 72, 112 and 64 in CRE-01, CRE-02 and CRE-03. The expected gain from selection (GS) for the trait under selection (GY) and its effect in the other traits are shown in Table 5. For 20% selection intensity, the expected gain for EY and Table 4 - Estimates of the coefficient of heritability for family means ( 2
f
h
), genetic coefficient of variation (CVg) and index of variation (q) in three semiexotic maize populations (CRE-01, CRE-02, CRE-03).t [Symbology and unities of measurement; LB was excluded for its low expression in the 3experiment].
CRE-01 CRE-02 CRE-03
Traits 2 f
h
% CVg 2 fh
% CVg 2 fh
% CVg MF 48.35 1.56 0.558 69.24 1.47 0.864 71.93 2.34 0.92 PH 59.40 4.22 0.696 56.67 3.12 0.657 64.51 4.28 0.78 EH 60.46 6.40 0.711 59.22 5.14 0.692 63.27 6.26 0.75 EP 27.46 3.17 0.355 40.91 3.87 0.480 33.98 3.37 0.41 TL 66.32 3.58 0.808 49.84 2.58 0.575 75.14 4.74 1.00 TN 86.16 16.0 1.434 84.13 14.8 1.320 65.42 11.18 0.79 PR 37.03 9.17 0.441 48.72 8.80 0.562 --- --- --- EL 60.91 4.26 0.722 34.57 2.66 0.419 57.09 4.23 0.67 ED 49.58 2.43 0.572 39.74 2.13 0.468 63.32 2.94 0.76 EY 52.98 6.85 0.615 50.13 6.68 0.582 39.33 5.00 0.47 GY 59.17 7.32 0.697 49.82 6.99 0.578 38.53 5.08 0.46Table 5 - Estimates of the differential of selection (ds) and expected gain from selection (Gs) under two selection intensities in three semiexotic maize populations (CRE-01, CRE-02, CRE-03).
t [Symbology and unities of measurement]. G
s within brackets: in percent of the population mean. a, b, c: Selection intensities of 5.56 %, 5% and 20%, respectively
GY, GS, in percent of the population mean, were 7.24, 6.34, 3.02 and 8.16, 6.86, 3.88 in the order CRE-01, CRE-02 e CRE-0, respectively. On the other hand, higher selection intensity (5.6% in CRE-01; 5.0% in CRE-02 and CRE-03) indicated gains of the order 9.96, 9.30, 4.83 and 10.81, 10.47, 5.32 for EY and GY, respectively. In the first cycle of selection, under 10% selection intensity in 01 and 11% in CRE-02 and CRE-03, the expected gains were in the range of 11.54% (CRE-01) to 8.87% (CRE-03) in EY and 11.81% (CRE-01) to 9.27% (CRE-03) in GY (Oliveira et al., 2015b). A comparison between the two cycles of selection in respect to the expected gain is not fully adequate, because they refer to different crop season,
i.e., second crop (safrinha) in the first cycle and first crop (normal season) in the second cycle. Nevertheless, it was considered that the expected gains were in acceptable level for the recurrent selection program. In fact, an expected gain of about 10% would assure a yield level practically equivalent to the hybrid check in the three populations. More exactly, the expected yield for CRE-01, CRE-02 and CRE-03 would be 103.1%, 98.3% and 104.1% in relation to the check yield. The expected gain in the three semiexotic populations were much higher than ∼7% reported by Andrade and Miranda Filho (2008) in the population ESALQ-PB1.
The indirect effect of selection on the other traits indicated PR as the most responsive with expected
CRE-01a CRE-02 b CRE-03b
Traits m s ds Gs ms ds Gs ms ds Gs MF 61.20 0.26 0.12 62.6 -0.60 -0.40 61.70 -0.06 -0.04 PH 230.50 9.11 5.40 241.8 4.70 2.70 244.40 2.91 1.90 EH 121.60 4.91 3.00 138.5 3.90 2.30 137.40 0.08 0.10 EP 0.53 0.00 0.00 0.56 -0.00 0.00 0.56 -0.01 0.00 TL 39.10 0.25 0.16 38.70 1.05 0.52 39.20 0.55 0.42 TN 12.10 -1.62 -1.4 14.70 -0.04 -0.03 14.30 -0.33 -0.22 PR 1.37 0.15 0.05 1.18 0.13 0.07 1.08 0.08 0.02 EL 17.80 0.32 0.19 18.00 0.35 0.12 16.90 0.12 0.07 ED 5.00 0.07 0.03 5.05 0.11 0.04 4.95 0.08 0.05 EY 12.76 2.02 1.07 11.24 1.76 0.88 11.47 1.25 0.49 GY 10.84 1.67 0.99 9.69 1.68 0.84 9.62 1.17 0.45
CRE-01c CRE-02c CRE-03c
Traits m s ds Gs ms ds Gs ms ds Gs MF 60.60 -0.31 -0.15 62.60 -0.60 0.07 61.70 -0.06 -0.27 PH 231.80 10.39 6.20 241.80 4.70 2.50 244.40 2.91 1.90 EH 124.70 8.04 4.90 138.50 3.90 2.80 137.40 0.08 1.00 EP 0.54 0.02 0.00 0.56 -0.00 0.01 0.56 -0.01 0.00 TL 39.20 0.31 0.21 38.70 1.05 0.04 39.20 0.55 0.70 TN 13.40 -0.34 -0.30 14.70 -0.04 0.50 14.30 -0.33 0.04 PR 1.33 0.11 0.04 1.18 0.13 0.05 1.08 0.08 0.01 EL 17.60 0.14 0.09 18.00 0.35 0.08 16.90 0.12 0.02 ED 4.92 -0.01 -0.01 5.05 0.11 0.01 4.95 0.08 0.03 EY 12.21 1.47 0.78 11.24 1.76 0.60 11.47 1.25 0.31 GY 10.43 1.26 0,75 9.69 1.68 0,55 9.62 1.17 0,33
changes of 4.50% in CRE-01 and 6.27% in CRE-02 under higher selection intensity; for lower selection pressure, the changes were 3.26% and 5.10%, respectively. For all other traits, changes expected in the mean of half-sib families were below 2%.
Conclusions
The semiexotic populations revealed good potential for grain yield and acceptable patterns for other traits to be useful in breeding programs.
Grain yield for the three semiexotic populations showed relative values of 02 < 01 < CRE-03 which are equivalent to 89.4%, 93.8% and 94.6% of check means, respectively.
The quantification of genetic variability showed expression of additive genetic variance for the three populations, thus assuring positive perspectives for the population improvement through recurrent selection toward the development of outstanding cultivars.
The selection for grain weight in the three populations, under the intensity of 20%, that allows to maintain greater genetic variability, indicated considerable gains for continuity in the recurrent selection program. The selection with intensity of 5.56% and 5% indicates a considerable gain, allowing the populations to be used as sources for lineage extraction.
Acknowledgement
The authors thank the Goiás State Research Support Foundation (FAPEG), for the financial support.
References
ANDRADE, J. A. C.; MIRANDA FILHO, J. B. Quantitative variation in the tropical maize population, ESALQ-PB1.
Scientia Agrícola, Piracicaba, v. 65, n. 2, p. 174-182, 2008.
DOI: 10.1590/S0103-90162008000200011.
BASSO, C. M.; MIRANDA FILHO, J. B. Predicting maize composite means under high corn stuynt epiphytotics in Southeastern Brazil. Summa Phytopathologica, Botucatu, v. 27, p. 23-30, 2001.
BORÉM, A.; MIRANDA, G. V. Melhoramento de plantas. Viçosa, MG: UFV, 2009. 523 p.
FALUBA, J. S.; MIRANDA, G. V.; DELIMA, R. O.; SOUZA, L. V.; DEBEM, E. A.; OLIVEIRA, A. M. C. Potencial genético da população de milho UFV 7 para o melhoramento em Minas Gerais. Ciência Rural, Santa Maria, v. 40, n. 6, p. 1250-1256, 2010.
DOI: 10.1590/S0103-84782010000600002.
FARIAS NETO, A. L.; MIRANDA FILHO, J. B. Genetic correlation between traits in the ESALQ-PB1 maize population divergently selected for tassel size and ear height. Scientia Agricola, Piracicaba, v. 58, n. 1, p. 119-123, 2001.
DOI: 10.1590/S0103-90162001000100018.
GERALDI, I. O.; MIRANDA FILHO, J. B.; VENCOVSKY, R. Estimates of genetic parameters for tassel characteristics in maize (Zea mays L.) and breeding perspectives. Maydica, Bergamo, v. 30, p. 1-14, 1985.
GOODMAN, M. M. Broadening the U.S. maize germplasm base. Maydica, Bergamo, v. 50, n. 3, p. 203-214, 2005. HALLAUER, A. R.; CARENA, M. J.; MIRANDA FILHO, J. B. Quantitative genetics in maize breeding. New York: Springer New York, 2010. 663 p.
HALLAUER, A. R.; RUSSEL, W. A.; LAMKEY, K. R. Corn breeding. In: SPRAGUE, G. F.; DUDLEY, J. W. (Ed.). Corn and corn improvement. 3rd ed. Madison: American
Society of Agronomy, 1988.
MIRANDA FILHO, J. B. Exotic germplasms introduced in a Brazilian maize breeding program. Brazilian Journal of Genetics, Ribeirão Preto, v. 15, p. 631-642, 1992.
MIRANDA FILHO, J. B.; REIS, E. F. Genetic enhancement of semi-exotic maize germoplasm. Revista Brasileira de Milho e Sorgo, Sete Lagoas, v. 15, n. 2, p. 346-256, 2016.
DOI: 10.18512/1980-6477/rbms.v15n2p346-356.
MIRANDA FILHO, J. B.; VIÉGAS, G. P. Milho híbrido. In: PATERNIANI, E.; VIÉGAS, G. P. (Ed.). Melhoramento e produção do milho. Campinas: Fundação Cargill, 1987. v. 1, p. 277-340.
MOCK, J. J.; PEARCE, R. B. An ideotype of maize. Euphytica, Wageningen, v. 24, n. 3, p. 613-623, 1975. NASS, L. L.; MIRANDA FILHO, J. B.; SANTOS, M. X. Uso de germoplasma exótico no melhoramento. In: NASS, L. L.; VALOIS, A. C. C.; MELO, I. S. de; VALADARES-INGLIS, M. C. (Ed.). Recursos genéticos e melhoramento-plantas. Rondonópolis: Fundação MT, 2001. p. 101-122. OLIVEIRA, A. S.; MIRANDA FILHO, J. B.; REIS, E. F. Variability and inbreeding in semiexotic maize populations. Genetics and Molecular Research, Ribeirão Preto, v. 14, p. 1184-1199, 2015a. DOI: 10.4238/2015.February.6.21.
OLIVEIRA, A. S.; REIS, E. F.; MIRANDA FILHO, J. B.; MENDES, U. C.; RODRIGUES, L. O. Genetic variability and yield potential of three semiexotic maize (Zea mays L.) populations. Bioscience Journal, Uberlândia, v. 31, n. 6, p. 1609-1617, 2015b. DOI: 10.14393/BJ-v31n6a2015-28783.
PATERNIANI, E. Influence of tassel size on ear placement in maize (Zea mays L.). Maydica, Bergamo, v. 26, p. 85-91, 1981.
PATERNIANI, E. Maize breeding in the tropics. Critical Reviews in Plant Sciences, v. 9, n. 2, p. 125-154, 1990.
DOI: 10.1080/07352689009382285.
PATERNIANI, E.; MIRANDA FILHO, J. B. Melhoramento de populações. In: PATERNIANI, E.; VIÉGAS, G. P.
(Ed.). Melhoramento e produção do milho. Campinas: Fundação Cargill, 1987. cap. 6, p. 215-274.
REGITANO NETO, A.; NASS, L. L.; MIRANDA FILHO, J. B. Potential of twenty exotic germplasms to improve Brazilian maize architecture. Brazilian Journal of Genetics, Ribeirão Preto, v. 20, n. 4, p. 691-696, 1997.
DOI: 10.1590/S0100-84551997000400022.
SANGOI, L.; ALMEIDA, M. L.; SILVA, P. R. F.; ARGENTA, G. Bases morfofisiológicas para maior tolerância dos híbridos modernos de milho a altas densidades de plantas. Bragantia, Campinas, v. 61, n. 2, p. 101-110, 2002.
DOI: 10.1590/S0006-87052002000200003.
SANTOS, P. G.; JULIATE, F. C.; BUIATTI, A. L.; HAMAWAKI, O. T. Avaliação do desempenho agronômico de híbridos de milho em Uberlândia, MG. Pesquisa Agropecuária Brasileira, Brasília, DF, v. 37, n. 5, p. 597-602, 2002.
DOI: 10.1590/S0100-204X2002000500004.
SOUZA JÚNIOR, C. L.; GERALDI, I. O.; ZINSLY, J. R. Influence of tassel size on the expression of prolificacy in maize (Zea mays L.). Maydica, Bergamo, v. 30, n. 3, p. 321-328, 1985.
SPRAGUE, G. F.; EBERHART, S. A. Corn breeding. In: SPRAGUE, G. F. (Ed.). Corn and corn improvement. Madison: American Society of Agronomy, 1977. p. 305-362.
VENCOVSKY, R.; BARRIGA, P. Genética biométrica no fitomelhoramento. Ribeirão Preto: Sociedade Brasileira de Genética, 1992. 496 p.
TROYER, A. F. Breeding early corn. In: HALLAUER, A. R. (Ed.). Specialty corns. Boca Raton: CRC Press, 1994. p. 341-396.