Journal of Yoga, Physical Therapy and
Rehabilitation
Research Article
Catela DPR, et al. Yoga Phys Ther Rehabil YPTR-156.Effect of Slow Abdominal Breathing Technique on Heart Rate
Variability in Male Smokers
David Paulo Ramalheira Catela1*, Ana Paula de Lemos Teixeirae Seabra2, Cristiana Isabel André Mercê1, Marco António Colaço
Branco3
1Sport Sciences School of Rio Maior (ESDRM), IPSantarem Research Unit (UI-IPS) - Applied Psychology; Life Quality Research
Cen-tre (CIEQV) - Motor Behaviour, Portugal
2Sport Sciences School of Rio Maior (ESDRM), IPSantarem Research Unit (UI-IPS) - Applied Psychology, Portugal
3Sport Sciences School of Rio Maior, Polytechnic Institute of Santarém, IPSantarem Research Unit (UI-IPS); Interdisciplinary Centre
for the Study of Human Performance (CIPER), Faculty of Human Kinetics, University of Lisbon
*Corresponding author: David Paulo Ramalheira Catela, Sport Sciences School of Rio Maior (ESDRM), IPSantarem Research Unit
(UI-IPS) - Applied Psychology, Life Quality Research Centre (CIEQV) - Motor Behaviour, Portugal. Tel: +351939668571; Email: [email protected]
Citation: Catela DPR, de Lemos Teixeira e Seabra AP, Mercê CIA, Branco MAC (2018) Effect of Slow Abdominal Breathing
Tech-nique on Heart Rate Variability in Male Smokers. Yoga Phys Ther Rehabil YPTR-156. DOI: 10.29011/2577-0756. 000056
Received Date: 13 April, 2018; Accepted Date: 27 April, 2018; Published Date: 07 May, 2018
DOI: 10.29011/2577-0756. 000056
Abstract
Cigarette smoking is one of the highest contributors to the risk of cardiovascular diseases. The aim of the study was to verify the effect of a breathing technique on cardiac autonomic function in long-term male smoker subjects, by short-term heart rate variability analysis. The effect of a breathing technique on heart rate variability, in five long-term male smokers was ana-lyzed. For almost all participants in this study, paced and predominantly abdominal breathing was beneficial, because it afforded greater asymmetry in term heart rate variability, as expressed by Poincaré plots, reinforced by significantly higher short-term variability, long-short-term variability, root mean square of successive differences, differences of successive intervals greater than 50ms, and Approximate Entropy. An easily learned breathing technique, which is inexpensive and non-intrusive, can help smokers to momentarily remedy the nefarious cardiac effects of their smoking habit.
Keywords:
Breathing Technique; Smoker; Heart Rate Variability; RecurrenceIntroduction
Cigarette smoking is one of the highest contributors to the risks of cardiovascular diseases, including coronary heart disease, stroke, sudden death, peripheral artery disease, and aortic aneurysm [1].
Heart Rate Variability (HRV) represents the variations of the RR intervals, i.e., the time elapsing between two consecutive R waves and has been used as an expression of physiological factors that modulate the heart rhythm [2]. The Sympathetic Nervous System (SNS) acts to increase heart rate and the Parasympathetic Nervous System (PNS) acts to lower heart rate [3]. Even in controlled respiration (at a rate of 15/min) the expected increase of HRV temporal parameters doesn’t occur in smokers, while it
occurs in nonsmokers [4]. A decreased vagal activation is present in heavy smokers compared to non-smokers or moderate smokers [5]. Accordingly, there is a decreased HRV in chronic cigarette smokers compared to non-smokers [6,7]. A decrease of HRV is also found in healthy habitual adult smokers compared to those in non-smokers; with the number of cigarettes smoked per day correlated with the HRV parameters; even smoking one cigarette leads to overt sympathetic excitation [8]. In a supine position, long-term heavy smokers (men) also reveal HRV temporal parameters which are significantly lower than in nonsmokers [6]. Active smoking also has acute effects on HRV; under controlled respiration (15 cycles per min), smokers without evidence of cardiopulmonary disorders, and after an overnight abstinence from smoking, revealed that 3 minutes after smoking 1 cigarette there was a significant decrease of the Respiratory Sinus Arrhythmia (RSA), and after 10 to 17
minutes, a significant increase of sympathetic activity. Also, a long-term significant effect was found in the RSA (in the supine position) between young (30 years old or less) heavy smokers (more than 25 cigarettes per day) and moderate smokers or nonsmokers [5,9-11]. Acute cigarette smoking alters HRV parameters, particularly within the first 5 to 10 minutes after smoking [11].
RSA is the variation in Heart Rate (HR) with breathing, HR increases during inhalation and decreases during exhalation [12]. Slow breathing increases RSA magnitude compared to spontaneous breathing [13], and increases baroreflex sensitivity [14]. In reaction to variations in blood pressure, detected by stretch receptors located mainly in the aortic arch and the carotid sinus, the baroreflex modulates cardiac vagal and sympathetic outflow to the sinus node in the heart, and results in a significant reduction in Heart Rate (HR) [15]. In normal subjects and in chronic heart failure patients, slowing breath frequency can increase Baroreceptor Reflex Sensitivity (BRS) and also reduce muscle nerve sympathetic activity [16,17]; because the brainstem respiratory oscillator is coupled with the central sympathetic network [18].
Recurrence is a fundamental characteristic of many dynamical systems [19]. The method of Recurrence Plots (RP) allow visualizing recurrences [20]. One of the first applications of RP was the analysis of heart beat intervals [21]. The RP exhibits characteristic large-scale and small-scale patterns which are caused by typical dynamical behavior [22]. Processes with uncorrelated or weakly correlated, stochastic or chaotic behavior cause none or very short diagonals, whereas deterministic processes cause longer diagonals and less single, isolated recurrence points. Horizontal and vertical black lines mean that state does not change for some time. Periodic states cause continuous and periodic diagonal lines, but no vertical or horizontal lines. On the other hand, chaos-chaos transitions represent states with short laminar behavior and cause vertically and horizontally spread black areas. The fully developed chaotic state causes a rather homogeneous RP with numerous single points and some short diagonal or vertical lines [23]. The RP before a life-threatening arrhythmia is characterized by large black rectangles, whereas the RP from healthy people shows only small rectangles [23].
Referring to non-linear analysis, a Poincaré plot is a visual representation of the dependence between successive RR intervals, it depicts the correlation between consecutive intervals in graphical representation [24,25]. These plots are studied mathematically by determining the standard deviations of the lengths of RR intervals (RR(n)) [26]; the short term variability (SD1) of the heart signal is measured by the points that are perpendicular to the line-of-identity; and, long term variability (SD2) by the points along the line-of-identity [27,28]. This plot is quantified by fitting to an ellipse where SD1 and SD2 are the semi-axis of this ellipse. SD1 is the standard deviation of successive differences and SD2
is the standard deviation of R-R intervals [29,30]. Another useful parameter is Approximate Entropy (ApEn), a measure of the disorder in the HR signal which quantifies the amount of regularity and complexity of time series. The value of ApEn is higher for more varying data, for more varying time domain signals, while regular and predictable time series signals will have lower ApEn values [27]. Greater regularity (lower ApEn) clinically corresponds to compromised physiology in cardiologic settings [31]; e.g., there is greater regularity in spectral analysis of HR in preterm babies [32]. The value of N for ApEn computations is typically between 100 and 5.000. Approximate entropy indicates the fluctuation in the time domain signal [33].
In the time-domain analysis, pNN50, the proportion of interval differences of successive intervals greater than 50ms, and r-MSDD, the root mean square of successive differences, are used [2]. Therefore, the purpose of the present study was to verify the effect of a breathing technique on cardiac autonomic function in long-term male smoker subjects, by short-term HRV analysis.
Methods
Sample
The sample was composed of 5 long-term male smokers (46.0±8.22 years of age), 4 of them heavy smokers (more than 20 cigarettes per day) [34].
Procedures and Data Treatment
The physiological data acquisition and recording were carried out through Polar V800 [35]. Each volunteer gave informed written consent before the study. Records were conducted at the participants’ homes, with subjects in the supine position, in a quiet environment, with room temperature between 19 and 22°C.
Participants were instructed to not smoke, drink alcohol or coffee 4h before data collection. No participant was taking medication for anxiety or depression; and, there was no report of damage to the kidneys, heart or brain [36,37].
The experimental session was structured according to the following sequence: 6 min of rest with normal breathing, taken as baseline (RC), and 6mn abdominal breathing technique (BC). In a previous training period, of about 5 to 10mn, participants were instructed relative to abdominal breathing technique, as follows: (1) put one hand on your chest and the other on your belly, (2) breath only through your nose, (3) fill your belly with air, and then let it go out slowly. No attempt was made to control the depth or the pace of breathing, so that each individual was able to maintain comfortable breathing. The aim of the training session was to allow participants to be aware of the technique of a slower and predominantly abdominal respiration. The recording of spontaneous breathing (RC) was always done first.
In order to analyze HRV the gHRV software was used [38]. Heart rate data was automatically filtered employing adaptive thresholds in order to reject incorrect beats [39], that uses adaptive thresholding for rejecting beats whose value exceeds the cumulative mean threshold while also eliminating points that are not within acceptable physiological values. Frequency domain analysis was obtained using a linear interpolation method; as a result, the filtered non-equispaced heart rate signal was obtained [40]. The signal interpolation was made at 4 Hz, for spectral analysis. The window size and the time shift were 120 and 60 s, respectively. For non-linear indexes, approximated entropy, SD1, SD2, Poincaré and Lorenz (recurrence) plots were obtained. Non-linear indexes, approximated entropy was calculated following the algorithms described in [41] and [42], respectively. For the analysis of time series the dimension m and the delay, the estimation of the smallest sufficient embedding dimension (false nearest-neighbors algorithm) [43] and mutual information function [44],were used respectively.
Data were statistically treated with the program IBM-SPSS,
version 24. Shapiro-Wilk test was used to verify data normal distribution. Wilcoxon test was used for within group comparison. Effect size r was calculated [45].
Results
Time series and Recurrence Plots (RP) are presented for each participant, with baseline (RC) at left and breathing control condition (BC) at right.
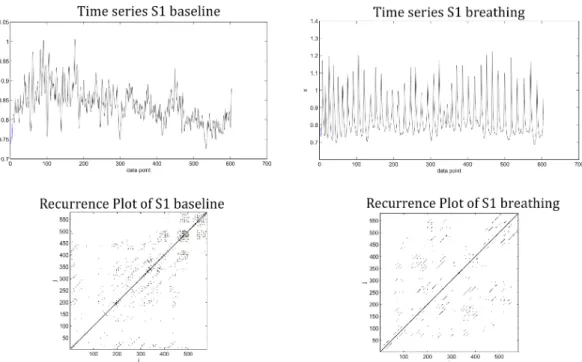
In smoker 1, time series of RC and BC clearly reveal changes in state space, with RP of baseline paling away from the Long Diagonal Line (LOI), indicating a non-stationary system with slowly varying parameters. On the other side, during the BC, a fully developed chaotic state emerged, with numerous single points and some short diagonal lines [23]; also, some checkerboard structures are apparent, meaning that the process has evolved to a quasi-periodic system; as expected if a well-defined RSA has occurred, which is evident in the respective time series (Figure 1).
Figure 1: Heart beat interval RR time series (above) and recurrence plots (below), for heavy smoker 1 (50 years old), during 5mn, at rest (baseline) (left) and with breathing technic (right).
In smoker 4, time series of RC and BC also reveal changes in state space, with RP of RC with isolated recurrence points, indicating states that fluctuate strongly for every short period. However, during the BC, an abrupt change is apparent with presence of white bands [23] (Figure 2).
Figure 2: Heart beat interval RR time series (above) and recurrence plots (below), for heavy smoker 4 (40 years old), during 5mn, at rest (baseline) (left) and with breathing technic (right).
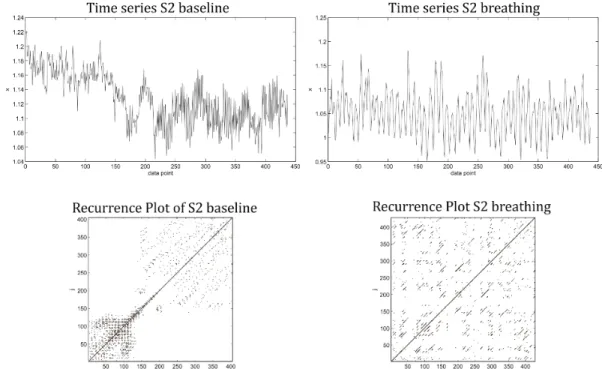
Like in smoker 4, RP of RC in smoker 2 is characterized by isolated recurrence points, indicating states that fluctuate strongly for every short period. However, during the BC, an abrupt change is apparent with presence of white bands [23] (Figure 3).
Figure 3: Heart beat interval RR time series (above) and recurrence plots (below), for smoker 2 (55 years old), during 5mn, at rest (baseline) (left) and with breathing technic (right).
In smoker 3, a similar pattern of smokers 4 and 2 is found in RC, isolated recurrence points, indicating states that fluctuate strongly for every short period. However, during the BC, along with some white bands, revealing an abrupt change, short laminar behavior (horizontal and vertical lines) contributing towards black areas revealing transition to chaotic state [23] (Figure 4).
Figure 4: Heart beat interval RR time series (above) and recurrence plots (below), for heavy smoker 3 (35 years old), during 5mn, at rest (baseline) (left) and with breathing technic (right).
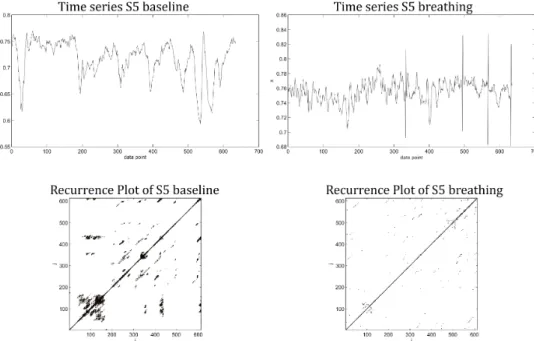
Smoker 5 shows a RP of RC with vertical/horizontal lines with isolated recurrence points, and bowed line structures, which could mean that no or slow changes are occurring in the system, but with different velocity; whereas, during the BC, this tendency vanish somewhat [23] (Figure 5).
Figure 5: Heart beat interval RR time series (above) and recurrence plots (below), for heavy smoker 5 (50 years old), during 5mn, at rest (baseline) (left) and with breathing technic (right).
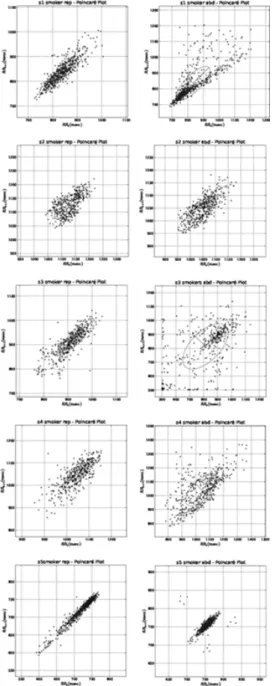
Excepting smoker 5, visual analysis of Poincaré plots confirm a state transition of HRV from RC to BC, behind that in the last one the ellipse becomes larger (SD1), representing the variance corresponding to short-term heart rate variability, and, a visible higher asymmetry relative to the identity line, with the upper part, corresponding to decelerations of heart rate, larger than the lower part, which corresponds to accelerations [46]; this asymmetry is clearly evident in smokers 1 and 4 (Figure 6). Poincaré plots of smoker 5 are more like a torpedo pattern [25], with little short-time HRV.
Figure 6: Poincaré plot showing the self-similarity of data in the baseline (RC) and the breathing control condition (BC), ordered from smoker 1 (top) to smoker 5 (bottom).
The calculation of SD1 and SD2 confirms general tendency of Lorenz and Poincaré plots, short and long-term beat-beat variability is significantly higher during BC than during RC; being that for SD1 the ratio is of 1:3, and for SD2 of 1:2 (Table 1).
RC BC Z r
SD1 18.53±8.27 61.01±12.77 2.023* 0.90
SD2 51.33±37.55 115.11±75.00 2.023* 0.90
Note: *p<0.05
Table 1: Calculation of SD1 and SD2 (mean±standard deviation), comparison within group (Z), and effect size (r), per condition (RC- Baseline Condition; BC- Breathing Condition).
In ApEn the BC allowed smokers to have (negative) values closer to zero, and significantly higher than in RC, meaning that their HR became less regular and more complex, as expected when HRV increases (Table 2). Significantly higher r-MSSD and pNN50 achieved in BC compared to RC, are in accordance with ApEn values, the breathing mode in BC enhanced heart rate variability (Table 2).
RC BC Z r
pNN50 10.63±12.28 30.571±25.37 3.644*** 0.65
r-MSSD 26.15±12.57 52.38±30.62 4.076*** 0.77
ApEn -0.0055±0.002 -0.0014±0.007 2.685** 0.48
Note: **p˂0.01; ***p<0.001
Table 2: Proportion of interval differences of successive intervals greater than 50ms (pNN50), root mean square of successive differences (r-MSDD), approximate entropy (ApEn), comparison within group (Z), and effect size (r), per condition (RC- Baseline Condition; BC- Breathing Condition).
Discussion
With simple instructions and reduced time of practice, five minutes of paced breathing, predominantly abdominal, were enough to have beneficial (transient) effects in HRV of male smokers. The BC allowed these smokers to have a higher HRV, confirmed by significantly higher SD1, SD2, pNN50, r-MSSD and ApEn. Poincaré and Lorenz plots showed that not all participants responded the same way and with the same intensity to the BC.
The results of this study showed that a respiratory training intervention, brief and of low-cost, can be used to benefit cardiovascular functions in smokers. Our results support the hypothesis that self-regulated paced breathing, predominantly abdominal, can be used as a complementary non-pharmacological and non-clinical procedure for smokers.
Conclusion
Asymmetry is highest in systems with healthy physiology [47], so for almost all participants in this study, a paced and predominantly abdominal breathing was beneficial, because
it afforded greater asymmetry in short-term HR variability, as expressed by Poincaré plots, reinforced by significantly higher SD1, SD2, r-MSSD, pNN50, and ApEn. An easily learned breathing technic, inexpensive and non-intrusive, can help smokers to momentarily remedy the nefarious cardiac effects of their smoking habit.
Conflict of Interest:
The authors declare that do not exist any conflict of interest or any economic interest.References
Jonas MA, Oates JA, Ockene JK, Hennekens CH (1992) Statement 1.
on smoking and cardiovascular disease for health care professionals. American Heart Association. Circulation 86: 1664-1669.
Camm, A.J., et al. (1996) Heart rate variability - Standards of mea-2.
surement, physiological interpretation, and clinical use. Circulation 93: 1043-1065.
Sinski M, Lewandowski J, Abramczyk P, Gaciong Z (2006) Why study 3.
sympathetic nervous system? Journal of Physiology and Pharmacol-ogy: An Official Journal of the Polish Physiological Society 57: 79-92. Barutcu I , Esen AM , Kaya D , Turkmen M , Karakaya O , et al. 4.
(2005) Cigarette smoking and heart rate variability: dynamic influence of parasympathetic and sympathetic maneuvers. Annals of Noninva-sive Electrocardiology: The Official Journal of the International Society for Holter and Noninvasive Electrocardiology, Inc. 10: 324-329. Hayano J, Yamada M, Sakakibara Y, Fujinami T, Yokoyama K, et al. 5.
(1990) Short- and long-term effects of cigarette smoking on heart rate variability. The American Journal of Cardiology 65: 84-88.
Levin FR, Levin HR, Nagoshi C (1992) Autonomic functioning and 6.
cigarette smoking: Heart rate spectral analysis. Biological Psychiatry 31: 639-643.
Penny WJ, Mir MA (1986) Cardiorespiratory response to exercise be-7.
fore and after acute beta-adrenoreceptor blockade in nonsmokers and chronic smokers. Int J Cardiol 11: 293-304.
Alyan O, Kacmaz F, Ozdemir O, Maden O, Topaloglu S, et al. (2008) 8.
Effects of cigarette smoking on heart rate variability and plasma N-terminal pro-B-type natriuretic peptide in healthy subjects: Is there the relationship between both markers ? Annals of Noninvasive Electro-cardiology 13: 137-144.
Kobayashi F , Watanabe T , Akamatsu Y , Furui H , Tomita T , et al. 9.
(2005) Acute effects of cigarette smoking on the heart rate variability of taxi drivers during work. Scandinavian Journal of Work, Environment & Health 31: 360-366.
Niedermaier ON, Smith ML, Beightol LA, Zukowska-Grojec Z, Gold-10.
stein DS, et al. (1993) Influence of cigarette smoking on human auto-nomic function. Circulation 88: 562-571.
Karakaya O, Barutcu I, Kaya D, Esen AM, Saglam M, et al. (2007) 11.
Acute effect of cigarette smoking on heart rate variability. Angiology 58: 620-624.
Lehrer PM, Vaschillo E, Vaschillo B (2000) Resonant frequency bio-12.
feedback training to increase cardiac variability: Rationale and manual for training. Applied Psychophysiology and Biofeedback. 25: 177-191.
Pagani M, Lombardi F, Guzzetti S, Rimoldi O, Furlan R, et al. (1986) 13.
Power spectral analysis of heart rate and arterial pressure variabilities as a marker of sympatho-vagal interaction in man and conscious dog. Circulation Research 59: 178-193.
Gerritsen J, Voorde BJT, Dekker JM, Kostense PJ, Bouter LM, et al. 14.
(2000) Baroreflex sensitivity in the elderly: influence of age, breathing and spectral methods. Clinical Science 99: 371-381.
Song HS1, Lehrer PM (2003) The effects of specific respiratory rates 15.
on heart rate and heart rate variability. Applied Psychophysiology and Biofeedback 28: 13-23.
Bernardi L, Porta C, Spicuzza L, Bellwon J, Spadacini G, et al. (2002) 16.
Slow breathing increases arterial baroreflex sensitivity in patients with chronic heart failure. Circulation. 105: 143-145.
Goso Y, Asanoi H, Ishise H, Kameyama T, Hirai T, et al. (2001) Respi-17.
ratory modulation of muscle sympathetic nerve activity in patients with chronic heart failure. Circulation 104: 418-423.
Preiss G, Kirchner F, Polosa C (1975) Patterning of sympathetic 18.
preganglionic neuron firing by the central respiratory drive. Brain Res 87: 363-374.
Poincaré H (1890) Sur le probleme des trois corps et les équations de 19.
la dynamique. Acta Mathematica. 13: A3-A270.
Eckmann JP, Kamphorst SO, Ruelle D (1987) Recurrence Plots of Dy-20.
namical Systems. EPL 4: 973.
Zbilut JP, Koebbe M, Loeb H, Mayer-Kress G (1990) Use of recur-21.
rence plots in the analysis of heart beat intervals. in [1990] Proceed-ings Computers in Cardiology.
Balakrishnan V, Nicolis G, Nicolis C (2001) Recurrence time statistics 22.
in chaotic dynamics: multiple recurrences in intermittent chaos. Sto-chastics and Dynamics 1: 345-359.
Marwan N, Romano CM, Thiel M, Kurths J, (2007) Recurrence plots 23.
for the analysis of complex systems. Physics Reports 438: 237-329. Kamen PW, Krum H, Tonkin AM. (1996) Poincare plot of heart rate 24.
variability allows quantitative display of parasympathetic nervous ac-tivity in humans. Clin Sci (Lond) 91: 201-208.
Woo MA, Stevenson WG, Moser DK, Trelease RB, Harper RM. (1992) 25.
Patterns of beat-to-beat heart rate variability in advanced heart failure. American Heart Journal 123: 704-710.
Tulppo MP, Mäkikallio TH, Takala TE, Seppänen T, Huikuri HV (1996) 26.
Quantitative beat-to-beat analysis of heart rate dynamics during exer-cise. The American Journal of Physiology 271: H244-252.
Acharya UR, Faust O, Sree V, Swapna G, Martis RJ, et al. (2014) 27.
Linear and nonlinear analysis of normal and CAD-affected heart rate signals. Computer Methods and Programs in Biomedicine 113: 55-68. Stein PK, Reddy A (2005) Non-Linear Heart Rate Variability and Risk 28.
Stratification in Cardiovascular Disease. Indian Pacing and Electro-physiology Journal. 5: 210-220.
Brennan M, Palaniswami M, Kamen P (2001) Do existing measures 29.
of Poincare plot geometry reflect nonlinear features of heart rate vari-ability? IEEE Trans Biomed Eng 48: 1342-1347.
Brennan M, Palaniswami M, Kamen P (2002) Poincaré plot interpreta-30.
tion using a physiological model of HRV based on a network of oscil-lators. American Journal of Physiology. Heart and Circulatory Physiol-ogy. 283: H1873-1886.
Pincus SM (2000) Approximate entropy in cardiology. Herzschritt-31.
machertherapie und Elektrophysiologie 11: 139-150.
Aärimaa T, Oja R, Antila K, Välimäki I (1988) Interaction of heart rate 32.
and respiration in newborn babies. Pediatric Research 24: 745-750. Pincus SM (1991) Approximate entropy as a measure of system com-33.
plexity. Proceedings of the National Academy of Sciences of the Unit-ed States of America 88: 2297-2301.
Heatherton TF, Kozlowski LT, Frecker RC, Rickert W, Robinson J 34.
(1989) Measuring the heaviness of smoking: using self-reported time to the first cigarette of the day and number of cigarettes smoked per day. British Journal of Addiction 84: 791-799.
Giles D, Draper N, Neil W (2016) Validity of the Polar V800 heart rate 35.
monitor to measure RR intervals at rest. European Journal of Applied Physiology 116: 563-571.
Laurent S, Cockcroft J, Van Bortel L, Boutouyrie P, Giannattasio C, et 36.
al. (2006) Expert consensus document on arterial stiffness: method-ological issues and clinical applications. Eur Heart J 27: 2588-605. Mancia G, Fagard R, Narkiewicz K, Redon J, Zanchetti A, et al. 37.
(2013) 2013 ESH/ESC guidelines for the management of arterial hy-pertension: the Task Force for the Management of Arterial Hyperten-sion of the European Society of HypertenHyperten-sion (ESH) and of the Euro-pean Society of Cardiology (ESC). Eur Heart J 34: 2159-219. Rodríguez-Liñares L, Lado MJ, Vila XA, Mendez AJ, Cuesta P (2014) 38.
gHRV: Heart rate variability analysis made easy. Computer Methods and Programs in Biomedicine 116: 26-38.
Rodriguez-Linares L, Vila XA, Mendez AJ (2012) gHRV: a user friendly 39.
application for HRV analysis. 7th Iberian Conference on Information Systems and Technologies (Cisti 2012).
Vila J, Palacios F, Presedo J (1997) Time-frequency analysis of heart-40.
rate variability. IEEE Engineering in Medicine and Biology Magazine 16: 119-126.
Kaplan DT, Furman MI, Pincus SM (1990) Techniques for analyzing 41.
complexity in heart rate and beat-to-beat blood pressure signals. in Proceedings Computers in Cardiology.
Pincus SM, Goldberger AL (1994) Physiological Time-Series Analysis: 42.
What Does Regularity Quantify? American Journal of Physiology 266: H1643-H1656.
Kantz H, Schreiber T (2004) Nonlinear time series analysis. Cam-43.
bridge university press.
Cao L (1997) Practical method for determining the minimum embed-44.
ding dimension of a scalar time series. Physica D: Nonlinear Phenom-ena 110: 43-50.
Field A (2013) Discovering statistics using IBM SPSS statistics. (Sage ed.) 45.
Piskorski J, Guzik P (2007) Geometry of the Poincaré plot of RR inter-46.
vals and its asymmetry in healthy adults. Physiological Measurement 28: 287-300.
Costa M, Goldberger AL, Peng C (2005) Broken asymmetry of the hu-47.
man heartbeat: loss of time irreversibility in aging and disease. Psysi-cal Review Letters 95: 102-198.