Evaluation by Instrumentation. Part 2: Experimental Site at
the Faculty of Engineering of the University of Porto
Paulo José Rocha de Albuquerque, Faiçal Massad, Antonio Viana da Fonseca, David de Carvalho,
Jaime Santos, Elisabete Costa Esteves
Abstract.Three different types of piles (bored, CFA and precast driven) were installed in the experimental site located in the Campus of the Faculty of Engineering of the University of Porto to study the effects of the construction method on pile performance. The subsoil is a residual granitic soil reaching depth levels over 20 m. In this site, several field and laboratory tests were conducted to obtain the local geotechnical parameters. Static pile load tests with load-unload cycles were performed. Bored
and CFA piles were instrumented along the depth,with installation of retrievable sensors; a flat-jack load cell was inserted at the
bottom of the bored pile. Load tests results demonstrated that bored and CFA piles show similar behavior: i) the applied load reaching the pile tip was about 42%, ii) and the average mobilized lateral resistance was about 60 kPa. After the tests were completed, piles were extracted for further inspection of shaft and load cell conditions. The driven pile although having a smaller cross-section showed a stiffer response and higher resistance than the other two piles, which are a clear indication that the installation effects play an important role in the pile response. The results are compared to those obtained in Part 1 of this article relating to tests performed at the Experimental Field of Unicamp (State University of Campinas).
Keywords:construction technique, bored pile, CFA pile, precast pile, instrumentation, granitic residual soil.
1. Introduction
The use of deep foundations in the City of Porto, in the North of Portugal, has been very frequent, mainly due to the particular geotechnical conditions of that area and the great development of means and processes of construction for this type of ground conditions. Therefore, knowledge of opera-tion and calculaopera-tion parameters used in design is essential. Many factors influence the behavior of deep foundations, some of which are difficult or even impossible to be charac-terized, so that the design methods for piles, especially in re-sidual soils, still remain undefined. Thus, it became important to conduct axial compressive load tests on three different piles: bored with temporary casing, CFA and pre- castsquare.Pileswereexecutedunderthesamecurrentprac-tice conditions and utilizing internal instrumentation at depth, allowing the assessment of load distribution along the shaft. Tests were conducted at the Experimental site of the Faculty of Engineering of the University of Porto, where a broad geotechnical site investigation was carried out, includ-ing a significant number ofin situand laboratory tests. The
experimental site is composed of granitic subsoil, character-ized by a very heterogeneous residual soil (saprolitic).
This study was conducted within a project supported by specialized companies and integrated in an International Prediction Event (Class A). The event was organized by the Faculty of Engineering of the University of Porto (FEUP) and the High Technical Institute of the Technical Univer-sity of Lisbon (IST-UTL) in collaboration with the TC18 of the ISSMGE and the organizers of the ISC'2 Conference in Porto in September 2004 (Viana da Fonseca & Santos, 2008).
2. Experimental Site of Feup
2.1. Geological-geotechnical characteristics
In the northern region of Portugal, granitic residual soils prevail, reaching depths over 20 m. These soils have particular characteristics as a consequence of the variability and heterogeneity in macroscopic level and, on the other hand, by the inter-particles spatial arrangement and distri-bution. In Portugal, a country that has temperate weather, residual soils are generally found in the northern coast, characterized by a high rainfall rate with moderate temper-atures and low gradients (Costa Esteves, 2005).
Paulo José Rocha de Albuquerque, D.Sc, Faculdade de Engenharia Civil, Arquitetura e Urbanismo, Universidade Estadual de Campinas, Av. Albert Einstein 951, 13083-852 Campinas, SP, Brazil. e-mail: [email protected].
Faiçal Massad, D.Sc., Escola Politécnica, Universidade de São Paulo, Av. Professor Almeida Prado 271, Trav. 2, Cidade Universitária, 05508-900 São Paulo, SP, Brazil. e-mail: [email protected].
Antonio Viana da Fonseca, D.Sc., Faculdade de Engenharia, Universidade do Porto, Rua Dr. Roberto Frias 4200-465, Porto, Portugal. e-mail: [email protected].
David de Carvalho, D.Sc, Faculdade de Engenharia Agrícola, Universidade Estadual de Campinas, Av. Marechal Rondon 501, 13083-875 Campinas, SP, Brazil. e-mail: [email protected].
Jaime Santos, D.Sc., Instituto Superior Técnico, Universidade Técnica de Lisboa, Av. Rovisco Pai 1049-001, Lisbon, Portugal. e-mail: [email protected]. Elisabete Costa Esteves, M.Sc., Instituto Superiorde Engenharia do Porto, Rua Dr. Antonio Bernardino de Almeida 431, 4200-072 Porto, Portugal. e-mail: [email protected]. Submitted on February 4, 2010; Final Acceptance on September 20, 2010; Discussion open until August 31, 2011.
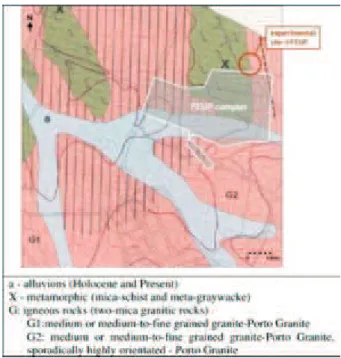
The experimental site is located in the University Campus at the Faculty of Engineering of the University of Porto, Portugal. Its location is shown in Figs. 1 and 2, where the geological map of the Porto Region and the Experimen-tal site is also shown.
It can be noticed that the site is located in a region where igneous rocks predominate: medium or medium to fine grained granite named Porto's granite.Subsoil is
consti-tuted by medium to fine particle sand (young residual soil) up to 1.5 m to 2 m thick, followed by a layer of approxi-mately 13 m of residual soil composed of medium to fine sand (structured residual soil). Between 15 and 20.5 m, a me-dium particle and very weathered granite is found. Ground water table can be found at 8.5 m to 11.5 m, depending on the period of the year. Several in situ tests were conducted (SPT, CPTU, DMT, PMT and seismic tests) to characterize the soil. Laboratory tests were performed on undisturbed sam-ples obtained from the studied site: triaxial, resonant column and oedometric tests, besides usual identification tests. The localization of these tests is represented together with the tested piles in Fig. 3. Figures 4, 5 and 6 show the variation of
NSPT,qcandfswith depth, respectively.
2.2. Execution of piles characteristics
In this experimental site, a total of 14 piles were exe-cuted; 10 were 600 mm diameter bored piles, installed
us-ing a temporary steel casus-ing, two of which were shorter, 6 m long (E0 and E9) and eight were 22 m long. These were used as reaction piles (E1 to E8); two 600 mm diameter
Figure 1- Geological map of Porto Region (Viana da Fonsecaet al., 2004).
Figure 2- Geological map of the experimental site (Viana da
CFA piles were installed to 6 m depth (T1 and T2) and two 350 mm square precast (C1 and C2) were precast to a depth of 6 m. Piles followed a predefined alignment and spacing between piles axis was variable but not lower than the usual recommended spacing (around three diameters).
In the static load tests, the reaction system was mate-rialized by the eight bored and longer piles already men-tioned and shown in Fig. 3 (E1 to E8 with 22 m embedded length in the soil). The test piles E9, C1 and T1 were exe-cuted with 6 m of embedded length in the saprolitic soil. Characteristics of the piles are summed up in Table 1. De-tails of installation of each type of pile are given in items 2.4, 2.5 and 2.6.
2.3. Load tests results
The test procedures tried to meet ISSMGE-ERTC3 (De Cock et al., 2003), ASTM D 1143/94 and NBR 12.131/92 recommendations. The piles were loaded in in-crements with unloading cycles and for each loading stage the load was maintained until the displacement rate became less than 0.3 mm/h, with a minimum of 0.5 h and a maxi-mum of 2 h. Maximaxi-mum loads established for each pile are shown in Table 2 and load-settlement curves in Fig. 7.
2.4. Case 1 – Bored pile with temporary casing
2.4.1. Execution technique
Bored piles installed with a temporary casing are those which cause reduced soil displacement, thus, stress Figure 3- Layout of the experimental site (Viana da Fonsecaet
al., 2004). Table 1 -Pile characteristics (Costa Esteves, 2005). Piles (*) Name Type Cross-section (mm) L(m) Longitudinal reinforcement Transverse reinforcement fck (***) (MPa) fcm (***) (MPa) Reaction (tension) E1 to E8 bored Circular ( f 600) <12 A500 12f25 f 12 with a10 cm spacing 27.7 30.9 12 <L <22 A500 6f25 f 12 with a20 cm spacing Static (compression) E9 Bored Circular ( f 600) 6 A500 12f25 f 12 with a10 cm spacing 27.7 30.9 Static and dynamic (compression) C1, C2 precast Square (350x350) 6 A400 8f16 A235 f 6with a16 cm spacing (**) 45 48 Static and dynamic (compression) T1, T2 CFA Circular ( f 600) 6 A500 12f25 f 10 with a10 cm spacing 44 52.6 (*) behavior of piles under dynamic compressive loading or horizontal loading will be the purpose of another study. (**) 8cm spacing near pile head. (***) f ck and fcm :characteristic value and average value of the concrete compressive resistance.
state is slightly changed due to the installation of the drive tube. This kind of pile has the advantage of producing little soil displacement and its use is recommended when mini-mum reduction of movements and soil disturbance is nec-essary useful or even imperative. Its use is particularly recommended when the hole is supposed to be kept stable in non-cohesive, submerged soils, etc.
2.4.2. Execution information
The steel drive tube has high resistance and a ‘cork-screw’ around a central hollow tube to facilitate penetration (Fig. 8).
Soil penetrated in the drive tube, under static com-pression, with small rotations and counter rotations, is
withdrawn by internal cleaning device, always maintain-ing the tube in an advanced position in relation to the borehole and cleaning device (Fig. 9). These piles are cast in place and the steel drive tube can be withdrawn or discarded after the pile is executed. In this case, it was
withdrawn during the concreting process. The with-drawal process is also made by increasing static com-pression and tube rotation, but on a random basis, which influences pile shaft, as it can be seen in the final texture of the concrete.
Figure 5- Variation ofqcandfswith depth from CPT tests (before pile execution).
As already mentioned, eight piles were used as reac-tion for the static loading tests; only one bored pile, E9, was tested under static compressive load, and one of these reac-tion piles was instrumented in order to measure lateral re-sistance under tension loading.
As it can be seen in Fig. 10, after removing soil from the driving tube down to a slightly higher depth (20 cm)
than the final column concrete base (and with careful clean-ing of the bottom), the reinforcement was installed and properly guided. Only then concreting was started, using a ‘tremi’ tube from the base to the top on a continuous basis
Figure 7- Load-settlement curves from static load tests.
Figure 8- a) and b) Steel drive tube; c) Detail of the metal drive tube base (Costa Esteves, 2005).
Figure 9- Cleaning of the tube: a) and b) Borehole; c) Cleaning device (Costa Esteves, 2005). Table 2- Load-settlement values obtained from pile load tests.
Pile Load (kN) Settlement (mm)
Bored – E9 900(*) 1350(**) 155.139.7 CFA – T1 900(*) 1175(**) 10.895.4 Precast – C1 1427 (*)4thcycle.(**)5thcycle.
and trying to maintain (this condition is very important) the flow of the concrete mass (Fig. 11).
2.4.3. Instrumentation
In the static axial loading tests, the load was measured using hydraulic manometers of the system and an electric load cell. Axial and transverse displacements of the pile cap were also measured in several points and with two parallel acquisition systems, assuring redundant independence which allowed to control displacements and rotations in vertical and horizontal directions, as well as the time for each measurement.
Data acquisition was automatically got with detailed temporal scanning depth.
Besides the pile cap instrumentation, six internal sen-sors were installed in E9 and T1 piles (Geokonretrievable
extensometer). The sensors were inserted in PVC Hidronil
tube with a 2” diameter and 6 m of length embedded in the pile. Sensors were connected to a reading unit (Geokon data logger) by an extension or electric cable from the pile cap. Figure 12 shows some details regarding the installation of the sensors and Fig. 13 shows its position in depth.
At the bottom of pile E9 a flat-jack load cell was in-stalled with an electric cable coming up to the top of the pile to connect to the reading unit.
The load cell composed by a high resistant membrane filled with oil was placed between two 25 mm thick, 450 mm diameter steel plates. In Fig. 14b, it can be noticed that mastique was applied to avoid insertion of soil between the plates. Finally, a pressure transducer was linked to the cell (Fig. 14c).
The cell pressure measured in the static loading test multiplied with the total pile cross sectional area was as-sumed to correspond to the portion of applied load reaching the pile tip. In Fig. 14 (d, e, f) procedures for the installation of the already mentioned load cell are shown.
The characteristics of the pressure transducer and load cell can be seen in Table 3.
Four linear variable differential transducers (LVDT) were installed in the three studied piles with 50 mm range and 0.01 mm precision for the measurement of vertical dis-placements and two transducers with the same characteris-tics for the measurement of horizontal displacements. Simultaneously and for redundancy reasons, two
mechani-Figure 10- a) and b) Reinforcement installation; c) Final positioning of the reinforcement (Costa Esteves, 2005).
cal dial gage devices (DG) were installed in order to check the results obtained by the electronic transducers (Fig. 15).
Converting measurements of strain to load is fre-quently thought to require knowledge of pile cross section and Young modulus.
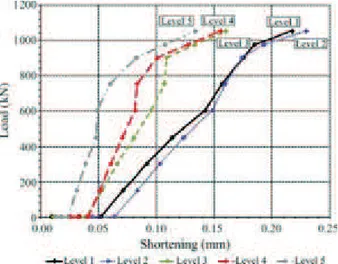
The Young modulus of the pile was obtained from the slope of the strain on the instrument installed in the refer-ence section of the pile – Level 1 (Fig. 16).
The slopes of the shortenings curves (kN/mm) are proportional to the axial stiffness, EA, of the pile. The slope corresponding to modulus value of 20 GPa is indicated un-der assumption that the pile diameter is equal to the
nomi-nal 600 mm value and the distance between gages points of 1020 mm.
Figure 16 shows the shortenings-load curves for each instrumented level of the bored pile.
2.5. Case 2 – CFA pile 2.5.1. Execution technique
The continuous flight auger piles (CFA) are cast in place by drilling the soil through a continuous auger, with a ‘corkscrew’ around a central hollow tube. After reaching the bottom level, while the auger is pulled up, the soil is re-placed with concrete, pumped down through the hollow
Figure 13- Location of sensors (retrievable extensometer) (Costa Esteves, 2005).
Figure 12- Internal instrumentation: a) Anchor; b) Sensor c) Installation of sensors inside PVC tube; d) Sensors connections to reading unit (Costa Esteves, 2005).
tube. There is a metal cap (plug) in its bottom, which opens, like a valve, by the injected concrete to prevent soil or water from entering the hollow tube. As the auger is removed, soil confined between ‘corkscrews’ is also replaced by the crete being injected from the tip level upwards. The con-crete is characterized by a mixture of small aggregate and sand with cement (minimum consumption of 400 kg/m3)
and a value of slump of 190 mm, following prescriptions from The Brazilian Association of Foundations Companies Procedures Manual (ABEF, 1999). The advantages of us-ing this type of pile are: reduced work schedule; applicabil-ity in rather diversified classes of terrains (except for rocks or soils with boulders); lack of disturbances and low vibra-tion level in terrain, in opposivibra-tion to percussion driving
Figure 15- Pile cap instrumentation: a) and b) LVDT transducers; c) DG devices (Costa Esteves, 2005). Figure 14- Load cell installation (Costa Esteves, 2005).
Table 3- Load cell characteristics.
Pressure transducer Load cell
Type Weight-resistivity Plate diameter [m] 0.45
Range [MPa] 0-25 Load cell diameter [m] 0.35
techniques; and, absence of soil decompression and con-tamination when bentonite or other slurries are used. Disad-vantages are associated to the need for a plain terrain allow-ing the equipment to move easily; the demand for a concrete plant close to the work; the need of a shovel loader for soil cleaning and removal, extracted during the drilling; the demand for a minimum volume of piles to justify the equipment mobilization in cost-benefit optimization; and, last but not least, the limitation of pile length and reinforce-ment, which may be considered determinant in certain pro-jects. The production process must receive special atten-tion, especially for shaft continuity control and subsoil disturbance on drilling. It is also important to observe that, in weak soils, concrete injected with high pressure may lead to soil rupture and high consumption. In these situations pressure is due to be moderate and thoroughly controlled by experience. Another important advantage of CFA piles is the possibility of continuous electronic monitoring, provid-ing pile execution monitorprovid-ing, which will be easily ac-cessed and allow an eventual correction. The following pa-rameters are registered: date and time; digging depth; penetration speed; torque; concrete volume and pressure; pile diameter; and pile extraction velocity.
2.5.2. Information on execution
Three CFA piles with 0.60 m diameter and 6 m depth were executed. Twelve reinforcing bars 25 mm diameter (@59 cm2) and 6 m length were used. Stirrups with 10.0 mm
of diameter, spaced in 10 cm completed the reinforcements. The concrete resistance (fck) was 44.0 MPa.
2.5.3. Instrumentation
In this item, the data obtained from the pile instru-mentation are presented. Five retrievable extensometers were installed at depth as previously described and accord-ing to Fig. 13.
The slope corresponding to modulus value of 40 GPa is indicated under assumption that the pile diameter is equal to the nominal 600 mm value and the distance between gages points of 1020 mm.
Figure 17 shows the shortenings-load curves for each instrumented level and loading cycle.
2.6. Case 3 – Precast pile
2.6.1. Execution technique
The precast pile was installed by impact percussion and it is included in the group named ‘displacement piles’. Precast piles can be made of reinforced and pre-stressed concrete compacted by vibration or centrifugation. The main disadvantage of concrete precast piles is the difficulty of adapting to unpredicted soil variations. If pile length is not carefully studied, an amendment or cut will be neces-sary, which will interfere on the costs and schedule for job execution. When precast, these piles cause vibrations and may cause soil compaction. They need to be reinforced in order to resist to bending moments originated from lifting and transportation, driving and lateral forces from the sup-ported structure (Fig. 18).
2.6.2. Information on execution
Driven precast concrete piles were made under rigor-ous control of materials, resulting in high quality reinforced concrete. The equipment used for driving the precast piles was a 40 + 10 kN hydraulic hammer. The pile had a square cross-section (350 mm x 350 mm) and was precast down to the desired depth to an embedded length of 6 m. After driv-ing, the pile was cut off to the desired level.
3. Analysis of Data Obtained From
Instrumentation
As stated before, bored and CFA piles were instru-mented along the depth, with installation of retrievable sen-sors. A flat-jack load cell was inserted at the bottom of the Figure 16- Shortening-Load curves (bored pile).
bored pile. The evaluation of extensometer measurements for piles E9 and T1 to load distributions indicated apparent values of shaft and tip resistances. However, residual loads were present in the piles before the static test. This effect is much more important for the driven pile C1. The analysis of axial loaded pile response can be made from diverse meth-ods. Analysis based on soil parameters determined in labo-ratory or in situ tests rely on simple total stress (alpha) or effective stress (beta) methods, or on more sophisticated numerical finite element method.
The data obtained in this experimental site was ana-lyzed by Felleniuset al.(2007) and Viana da Fonsecaet al.
(2007). Felleniuset al.(2007) used the beta-method and
special preference was given to analysis based on CPTU data, for its continuous and representative scanning of the ground spatial variations. Viana da Fonsecaet al.(2007)
used a mathematical model developed by Massad & Lazo (1998) and Marques & Massad (2004), called “Modified Two Straight Lines Method” for rigid or short piles.
These analyses provided similar and consistent re-sults regarding the mobilized lateral and tip resistances. For the bored and CFA piles the maximum load at each pile head are from a settlement of about 100 mm, chosen to en-sure that both piles are evaluated at the same pile settle-ment. Table 4 summarizes the values obtained by Fellenius
et al.(2007) and Viana da Fonsecaet al.(2007).
The estimated unit shaft resistance was about 60 kPa and the applied load reaching the bored and CFA piles tip was 42%. The driven pile although having a smaller cross-section (43.3%) showed a stiffer response and higher resistance than the other two piles, which are a clear indica-tion of installaindica-tion effects and its importance in the pile re-sponse.
4. Evaluation of Piles After Removal of Soil
In order to inspect the geometrical characteristics of the executed piles and to confirm their integrity, phased ex-cavation of the soil around the piles was carried out, aiming not only at obtaining a good visual characterization but also successive samples of blocks for laboratory testing. This was done up to approximately 6 m depth. For this removal, a study had to be conducted on the possible ways of extrac-tion, since this is a complex and expensive process. Follow-ing, all the excavations steps are described.
To remove the piles, it was necessary, as already mentioned, to excavate the surrounding soil. This excava-tion should be phased, not only to avoid risks associated with instability of excavation ramps but also to enable pile removal with minimum possible damage.
For pile removal, the selection of the retro-excavator to be used (arm length and capacity) was carefully made, considering the weight and the length of all elements (piles and cap block). In Fig. 19, the beginning of excavation is shown with the chosen retro-excavator, with a 6 m length arm.
Two distinct situations were considered in this pro-cess: one regarding the removal of the 6 m long piles and the other removal of 22 m long piles to avoid any interfer-ence with future constructions in the area. Although it would be interesting to remove all the piles, this was not considered necessary, since the deepest objects would not affect future constructions. Thus, the 6 m long piles were removed as a whole while the others were cut-off approxi-mately at the 5 m portion (from soil level) and then re-moved. Figure 20 shows the schematic procedure utilized to remove the 6 m long piles and Fig. 21 shows the adopted procedure for the 22 m long piles.
After pile removal, relevant geometrical characteris-tics were measured after properly cleaning the piles from existing soil in the shaft length. It was observed that geo-metrical characteristics for bored and CFA piles diameters Table 4- Load Distribution for 100 mm pile head settlement.
Pile Vianaet al.(2007) Felleniuset al.(2007)
Ql(kN) Qp(kN) Total load (kN) Ql(kN) Qp(kN) Total load (kN)
E9 (Bored) 696 481 1177 700 500 1200
T1 (CFA) 703 499 1202 700 500 1200
C1 (Precast) 511 to 1021 1004 to 494 1515 520 980 1500
Figure 18- Precast pile: a) Positioning b) Driving (Costa Esteves, 2005).
were slightly higher than the initial nominal diameter (605 mm and 611 mm, respectively).
It is important to highlight that the shaft surface of CFA piles was smoother than the bored pile executed with temporary casing (Fig. 22) and that the last 20 cm to 30 cm of the bored piles showed a significantly reduced diameter, reaching 12% of reduction in pile E9 (525 mm), as it can be seen in Fig. 23.
As reported in item 2.4.2, removal of drive tube in bored piles is made by ascending static pressure and tube rotation, but on a random basis, which does not promote a
perfectly smooth shaft texture in bored piles, as shown in Fig. 22.
This study on pile removal also enabled to check con-ditions of the load cell utilized at the base of pile E9. The load cell was well positioned at the pile base, as seen in Fig. 24.
5. Comparison with Results Obtained in the
EF-Unicamp
Based on the results presented in Part 1 of this paper, the following observations are made:
Figure 20- Pile extraction (6 m): a) beginning of excavation; b) and c) and d) removal of pile from the soil; e) transportation of pile to the warehouse; f) general view of the pile after removal (Costa Esteves, 2005).
As for piles executed at the Experimental site of FEUP, it was found that, unlike pile behavior at the Experi-mental site of Unicamp, the tip of the piles absorbed high loads of around 29% for bored and CFA piles, at Unicamp the average values were about 2% and 7% for bored and CFA piles.
This difference between the values obtained for load absorption at the tip in both experimental fields is explained by the difference between the two soils, which have distinct genesis and resistance. While the pile tip region at the Ex-perimental Site of Unicamp hasNSPTaverage values of 10
blows and cone resistance of 2 MPa, in the EF-FEUP, aver-ageNSPTvalues of 25 blows and cone resistance of 4 MPa
are found.
In the site of EF-FEUP, both CFA and bored piles be-haved similarly in terms of lateral friction. The same hap-pened to the CFA and bored piles in the EF-Unicamp.
Two different techniques were utilized for instrumen-tation of pile shafts; the process executed by Unicamp re-searchers was a rather ‘handicraft’ one, while the one used by FEUP's researchers utilized electric removable exten-someters manufactured by a specialized company. Equip-ment installation techniques on piles were very similar,i.e.,
from insertion of the tube in piles. In spite of utilizing dis-tinct techniques, it was observed that both techniques are
Figure 22- Detail of pile shaft texture: a) bored; b) CFA (Costa Esteves, 2005).
Figure 21- Pile extraction (22 m): a) and b) pile cut-off at portion 5 m; c) and d) detail of the cut pile e) removal of pile from the soil; f) general view of the pile after removal from the soil (Costa Esteves, 2005).
good in terms of measuring load distribution in a deep foun-dation.
6. Conclusions
From the assessment of results obtained from the per-formed tests, the following conclusions can be drawn:
Based on the results obtained from the bored and CFA piles, it seems that the execution process of CFA pile did not provide differences on behavior regarding shaft re-sistance of this type of foundation, which means, it behaved as a bored pile.
Regarding the tip resistance results obtained from CFA and bored piles, both showed similar values, but soil on CFA pile tip was less disturbed, while in the bored pile the soil gradually became stiffer as successive loadings oc-curred.
After the loading tests the piles were extracted and in-spected. The pile surfaces were smooth and the actual di-ameter of piles was very close to the nominal value.
Evaluation of extensometer measurements for piles E9 and T1 to load distributions indicated values of shaft and tip resistances. However, residual loads were present in the piles before the static test, for which the actual magnitude was estimated after trial-and-error back-analysis. The esti-mated unit shaft resistance was about 60 kPa and the ap-plied load reaching the pile tip was 42%.
The precast pile C1 although having a smaller cross-section showed a stiffer response and higher resistance than the other two piles. This is a clear indication that the instal-lation effects play an important role in the pile behavior. In
this case, the pile driving process should have induced sig-nificant changes in the surrounding soil affecting the shaft resistance and inducing residual loads.
References
American Society of Civil Engineers (ASTM) (1994) D 1143-81: Piles under static axial compressive load. Standard test method. In: Annual Book of ASTM Stan-dards, Philadelphia, v. 04.08, pp. 96-106.
Associação Brasileira de Empresas de Fundações (ABEF) (1999) Manual de Especificações de Produtos e Proce-dimentos, 2ª ed. ABEF, São Paulo, 282 pp.
Associação Brasileira de Normas Técnicas (ABNT) (1992) NBR 12131: Estacas: Prova de Carga Estática. Rio de Janeiro.
Costa Esteves, E. (2005) Ensaios e Análise de Resposta de Estacas em Solo Residual do Granito sob Acções Verti-cais. MSc Thesis, Faculdade de Engenharia, Universi-dade do Porto, Porto, 322 pp.
De Cock, F.; Legrand, C. & Huybrechts, N. (2003) Axial static load test (ASPLT) in compression or in tension – Recommendations from ERTC3-Piles, ISSMGE Sub-committee. Proc of the XIII ECSMGE, Prague. v. 3, pp. 717-741.
Fellenius, B.H.; Santos, J.A. & Viana da Fonseca, A. (2007) Analysis of piles in a residual soil – The ISC'2 prediction. Canadian Geotechnical Journal, v. 44, p. 201-220.
Marques, J.AF. & Massad, F. (2004) Provas de carga ins-trumentadas com bulbos, executadas na região praieira de Maceió, Alagoas. Solos e Rochas, v. 27:3, p. 243-260.
Massad, F. & Lazo G. (1998) Método gráfico para interpre-tação da curva carga-recalque de provas de carga verti-cais em estacas rígidas ou curtas. Anais do XI Con-gresso Brasileiro de Mecânica dos Solos e Engenharia Geotécnica, Brasília, v. 3, pp. 1407-1414.
Viana da Fonseca, A.; Carvalho, J.; Ferreira, C.; Tuna, C.; Costa Esteves, E. & Santos, J.A. (2004) Geothecnical characterization of a residual soil profile: the ISC'2 ex-perimental site. Proc. ISC'2 Geothecnical and Geophys-ical Site Characterization, Rotterdam, v. 2, pp. 1361-1369.
Viana da Fonseca, A.; Santos, J.A.; Costa Esteves, E. & Massad, F. (2007) Analysis of piles in residual soil from granite considering residual loads. Soils and Rocks, v. 30:1, p. 63-80.
Viana da Fonseca, A. & Santos, J.A. (2008) International Prediction Event. Behaviour of Bored, CFA and Precast Piles in Residual Soil. ISC'2 Experimental Site. Univer-sity of Porto and Tech. Univ. of Lisbon, Porto and Lis-bon, 699 pp.