Power Quality in Air Force Radar Stations
Hugo Miguel Gomes Marc¸alo Costa
Instituto Superior T ´ecnico
Lisbon, Portugal
[email protected]
Abstract—Power quality continues to be a major con-cern, both for suppliers and consumers. These need the correct operation (and durability) of their electrical and electronic equipment. It is essential for customers who consume a huge amount of power, such as hospitals and the industry for example, to have a continuous and correct performance of their equipment.
The Air Force Radar stations aim at addressing the correct performance of all installed equipment, due to the permanent need to control and supervise the national airspace. Therefore, generator sets and battery banks con-nected to UPS were installed in each of the Radar Stations in order to ensure the correct operation of the whole unit, during a network fault (mainly in the case of voltage sags and power supply interruptions). Currently the expected life time of the battery bank is considerably less than the manufacturer’s expectations.
This study was carried out to monitor the power quality in three Radar Stations, in order to analyse if the problem of batteries would be related to the quality of electric power supplied to the Radar Stations. To this end, a 3-month monitoring was carried out and an analysis was made of the UPS’s functioning if his configuration had been in accor-dance with the tolerance curves of the possible immunity classes of the equipment. Lastly, it was concluded that the results do not confirm the initial theory.
Index Terms—Air Force, electrical energy, Power Quality, monitoring, Radar Stations, voltage dips.
I. INTRODUCTION
E
LECTRICAL energy has become fundamental in human life and as such it is essential in every day life. Without it, it would not be possible to maintain the basic services we rely on a daily basis, such as hospitals and food preservation. As such, it is necessary to have the proper power quality in order to maintain the correct performance of the equipment fed by it, as changes in the power quality can lead to a malfunctioning/outage of electrical and electronic equipment, and eventually to its damage. However, the power quality does not have a static definition. What once used to be the defined standard power quality, today may not hold true. In the past, when most equipment was essentially made of resistors, lack of quality was essentially related to power supply interruptions. Today, with the proliferation of electronic equipment, the quality of the voltage wave is also taken into account. If the characteristics of the voltage wave fall outside the parameters of normal operation, it may lead to a malfunctioning of the equipment or even lead to its damage.Thus, it is increasingly important to analyze the power quality, especially for equipment with greater sensitivity (or
less immunity) installed in critical environments, such as hospitals, for the maintenance of human life, or in the case of the Air Force , to safeguard the sovereignty of national airspace.
The Air Force (AF) has several Bases, among them, there are 4 Radar Stations (ER), located in F´oia, Pac¸os de Ferreira, Montejunto and Pico do Areeiro (on Madeira Island). These Units are essential to the normal functioning of the Air Force because they allow the supervision of all national airspace, and it is essential to assure the uninterrupted supply of electric energy. Furthermore, to ensure this uninterrupted supply it is necessary that the voltage parameters that feed the Unit are adequate for the operation of the most sensitive elements operating at the ER.
In order to ensure the continued operation of the Radar Stations, resource power supplies have been installed, namely generator sets (GS) and UPS (Uninterruptable Power Supply). UPSs provide power supply immediately after an electrical failure (either from the public network or the customer’s network), however, they have limited autonomy. These equip-ments allow to filter the electric power coming from the public network, thus improving the voltage wave form characteristics (harmonic reduction and maintenance of the voltage wave amplitude value, for example).
Generator sets allow for the unit’s energy needs to be suppressed for long periods of time, but their start-up is not instantaneous. As a result, UPSs are used to maintain the continuity of electrical power supply for the most critical loads during a short period of time, while the generator sets start up during a longer fault (the GS begin the start-up process, for power failures of more than 5s).
The autonomy of the UPS is determined by the bank of batteries which, according to the manufacturers, have a useful life time of approximately 5 years. However, in Air Force Radar Stations it has been found that the battery life time has been much shorter than the 5 years indicated by the manufacturers. These defend that it is due to a high request of the batteries, coming from successive entry into service. As such, this dissertation intends to analyze the power quality in Radar Stations, define the causes that lead to the rapid degradation of UPS battery banks and propose measures to mitigate this problem.
II. POWERQUALITY
When it comes to the power quality, it is necessary to define how quality is evaluated. This is assessed in two aspects: the
continuity of service and the characteristics of the voltage wave.
A. Power Quality indicators
In the Quality of Service Procedures Manual (MPQS) the following indicators are defined for continuity of service:
• Energy not supplied, ENF;
• Equivalent interruption time, TIE;
• Momentary Average Interruption Frequency Index, MAIFI;
• System Average Interruption Frequency Index, SAIFI;
• System Average Interruption Duration Index,SAIDI;
• System Average Restoration Index, SARI;
• Equivalent interruption time of the power installed in medium voltage network, TIEPI;
• Unallocated power (medium voltage network), END;
• Interruptions number, NI;
• Total duration of interruptions, DI;
The calculations of the service continuity indicators should always consider all interruptions affecting the supply termi-nals, of their network operator, except those originating from customer installations without affecting others [1].
The NI and DI indicators are individual indicators of continuity of service and should be determined by the network operators in each calendar year and for all the supply terminals of their respective networks.
Nowadays, with the proliferation of electronic components and the use of nonlinear loads the continuity of service is no longer the most worrying aspect regarding the power quality (not only for the susceptibility of the loads but also for a great improvement in relation to the aspect of service continuity) and a greater concern regarding the quality of the voltage wave is observed. This is because non-linear loads are more sensitive to changes in the characteristics of the voltage wave. Moreover, changes made to the mains network (a meshed network was created to improve continuity of service) leading to faults propagation, affecting the whole network, thus leading to the occurrence of voltage sags, amongst other changes in the quality of the voltage wave. In order to ensure good quality of the voltage wave, it is essential to keep the values of the quality indicators within the limits laid down in EN 50160 [2]. The following characteristics for the quality of the voltage wave are defined in the European standard EN 50160 [1]:
• Power Frequency;
• Supply voltage variation;
• Flicker severity;
• Supply voltage Unbalance;
• Harmonic voltage;
• Supply voltage sags/swells. B. Voltage Sags
Voltage sags are a typical phenomenon inherent in the operation of electric power grids, usually occurring following a short circuit or re-connection of a line to the grid. These events have a variable number of causes, dominated by atmospheric factors (weather, wind, rain, lightning, etc.), fires and material
defects, usually including customers’ own facilities. The volt-age sags are maintained in the networks, while the electrical faults that originated it remain in the network, that is, until the elimination of these faults by opening the circuit-breakers, as a result of the performance of the protection systems [1]. The voltage sags are characterized by a sudden decrease in the value of the supply voltage (the voltage amplitude being between 90% and 5% of the declared rated voltage value, Uc)
delivered to client over the network in a short time (between 10 milliseconds and 1 minute) [2]. For a better understanding of this phenomenon, the characterization of a voltage sag can be seen in figure 1.
Fig. 1. Characterization of a voltage sag (extracted from [1]).
In figure 1 the voltage sag is characterized by the depth or amplitude (∆U ) and the duration of the voltage sag (∆T ), so these quantities are used for their classification . The duration of the voltage sag is given by the time elapsed between the instant when the effective value of the voltage of one of the phases becomes lower than 90 % of Uc and the instant that
it returns to be higher to this value in all three phases (plus a hysteresis value, typically 2%). Due to the time required to calculate the effective voltage value, its minimum duration is 10 milliseconds and it is defined with a maximum time of 60 seconds [3]. Regarding the depth of the voltage sags, this is given by the difference between Uc and the residual voltage
(the lowest value of the effective voltage recorded during ∆T ). In order to evaluate voltage sags, the polyphase and time aggregation are performed, in accordance with EN 61000-4-30. The first consist in aggregation in a single voltage sag, characterized by a single duration and a single residual voltage. The second consists in defining an equivalent event in case of multiple successive envents [2]. Polyphase aggregation is performed with the aim of aggregating voltage sags generated by the same event (for example, a defect between two phases can cause a voltage sags simultaneously in two phases, in which case the two voltage sags must be added as one biphasic voltage sag).
In polyphase aggregation, the voltage sags can be classified as:
• Single-phase: when a single phase is affected by the voltage sag;
• Biphasic: when the voltage sags affects two phases si-multaneously;
• Three-phase: when the voltage sags affects all three
phases simultaneously.
In polyphase aggregation, special attention must be paid to evolutionary faults, that is, when voltage sags appear in different phases and initial instants, but due to their duration, they end at the same instant. In this case, the voltage sag must be added polyphasically.
C. Equipment class
The International Electrotechnical Commission (IEC) began in 1992, with the standard IEC 61000-4-1, to establish stan-dards for testing and characterizing the immunity of electrical and electronic equipment to voltage sags, in order to safeguard the durability of the equipment in the occurrence of voltage sags. In 2004, IEC 61000-4-11 ”Testing and measurement techniques voltage dips, short interruptions an voltage vari-ations immunity tests” [4] was published, with the objective of establishing a baseline for testing and classify equipment immunity to voltage sags, short interruptions and voltage variations. Therefore has been created a standard that classifies electrical and electronic equipment into voltage sags immunity classes, providing the methods and procedures to be adopted by the manufacturers of these equipment to test and classify them. As regards voltage sags, the equipment is divided into 4 classes: 1, 2, 3 and X. The duration and residual voltage defining each class are presented in table I, these being test levels of some severity, intending to represent the majority of the voltage sags that occur in the electrical network [4].
Class 1 applies to equipment with little immunity to voltage sags. Equipment with this class of voltage sags immunity is normally equipment that is very sensitive to changes in the supply network and as such must be safeguarded by autonomous power supply systems (such as UPS or flywheels), filters or surge arresters [4].
Class 2 applies to equipment installed in an industrial environment. The compatibility levels are identical to those of public networks [4].
Class 3 is the class in which tests are carried out with voltage sags of greater severity, and therefore the equipment of this class should be more immune to voltage sags. Class 3 equipment should be able to withstand the vast majority of voltage sags that occur in a public network without being damaged or degraded. It is advisable to use class 3 equipment when most loads are fed by converters, there are steel industry in the network, large motors with frequent starting and when loads vary rapidly [4].
The X-Class can be defined by the manufacturer or other entities, therefore it was not defined in IEC 61000-4-11.
In order to create better communication between manufac-turers and users of electrical and electronic equipment for immunity to voltage sags, CIGRE has set up a working group with the aim of improve the understanding of the compatibility between installations and the electricity supply [5]. A working group was then created which published the brochure 412, Voltage Dip Immunity of Equipment and Installations, by
TABLE I
PREFERRED TEST LEVELS AND DURATION FOR VOLTAGE SAGS. ADAPTED FROMIEC 61000-4-11.
class Test level and duration for voltage dips class 1 case-by-case according to the equipment requirements class 2 0% in 10ms 0% in 20ms 70% in 500ms class 3 0% in 10ms 0% in 20ms 40% in 200ms 70% in 500ms 80% in 5000ms class X X X X X X
CIGRE / CIRED / UIE joint working group C4.110 in 2010 [5]. In this brochure where defined 6 typical equipment classes, each associated with a different level of immunity of the equipment to voltage sags, defined by voltage sags tolerance curves represented in a residual voltage graph as a function of the duration of the sags. In the brochure 412 of CIGRE, three types of voltage sags are also defined: type I (single-phase), type II (two-phase) and type III (three-phase) voltage sags, each class containing two curves tolerances: one for type I / II voltage sags and another for type III voltage sags. This makes it simple to analyze the number of voltage sags that can cause the equipment to go out of operation for each class, that is, a voltage sag represented on the graph below the tolerance curve can cause malfunctioning/damage to the equipment, while all voltage sags above the tolerance curve shall be supported by the equipment without its correct performance being affected. Thus, the immunity classes of the voltage sags equipment defined by the CIGRE brochure 412 are [5]:
• class A: defines equipment with the greater immunity to voltage sags, including immunity to short interruptions. Compared to the classes of IEC 61000-4-11, this class presents greater immunity than class 3. In figure ?? are represented the graph with the characteristic tolerance curves of this class for the two large groups: type I/II e type III.
Fig. 2. Voltage Tolerance Curves for equipments of Class A (adapted from [5]).
• class B: defines equipment with immunity to most voltage sags. This class is less immune to voltage sags than Class A but continues to have greater immunity than Class 3 of IEC 61000-4-11. In figure3 are represented the graph
with the characteristic tolerance curves of this class for the two large groups: type I/II e type III.
Fig. 3. Voltage Tolerance Curves for equipments of Class B (adapted from [5]).
• class C1: defines equipment with immunity to voltage sags with residual voltages higher than 40% of Uc for
type I/II and 70% of Ucfor type III. The voltage tolerance
curve of type I/II is based on class 3 from CEI 61000-4-11, while for the type III a new tolerance curve is proposed, with less immunity. In figure 4are represented the graph with the characteristic tolerance curves of this class for the two large groups: type I/II e type III.
Fig. 4. Voltage Tolerance Curves for equipments of Class C1 (adapted from [5]).
• class C2: very similar to class C1, with a slight difference
in the tolerance curve for type I / II voltage sags, to take into account certain nominal voltage levels typical of some countries. This class is based on the requirements for SEMI F47-0706 Type I and II Voltage sags, and for Type III it is equal to the class C1 [5]. In figure 5 are represented the graph with the characteristic tolerance curves of this class for the two large groups: type I/II e type III.
• Class D: defines equipment with a basic immunity level. It is the class with the lowest immunity to voltage sags. In
Fig. 5. Voltage Tolerance Curves for equipments of Class C2 (adapted from [5]).
figure 6 are represented the graph with the characteristic tolerance curves of this class for the two large groups: type I/II e type III.
Fig. 6. Voltage Tolerance Curves for equipments of Class D (adapted from [5]).
• Class E: defines equipment where the level of immunity does not fit into any of the preceding classes, and as such does not have a predefined tolerance curve.
With the use of this classification of equipment by the manufacturers, the customers, when acquiring the equipment, will know the expected behaviour for each type of voltage sags. In this way, they will be able to predict, based on the history of voltage sags in their region, the number of times the equipment can be out of service due to a voltage sags, and with this information can take corrective/preventive measures (such as installing UPS or flywheels for example) [6]. With the prediction of the number of voltage sags that occur in the customer’s area, this should take into account two important aspects in choosing the immunity class of the equipment to voltage sags:
• Equipment price: The more immune the equipment class, the more expensive this will be. Thus, the customer must
always check whether the difference in prices justifies the difference in immunity to voltage sags;
• Price of power supply systems: for equipment with low
immunity to voltage sags the customer must take into account the protection of the equipment through the installation of power supply systems such as flywheels, UPS, among others.
As such, the customer should take into consideration the economically most feasible option between increasing the im-munity of the equipment or improving/installing autonomous power supply systems, in order to safeguard the proper perfor-mance of the equipment in the event of voltage sags. However, customers could chose to accept the costs of possible losses after a electrical fault.
III. POWER QUALITY MONITORING IN AIRFORCERADAR
STATIONS
A. Installations monitored
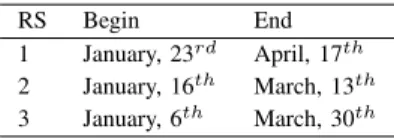
This monitoring was conducted between January and April of 2017, in Continental Portuguese Air Force Radar Stations, located in F´oia, Pac¸os de Ferreira and Montejunto, during the time presented in table II.
TABLE II
MONITORING PERIOD IN EACHRS.
RS Begin End 1 January, 23rd April, 17th 2 January, 16th March, 13th 3 January, 6th March, 30th
In terms of loads the three ERs are quite similar. The major difference between them lies in their location, and as such, in the characteristics of the distribution network that supplies electricity to the ER (rate of faults and topology): the number and type of clients connected to the network, surrounding vegetation, fires and the lightning rate of the region. With the existence of industrial units connected to the distribution network, the possible disturbances increase, namely by the occurrence of voltage sags in the switching of high power equipment. However, the most frequent origin of voltage sags is related to network faults [7].
Air Force Radar Stations are fed directly from the medium voltage distribution network (ER1 and ER2 at 15kV and ER3 at 30kV), in order to obtain a better quality of service (since a higher short-circuit power means a lower amplitude of the voltage sag). As such, at the arrival transformation station there is a medium voltage transformer for low voltage that feeds the low voltage general switchboard (QGBT) and this distributes the electrical energy to the entire ER.
To maintain continuity of power supply to critical loads, all ER are equipped with one UPS and two generator sets (GG). The UPSs, installed in 2003, are from Liebert, with a power of 500 kVA. They come pre-configured at the factory to be operational when the input voltage is 10% lower or higher than the nominal voltage and/or the frequency is 3% lower or higher than 50 Hz, and it is not possible to change these limits.
B. Monitoring Equipment
To carry out the monitoring of the quality of the voltage wave and the continuity of service, three equipments were made available by Labelec LEM MEMOBOX 300. These equipments allow a continuous monitoring of the voltage wave, recording, for the three phases, the average values of the voltage in 10 minute intervals and all the voltage sags and interruptions occurred, providing data such as the amplitude, duration, hour and date of the voltage sags or power interruption.
The MEMOBOX 300 was connected directly in the entry of QGBT, in order to obtain the voltage wave from the dis-tribution network of MV, passing only through a transformer reducer (MT to BT) without being affected by the GG or UPS installed in the ER.
C. Processing of monitoring results
For the presentation of the results obtained in the QCT monitoring, a matlab program was developed in order to treat the collected data of the monitoring equipment. Following is an explanation of how the program developed works.
The MEMOBOX 300 monitoring device creates 3 different files:
• 1 ”.30q” file: This file type is intended to be processed by the CODAM Basic and CODAM Plus programs, allowing the visualization of graphs with information about the voltage characteristics, registered event tables, average value graphs (in intervals of 10 minutes, as defined in the equipment settings) of the voltage, among others.
• 2 Files with extension ”.ASC”: these two files were pro-cessed in the Excel program, and presented different data: one contains the records of the means of 10 minutes of the voltage, while the other one contains the recording of all the events (voltage sags and power supply interruptions). Based on the ”.ASC” file, which contained the information about the events, the data was processed, as it was necessary to separate the events in voltage sags and service interruptions, and separate them by phase. Thus, two matlab programs were developed in order to transpose the information contained in the ”.ASC” file into tables and graphs. The two programs developed are intended for the treatment of data related to voltage sags and the treatment of data related to power supply interruptions. To optimize the program, ”.ASC” files, which contain information about the events, have been manually edited to only contain the data related to an event type (voltage sags or power supply interruptions) and replaced with files ”. csv ”through the use of Excel.
• Program for the processing of voltage sags
The program for the processing of voltage sags starts with reading the ”.csv” file, which contains the following information:
• Date;
• Hour;
• Residual voltage in L1;
• Voltage sag duration in L1;
• Voltage sag duration in L2;
• Residual voltage in L3; • Voltage sag duration in L3.
This data is separated by commas, and as such, when the program reads the file and stores the information in the table format of matlab, the columns are misaligned, because the values of the voltage are represented with two decimal places separated by commas. Thus the second process performed by the program consists of realigning the columns. The following is the format conversion, so that the date, time and duration are elements of the ”datetime” type. Having the table aligned, the program performs the phase separation, thus obtaining 3 tables with the voltage sags, one for each phase. It follows the polyphase aggregation, which through a routine that compares the date and time between the tables, writes in an auxiliary variable the type of voltage sags in a certain position, so that at the end of the routine all positions of the 3 tables are classified as single-phase, two-phase or three-phase. With this classification it is followed the creation of three more tables of voltage sags: single-phase, two-phase and three-phase. Each line of the created table contains information only on one of the phases and as such follows a routine in order to aggregate the phases, thus obtaining a voltage sags for each row of the table, and with the information of the affected phases in a new column. This is the end of the treatment of the tables, followed by the creation of graphs by the program, which will create the graphs related to the monitoring and the analysis of results, namely the graphs of the voltage sags represented according to their date of duration, and finally with the introduction of tolerance curves.
• Program for processing power supply interruptions The program for processing power supply interruptions is smaller than the previous one, due to the difference between the presented data, because in this case there is no information about the voltage value (in an interrupt this value is less than 5%), and as such there is no column misalignment, as was the case with the voltage sags. Thus the program begins by reading the information from the ”.csv” file, which contains the following information:
• Date;
• Hour;
• Duration in L1;
• Duration in L2;
• Duration in L3.
After the program reads the data, it makes changes relative to the data types used by matlab in order to facilitate the representation of the table. The program ends with the creation of the power interruption table, ordered by date of occurrence of the power interruption.
With the two programs described above, we performed the same for each of the ER, presenting the tables and graphs obtained in the following section.
D. Monitoring data collected
At Radar Station No. 1 in F´oia, QCT monitoring began on January, 23rd and ended on April, 17th of 2017. Although the period established for monitoring had been continuous for
3 months, this was not possible due to problems technicians with the equipment that, after collecting data made on April, 17th, presented errors in the data transfer.
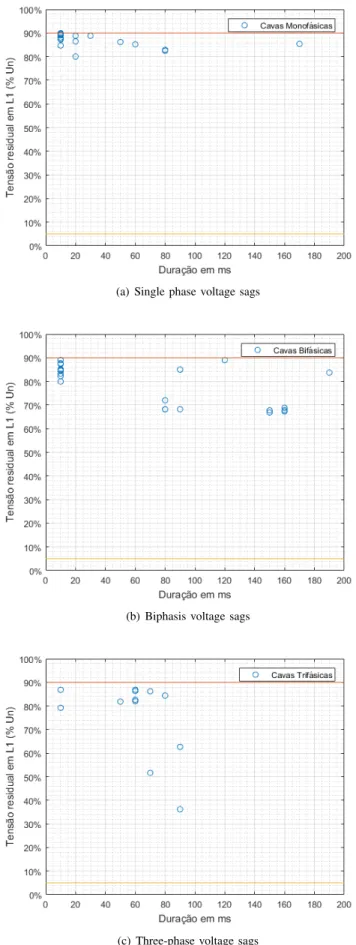
After analize voltage dips in each phase, it was verified that all the voltage sags had short durantion, in the order of miliseconds, the less afected phase was L1, with 23 events, and the most afected phase was L3 with 30 events. With all this events was conducted polyphasic aggregates, resulting the data represented in figur 7, were the events are presented with residual voltage dip vs durantion.
Regarding the continuity of service, at ER1 there were no interruptions in the power supply during the monitoring period. At Radar Station No. 2 in Pac¸os de Ferreira, monitoring began on January 16, 2017 and ended on March 13, 2017. Although the period established for monitoring had been continuous for 3 months, this was not possible due to to technical problems with equipment that, after collecting data made on March 13, presented errors in the transfer of records. In the data collection, due to technical incompatibilities, it was not possible at this site to collect data with the installed equipment, having been uninstalled from the network and connected to the computer to perform data extraction. As such, it was necessary to process the data in order to eliminate occurrences caused by the weekly data collection procedure. This procedure led to the fact that between February 27 and March 6, due to errors in the assembly of the equipment after data collection, the QCT monitoring data had not been recorded.
After analize voltage dips in each phase, it was verified that all the voltage sags had short durantion, in the order of miliseconds, the less afected phase was L1, with 23 events, and the most afected phase was L3 with 30 events. With all this events was conducted polyphasic aggregates, resulting the data represented in figures ?? e 8, were the events are presented with residual voltage dip vs date and vs durantion, respectively. As far as the continuity of service is concerned, there were no interruptions in the power supply during the monitoring period at ER2.
At Radar Station No. 3 in Montejunto, QCT monitoring began on January 6, 2017 and ended on March 30, 2017, for a period of approximately 3 months. In the data collection, due to technical incompatibilities, it was not possible at this site to collect data with the installed equipment, having been uninstalled from the network and connected to the computer to perform data extraction. As such it was necessary to process the data in order to eliminate occurrences caused by the weekly data collection procedure.
After analize voltage dips in each phase, it was verified that all the voltage sags had short durantion, in the order of miliseconds, the less afected phase was L3, with 6 events, and the most afected phase was L2 with 14 events. With all this events was conducted polyphasic aggregates, resulting the data represented in figures ?? and 9, were the events are presented with residual voltage dip vs date and vs durantion, respectively. As for the continuity of service in the radar station no3 there
were interruptions in the supply of electric power, presenting in the table III the records of the interruptions, which 2 where long interruptions (longer than 3 minutes).
(a) Single phase voltage sags
(b) Biphasic voltage sags
(c) Three-phase voltage sags
Fig. 7. Voltage sags in ER1, between January 25 and April 17, 2017. Its characterization by residual tension / duration, after polyphase aggregation.
(a) Single phase voltage sags
(b) Biphasis voltage sags
(c) Three-phase voltage sags
Fig. 8. Voltage sags in ER2, between January 16 and March 13, 2017. Its characterization by residual tension / duration, after polyphase aggregation.
(a) Single phase voltage sags
(b) Biphasic voltage sags
(c) Three-phase voltage sags
Fig. 9. Voltage sags in ER3, between 6 January and 30 March of 2017. Its characterization by residual tension / duration, after polyphase aggregation.
TABLE III
RECORD OF SERVICE INTERRUPTIONS IN THEER3
Data Duration L1 Duration L2 Duration L3 09-01-2017 13:50:54.980 00:00:00.001 00:00:00.001 00:00:00.001 10-01-2017 10:58:04.110 00:01:24.890 00:01:25.960 00:01:27.110 10-01-2017 10:59:29.400 00:03:12.600 00:03:12.600 00:03:12.600 10-01-2017 11:02:42.600 00:00:01.390 00:00:01.390 00:00:01.380 14-01-2017 08:42:27.360 00:00:00.720 00:00:00.670 00:00:00.410 07-02-2017 09:53:39.000 00:00:00.001 00:00:00.001 00:00:00.001 13-02-2017 15:42:57.320 00:00:00.410 00:00:00.680 00:00:00.680 21-02-2017 10:02:03.430 00:00:00.001 00:00:00.001 00:00:00.001 21-02-2017 11:55:21.760 00:00:05.240 00:00:05.240 00:00:05.240 08-03-2017 18:25:24.340 00:00:00.001 00:00:00.001 00:00:00.001 08-03-2017 18:26:07.200 17:02:04.800 17:02:04.800 17:02:04.800 16-03-2017 08:13:40.230 00:00:02.770 00:00:02.760 00:00:02.760 16-03-2017 09:20:27.470 00:00:08.530 00:00:08.530 00:00:08.540 29-03-2017 10:44:04.890 00:00:00.001 00:00:00.001 00:00:00.001 29-03-2017 10:46:08.460 00:00:04.540 00:00:04.540 00:00:04.540
IV. RESULTS ANALISYS
In order to conclude about the functioning of the UPS was tried to compare the UPS alarms with the monitoring data. Although it was not possible due to the lack of memory to save every alarm in that period. So other monitoring was made, between August, 22th and September,20th, to compare with
the error message from the UPS. However, due to some errors in the MEMOBOX 300, only from August, 22th to 28th it was possible to collect the data from MEMOBOX 300. The polyphasic aggregated voltage sags, after being processed by the matlab program developed, is present in tables VI, V and IV. The UPS registered errors are present in table VII and have the following description:
• 10- Bypass absent;
• 12- Bypass undervoltage;
• 14- Bypass phase rotation error;
• 16- Bypass off;
• 22- rectifier block;
• 35- inversor unsynchronized;
• 52- battery on load.
This error codes are normally associated to supply cuts in UPS entry, either by voltage sags, service failure or manual intervention (for example to maintenance).
After comparison between data from MEMOBOX 300 and from UPS errors, it was verified that UPS only worked for voltage sags longer than 200ms and with an residual voltage below 50V (25%).In figure 10 are represented the voltage sags registered in during this monitoring, where the green ones did made the UPS work and the red ones take the UPS work.
TABLE IV
THREE-PHASE VOLTAGE SAGS OCCURRING INER3,FROM22TO28 AUGUST2017.
Date and hour Voltage Duration [ms] phase [v] %
28-08-2017 02:15:19.540 203,03 88,27 40 U1U2U3 28-08-2017 06:49:49.750 202,71 88,13 30 U1U2U3
TABLE V
BIPHASIC VOLTAGE SAGS OCCURRING INER3,FROM22TO28 AUGUST2017
Date and hour Voltage Duration [ms] phase [v] % 24-08-2017 08:58:44.480 194,87 84,73 10 U1U3 24-08-2017 08:58:44.500 191,42 83,23 10 U1U3 27-08-2017 19:58:06.340 46,31 20,13 260 U1U2 28-08-2017 06:49:03.740 203,65 88,54 20 U2U1 28-08-2017 13:39:50.810 45,90 19,96 310 U2U3 28-08-2017 14:52:32.510 187,45 81,50 70 U1U3 TABLE VI
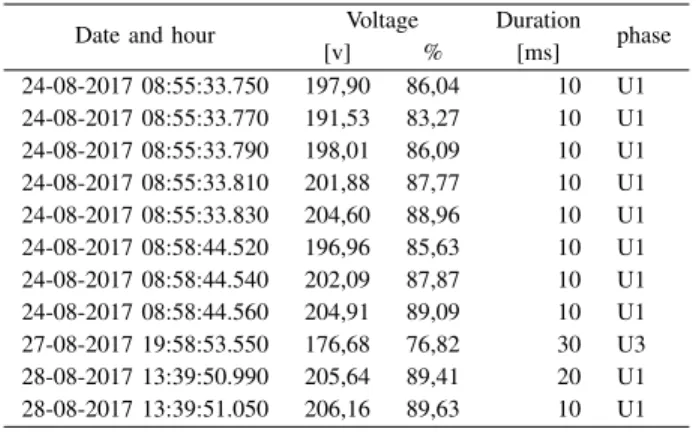
SINGLE PHASE VOLTAGE SAGS OCCURRING INER3,FROM22TO28 AUGUST2017
Date and hour Voltage Duration [ms] phase [v] % 24-08-2017 08:55:33.750 197,90 86,04 10 U1 24-08-2017 08:55:33.770 191,53 83,27 10 U1 24-08-2017 08:55:33.790 198,01 86,09 10 U1 24-08-2017 08:55:33.810 201,88 87,77 10 U1 24-08-2017 08:55:33.830 204,60 88,96 10 U1 24-08-2017 08:58:44.520 196,96 85,63 10 U1 24-08-2017 08:58:44.540 202,09 87,87 10 U1 24-08-2017 08:58:44.560 204,91 89,09 10 U1 27-08-2017 19:58:53.550 176,68 76,82 30 U3 28-08-2017 13:39:50.990 205,64 89,41 20 U1 28-08-2017 13:39:51.050 206,16 89,63 10 U1 TABLE VII
ER3 UPS ALARMLOGS, AUGUST22-28OF2017.
Data Entrada Saida C´odigo 27/08/2017 22:32 22:32 22 27/08/2017 22:32 22:32 14 27/08/2017 22:32 22:32 16 27/08/2017 22:32 22:33 10 27/08/2017 22:32 22:34 52 27/08/2017 22:33 22:33 35 27/08/2017 22:33 22:33 35 27/08/2017 22:33 22:33 22 27/08/2017 22:33 22:33 10 27/08/2017 22:33 22:33 12 27/08/2017 22:33 22:33 16 27/08/2017 22:33 22:33 35 27/08/2017 22:33 22:33 35 28/08/2017 16:14 16:14 22 28/08/2017 16:14 16:15 52
A. Voltage tolerance curves analysis
In the ER1 and ER2 there are frequently voltage sags, totalling a total of 51 and 58 voltage sags, respectively. In ER3 the main problem is service interruptions, with 18 voltage sags and 15 power failures registered. Regarding the UPS functioning, about power supply interruptions can not be done because a power failure causes the UPS to act in order to safeguard the correct performance of all the equipment installed in the ER. However, it is possible to decrease the number of inputs in service of the UPS in relation to the
Fig. 10. Voltage sags registered in ER3 between August 22 and 29, 2017. Their characterization by residual voltage / duration, after polyphase aggregation.
voltage sags, by adjusting the UPS according to the tolerance curve of the equipment with lesser immunity to voltage sags [5].
Since it was not possible to obtain the tolerance curves of the equipment installed in the ER, due to the high degree of confidentiality related to the information about the equipment installed in the ER, an analysis was elaborated based on all equipment tolerance curves described in II, yielding the number of voltage sags that would request the UPS in case of be set for the respective class tolerance. For such, figures 7, 8 e 9 were overlaid with the tolerance curves of each class, originating the tables VIII, IX and X where the number of requests to the UPSs, if these were configured for each of the above classes, and the number of voltage sags registered in ER1, ER2 and ER3, respectively, are presented.
TABLE VIII
NUMBER OF REQUESTS TOUPSFOR THE VARIOUS CLASSES OF EQUIPMENT,FOR A TOTAL OF51VOLTAGE SAGS REGISTERED IN THE
ER1.
Class Noof UPS requests
A 0 B 1 C1 4 C2 4 D 12 TABLE IX
NUMBER OF REQUESTS TOUPSFOR THE VARIOUS CLASSES OF EQUIPMENT,FOR A TOTAL OF58VOLTAGE SAGS REGISTERED IN THE
ER2.
Class Noof UPS requests
A 0
B 0
C1 3
C2 3
TABLE X
NUMBER OF REQUESTS TOUPSFOR THE VARIOUS CLASSES OF EQUIPMENT,FOR A TOTAL OF18VOLTAGE SAGS REGISTERED IN THE
ER3.
Class Noof UPS requests
A 0
B 0
C1 0
C2 0
D 0
After analysing the tables VIII, IX and X, it’s noted that the number of requests to UPS would decrease drastically with the regulation of this to one of the tolerance classes defined by the working group C4.110 from CIGRE, ”Voltage Dip Immunity of Equipment and Installations” [5]. However, this regulation does not prove advantageous in the short term because it presupposes two conditions that are not satisfied, or it was not possible to guarantee, at the moment:
• Immunity to voltage sags: it would be necessary for all the equipment installed in the ER to withstand, without disturbing its normal operation or aggravated wear, the voltage sags of the defined class.
• UPS regulation capability: UPS are required to be able to regulate the voltage limits for the equipment with the lowest immunity installed in the ER (Class A equipment with the highest immunity and Class D equipment with the lowest immunity).
The conditions described above do not exist because the UPS installed in the ER is old (about 15 years old) and does not allow the regulation of the voltage limits. In addition to this inability of the UPS, the numerous equipment and equipment systems installed in the ERs are old and there is no knowledge of their class of immunity to voltage sags, there are even some where manufacturers have not defined their immunity to voltage sags .
V. CONCLUSION
Air Force Radar Stations play a key role in the surveillance of national airspace, and as such, its continuous and correct performance is essential. For this it is necessary that the electrical energy that feeds the ER is compliant. Although there are autonomous power systems that allow the normal operation of all the equipment installed in the ER when power supply interruptions or voltage sags occur (among other changes in the quality of the wave of voltage). Thus, it was intended with this work to analyse the power quality supplied to the ER and it was concluded that it is within the Units normal operations, having registered mainly voltage sags with With this conclusion, it was tried to compare the UPS functioning with the voltage sags registered by the monitoring equipment, but without success since at that time it was only possible to obtain a generalized UPS alarm register without being able to correlate with the voltage sags because of the limited memory of the UPS in storing the detailed records
small amplitudes (residual voltage close to 90% of reference voltage) and small durations (below 200 ms).
of alarms issued. In order to achieve this objective, a new monitoring was carried out with the registration of the alarms issued by UPS, which resulted in a week of registrations, and it was verified that for voltage sags of low amplitude and duration the UPS was not put into service.
Finally, and in a practical scope, the analysis of UPS functioning was carried out for different adjustments of its parameters, taking into account the immunity curves defined in CIGRE brochure 412 [5]. A total of 12 UPS inputs were then obtained for ER1 and ER2 for a regulation corresponding to the class of equipment with lower immunity (class D), at 51 and 58, respectively, voltage sags recorded. With a regulation corresponding to the class of equipment with greater immunity (class A) it would not be expected the UPS functioning. In ER3 in any of the classes would not be expectable the UPS functioning. However, it is to safeguard that class A equipment has a much higher cost than Class D equipment, and it is always necessary to carry out a cost-benefit study between equipment with greater immunity and autonomous power systems.
The results presented do not indicate that the short life of the battery bank is due to a poor power quality supplied to the RS, once it only was registered low amplitude and short duration voltage dips. Majority of the voltage dips had 10ms duration and residual voltage between 80% and 90% of reference voltage.
Regarding the objectives initially established for this work, it was concluded that the main objective was successfully achieved, having analysed the power quality, proving that it hadn’t significant voltage dips. Regarding the secondary objective, nothing can be concluded for not having been authorized the analysis of the equipment installed at Radar Stations because of its high degree of confidentiality.
REFERENCES
[1] “Regulamento de Qualidade de Servic¸o do Se-tor El´etrico, Regulamento n.o 6/2013,” Entidade
Regu-ladora dos Servic¸os Energ´eticos, no. No 232, 2013.
[Online]. Available: http://www.erse.pt/pt/electricidade/regulamentos/ qualidadedeservico/Documents/DR{ }Regulamento455-2013-RQS.pdf [2] “Voltage characteristics of electricity supplied by public electricity
net-works, EN 50160,” CENELEC, 2010.
[3] A. Dos Santos and M. T. C. De Barros, “Voltage sags tolerance and responsibility curves,” 2015 IEEE Eindhoven PowerTech, PowerTech 2015, DOI 10.1109/PTC.2015.7232241, no. 2, 2015.
[4] “Testing and measurement techniques - Voltage dips, short interruptions and voltage variations immunity tests,” vol. IEC 61000-4-11, 2004. [5] CIGRE/CIRED/UIE Joint Working Group C4.110,
“Volt-age Dip Immunity of Equipment and Installa-tions,” CIGRE Publications, no. April, 2010. [On-line]. Available: http://www.uie.org/sites/default/files/generated/files/ pages/CIGRETB412voltagedipimmunityofequipmentandinstallations.pdf [6] A. Q. dos Santos, “Stochastic Prediction of Voltage Sags Amplitude
and Duration in Transmission Networks,” PhD Thesis, Instituto Superior T´ecnico, 2015.
![Fig. 1. Characterization of a voltage sag (extracted from [1]).](https://thumb-eu.123doks.com/thumbv2/123dok_br/15873722.1088360/2.918.480.815.329.558/fig-characterization-voltage-sag-extracted.webp)
![Fig. 2. Voltage Tolerance Curves for equipments of Class A (adapted from [5]).](https://thumb-eu.123doks.com/thumbv2/123dok_br/15873722.1088360/3.918.490.798.661.989/fig-voltage-tolerance-curves-equipments-class-adapted.webp)