Master Degree in Medicine
Clinical correlates and prognostic impact of
right ventriculo-arterial coupling in patients
with heart failure undergoing cardiac
resynchronization therapy
Bruno Miguel Martins BragançaM
2018Artigo de Investigação Médica
Mestrado Integrado em Medicina – ICBAS-UP
Clinical correlates and prognostic impact of
right ventriculo-arterial coupling in patients with heart failure undergoing cardiac resynchronization therapy
Bruno Miguel Martins Bragança
Aluno: Bruno Miguel Martins Bragança
Orientador: Professor Doutor Mário Silva Santos
t\
Dalu.t
Lthàlfi
Agradecimentos
É com enorme satisfação que agradeço ao excelentíssimo Professor Doutor Mário Santos, pelo enorme incentivo ao desenvolvimento deste trabalho, e também por todo o conhecimento que me transmitiu durante esta importante etapa. A sua harmoniosa e bem-sucedida conciliação entre o exercício da Medicina e o progresso científico é sem dúvida um exemplo para mim, e que irei levar com toda a certeza para o meu futuro.
Estendo os meus agradecimentos à Drª Maria Trêpa. Agradeço por todos os conhecimentos que oportunamente me soube transmitir e também pela sua enorme ajuda na elaboração e concretização do presente trabalho. A sua simpatia e a sua sempre presente disponibilidade simplificaram o que inicialmente se antevia árduo e laborioso.
Não menos importante, um agradecimento a toda a minha família, em especial aos meus pais e à Salomé por todo o apoio e dedicação, fulcrais para a concretização de mais uma nova etapa da minha vida.
Finalmente, um agradecimento especial a todos os meus amigos que sempre me acompanharam nesta longa jornada.
Resumo
Introdução: A terapia de ressincronização cardíaca (CRT) é um pilar no tratamento de pacientes com insuficiência cardíaca (HF). Não obstante, a taxa de não resposta pode alcançar os 30% em algumas coortes. A HF com frequência complica com o desenvolvimento de hipertensão pulmonar (PH) e disfunção do ventrículo direito (RV). Índices de função do RV e do seu acoplamento à artéria pulmonar (acoplamento RV-PA), nomeadamente o rácio entre a excursão sistólica do plano do anel tricúspide (TAPSE) e a pressão sistólica da artéria pulmonar (PASP), ambos obtidos ecocardiograficamente, tem sido proposto como marcador prognóstico na HF. Assim, os objetivos deste trabalho foram explorar as correlações clínicas e o valor prognóstico do acoplamento RV-PA em pacientes submetidos a CRT.
Métodos: Num estudo unicêntrico, uma população inicial de 207 pacientes com HF submetidos a CRT foram rastreados retrospetivamente, tendo em conta as suas variáveis demográficas, clínicas, bioquímicas, ecocardiográficas, e seus resultados face a esta terapia. A mortalidade por todas as causas foi considerada como resultado primário, enquanto a melhoria clínica e ecocardiográfica, 6 a 12 meses após CRT, foram consideradas resultados secundários.
Resultados: Da população inicialmente rastreada, 69 pacientes apresentavam valores TAPSE e PASP. O período médio de seguimento foi de 42,2 meses; a mortalidade a um e a cinco anos foi de 99,3% e 64,8%, respetivamente. A sobrevida foi significativamente inferior em pacientes com PH (sobrevida a cinco anos de 57.9% vs 71,3% para os pacientes sem PH). Os pacientes apresentaram uma fração de ejeção ventricular esquerda reduzida (LVEF) (26±7%); e 76,8% deles encontravam-se em classe III da escala New York Heart Association (NYHA). A CRT melhorou a LVEF (D ≥ 5%) e a NYHA (D ≥ 1) em 69,6% e 46,1% dos pacientes, respetivamente. De acordo com os tercis de TAPSE/PASP, não foram encontradas diferenças significativas entre as variáveis demográficas, clínicas, bem como na medicação de base. Os pacientes “não respondedores” à CRT tendencialmente apresentaram menores rácios TAPSE/PASP. A LVEF foi significativamente inferior em pacientes com rácios inferiores de TAPSE/PASP. Alterações estruturais do RV e do ventrículo esquerdo (LV) foram significativamente associadas com este rácio. Ao contrário da TAPSE e da TAPSE/PASP, a PASP demonstrou estar significativamente relacionada com o resultado primário, mesmo após ajuste multivariável [relação de risco (HR) de 1.019; intervalo de confiaça a 95% (CI) 0.994– 1.045; p=0,025]. Valores elevados de PASP e baixos de TAPSE/PASP encontraram-se significativamente associados a menores a melhorias da LVEF. A TAPSE/PASP correlacionou-se negativamente com os níveis plasmáticos de NT-proBNP e com o rácio da velocidade diastólica (E) do fluxo mitral e a velocidade diastólica (e’) do anel mitral (E/e’).
A TAPSE/PASP demonstrou melhor valor prognóstico em pacientes que não melhoraram a sua LVEF após a CRT (76,2% de sensibilidade e 70,8% de especificidade), comparativamente com a medição isolada da PASP ou TAPSE.
Conclusões: O rácio TAPSE/PASP correlacionou-se com marcadores de prognóstico validados na HF, tais como o NT-proBNP, a LVEF e o rácio E/e’. Este novo índice ecocardiográfico superou a TAPSE, como medida isolada, na identificação de pacientes que não responderam à CRT.
Palavras-chave
Terapia de Ressincronização Cardíaca; Insuficiência Cardíaca; Circulação Pulmonar; Ventrículo Direito
Abstract
Introduction: Cardiac resynchronization therapy (CRT) is a mainstay treatment of heart failure (HF) patients. However, its nonresponse rate goes up to 30% in some cohorts. HF often complicates with pulmonary hypertension (PH) and right ventricle (RV) dysfunction. Indexes of RV function and its coupling to pulmonary artery (RV-PA coupling), namely the ratio between echo-derived tricuspid annular plane systolic excursion (TAPSE) and pulmonary artery systolic pressure (PASP) has been proposed as a prognostic marker of HF. We aim to explore the clinical correlates and prognostic value of RV-PA in patients with HF undergoing CRT.
Methods: We screened retrospectively an initial population of 207 patients with HF undergoing CRT, regarding demographic, clinical, biochemical, echocardiographic and outcome data. The primary outcome was all-cause mortality; secondary outcomes were improvement of clinical and echocardiographic markers after 6 to 12-months of CRT.
Results: Of the initial population screened, TAPSE and PASP variables were available in 69 patients. The average follow-up period were 42,2 months; one and five-year survival was 99.3% and 64.8%, respectively. Survival was significantly lower in patients with PH (five-year survival 57.9% vs 71.3% without PH). Patients had reduced left ventricular ejection fraction (LVEF) (26.4±7.1%); and 76,8% of patients were in New York Heart Association (NYHA) class III. CRT improved LVEF (D ≥ 5%) and NYHA (D ≥ 1) in 69,6% and 46,1% of patients, respectively. According TAPSE/PASP tertiles, no significant differences were found among demographic, clinical, and medication variables. Nonresponders to CRT trended to have lower TAPSE/PASP. LVEF was significantly lower in patients with lower TAPSE/PASP. Structural changes of both RV and LV chambers were also significantly associated with this ratio. PASP, but not TAPSE and TAPSE/PASP, were significantly related with primary outcome, even after multivariable adjustment [hazard ratio (HR) 1.019; 95% confidence interval (CI) 0.994–1.045; p=0,025]. Higher PASP or lower TAPSE/PASP ratio were significantly associated in LVEF improvement ≥ 5%. TAPSE/PASP was negatively correlated with plasmatic NT-proBNP levels and ratio between early ventricular wave filing (E) and early myocardial velocity (E’) (E/e’). TAPSE/PASP had better accuracy (76.2% sensitivity and 70.8% specificity) than single measurement of PASP or TAPSE in predicting patients with unimproved LVEF after CRT.
Conclusions: TAPSE/PASP ratio did correlate with validated prognostic markers in HF such as NT-proBNP, LVEF and E/e’. This new echo-derived index outperformed isolated TAPSE in identifying patients who did not respond to CRT.
Keywords
Cardiac Resynchronization Therapy; Heart Failure; Pulmonary Circulation; Right Ventricle
List of abbreviations
BMI Body mass index
COPD Chronic Obstructive Pulmonary Disease
CRT Cardiac Resynchronization Therapy
CRT-D Cardiac Resynchronization Therapy Defibrillator
E/e' Early ventricular wave filing (E) and early myocardial velocity (e’) ratio
GFR Glomerular Filtration Rate
HF Heart Failure
LA Left Atria
LHD Left Heart Disease
LV Left Ventricle
LVEF Left Ventricular Ejection Fraction
NS non significat
NT-proBNP N-Terminal pro B-type Natriuretic Peptide
NYHA New York Heart Association
PA Pulmonary Artery
PASP Pulmonary Artery Systolic Pressure
PH Pulmonary Hypertension
PVR Pulmonary Vascular Resistance
RAP Right Atrial Pressure
ROC Receiver Operating Characteristic
RV Right Ventricle
RVEDA Right Ventricle End-Diastolic Area
RVESA Right Ventricle End-Systolic Area
S' Tricuspid annular systolic velocity
TAPSE Tricuspid Annular Plane Systolic Excursion
TRV Tricuspid Regurgitant Velocity
Index Introduction ... 1 Methods ... 2 Results ... 3 Discussion ... 5 Conclusion ... 8 Study limitations... 8 Appendix... 10 References ... 16
List of tables
Table 1 – Clinical features of the studied population according to TAPSE/PASP tertiles 10 Table 2 - Echocardiographic characteristics of the studied population according to
TAPSE/PASP tertiles ... 11
Table 3 – Survival analysis for echocardiographic variables ... 11 Table 4 – Hazard rations for secondary outcomes ... 14
List of figures
Figure 1 - Pearson’s correlation analysis between TAPSE/PASP and log-transformed
NT-proBNP before CRT. ... 11
Figure 2 - Survival curves according to PASP, TAPSE and TAPSE/PASP ratio for primary
outcome all-cause of death. ... 12
Figure 3 - Percentage of patients with improved LVEF response by PASP, TAPSE and
TAPSE/PASP (categorized by median) 6 to 12 months after CRT. ... 12
Figure 4 - Mortality rate by PASP, TAPSE and TAPSE/PASP (categorized by median) 6
to 12 months after CRT. ... 13
Figure 5 - ROC curves for TAPSE, PASP and TAPSE/PASP to identify unimproved LVEF
(defined as LVEF < 5%) after CRT. ... 13
Figure 6 - Survival curves according to absence or presence of pulmonary hypertension
(PH) for primary outcome of all-cause death in all patients. ... 14
Figure 7- Survival curves according to absence or presence of pulmonary hypertension
(PH) for primary outcome of all-cause death in patients with glomerular filtration rate (GFR) equal or higher, or lower than 60mL/min/1.73m2. ... 15
Introduction
Heart failure (HF) is a clinical syndrome characterized by structural and functional changes in ventricular filling and blood ejection(1). Cardiac resynchronization therapy (CRT)
is an effective treatment to symptomatic HF patients under optimized pharmacological therapy(2, 3). CRT response is sensitive to the nature of comorbid illness and also to patients’
medication(4). Unfortunately, up to one third of patients with advanced HF show little or no
response to CRT(3, 5). Several studies had demonstrated that response to CRT is predicted
by baseline right ventricle (RV) function(6, 7). However, post-hoc analyses of large
randomized control trials have challenged this concept(8). The need to better identify the
subset of patients who will respond to this effective, yet invasive and expensive treatment, is currently unmet.
In patients with chronic left ventricle (LV) dysfunction, continuous backward transmission of left-side filling pressures to pulmonary circulation eventually leads to
pulmonary hypertension (PH)(9). PH due to left-side heart disease (PH-LHD) represents the
most common cause of PH(10). PH-LHD continuum begins with an increase in post-capillary
lung circulation pressure secondary to either LV diastolic/systolic dysfunction or valvular disease. By mechanisms still not fully understood, the pulmonary venous chronic hypertension promotes maladaptive structural changes in lung vessels that further overload RV(9, 11). Regardless of the underlying mechanisms, the presence of PH independently
signals worse prognosis(12). Likewise, RV dysfunction is an independent prognostic marker
in HF(13). However, the RV is very sensitive to afterload, and the way we assess RV function
in clinical practice reflect both RV contractility and PH (a determinant of RV afterload). Recently, some studies on HF patients suggested that combining measures of PH severity and RV function might better capture the RV-pulmonary artery (RV-PA) coupling than the isolated measures(14). The ratio between tricuspid annular plane systolic excursion (TAPSE)
and pulmonary artery systolic pressure (PASP), or TAPSE/PASP, is an indirect estimate of
RV-PA coupling but presents strong relation with more accurate invasive measures(15). As
HF sets this ratio declines, along with a progressive loss of RV efficiency in its pumping
function until becomes uncoupled from pulmonary circulation(15, 16). Nonetheless,
uncoupling of RV-PA during HF progression is not so linear, and some patients can present moderate to severe PH without major RV dysfunction(17). The clinical meaning of these new
Therefore, we aimed to describe the clinical correlates of RV-PA coupling of HF patients undergoing CRT and examine its predictive ability regarding response to CRT and all-cause mortality.
Methods
A retrospective, single-center, study was conducted in 207 patients with HF submitted to CRT between 2012-2017 at Hospital Santo António/Centro Hospitalar do Porto. The study was approved by the Research Ethics Committee of Hospital Santo António/Centro Hospitalar do Porto (reference number: 2018.055[051-DEFI/051-CES]).
Patient demographic, clinical and echocardiographic data before and after CRT were collected by chart review. Patient population was analyzed with respect to age, sex, etiology of HF (ischemic vs non-ischemic) and comorbidities (diabetes, hypertension, chronic obstructive pulmonary disease [COPD], smoke, stroke, atrial fibrillation). Ischemic heart disease was diagnosed on the basis of previous myocardial infarction or significant coronary artery disease assessed by coronary arteriography.
All patients were on optimized medical therapy for their HF according to current therapeutic guidelines(1). Patients enrolled in this study met standard criteria for CRT
implantation(1). A 6 to 12-month period following CRT implantation were used to assess
clinical and echocardiographic impact of this therapy. Biochemical analyses (serum creatinine, blood hemoglobin concentration, N-terminal pro hormone b-type natriuretic peptide [NT-proBNP]) were made at the hospital laboratory with standard methods.
Glomerular filtration rate (GFR) was derivate from “CKD-EPI” equation(18) using the most
recent value of serum creatinine before CRT implantation.
Transthoracic echocardiography was performed by certified sonographers, using a commercial equipment (Phillips IE33 and CX50), according to current international recommendations (19). Left ventricular ejection fraction (LVEF) was calculated using the
biplane Simpson method. The presence of PH was evaluated estimating PASP derived by right atrial pressure (RAP) and tricuspid regurgitant velocity (TRV) as follows: RAP +
4(TRV)2 (20). We assumed RAP based on inferior vena cava measurements: normal
respiratory variability and diameter>22mm, 3mmHg; impaired variability or diameter > 22mm, 8 mmHg; impaired variability and diameter > 22mm, 15mmHg. PH was considered present when PASP was > 40 mmHg by echocardiography(21). Ratio between early
ventricular wave filing (E) and early myocardial velocity (e’) was used to evaluate diastolic function. The ratio between TRV and right ventricular outflow tract time-velocity integral (TVIRVOT) was used as marker of pulmonary vascular resistance (PVR)(22). The right ventricle
and pulmonary circulation function were assessed by measuring TAPSE and PASP. Complete baseline and 6 to 12-month follow-up after CRT with echocardiographic evaluation of both TAPSE and PASP measures were available in 69 of the initial 207 patients.
Continuous variables are shown as the mean ± standard deviation. Categorical variables are expressed as percentage of patients (%). The primary outcome was all-cause mortality. Cox proportional hazards model were used to assess the impact of baseline PASP on all-cause mortality. Cumulative survival was calculated using Kaplan-Meier model and compared between PASP, TAPSE and TAPSE/PASP tertiles. The end-point of survival analysis was all-cause death. Logistic regression was used to study secondary outcomes, namely improvement of New York Heart Association (D NYHA≥1) functional class and increase of LVEF (D LVEF≥5%) at 6 to 12 month following CRT implantation. Cox proportional hazards models or logistic regression were performed in both univariate and multivariate to assess the unadjusted and adjusted association of clinical and echocardiography features with age, sex and log (NT-proBNP). Coefficient of Pearson was used for correlations performed between PASP vs log(NT-proBNP) before CRT. Survival analyses were performed using Kaplan-Meier method and the log-rank test integrated in an Excel® based program(23). Receiver operator characteristic (ROC) curves were plotted for
RV-PA variables TAPSE, PASP and TAPSE/PASP ratio, to determine area under the curve, specificity and sensitivity of the optimal cut-offs.
Differences between groups were tested by using the chi-square test and two-way
ANOVA, unless otherwise specified. All analyses were performed using STATA Statistical Software, (StataCorp, Texas, USA; version 15 for macOS). Data were plotted and graphed using GraphPad Prism (GraphPad Software, La Jolla California USA, 7.0a for macOS). A p value < 0.05 was considered statistically significant.
Results
Demographic and clinical characteristics of the 69 patients with available TAPSE/PASP (33.3 % of the initial population included in the study) are showed in table 1, according to TAPSE/PASP tertiles. Estimation of PASP was feasible in 119 patients (57 %) and TAPSE in 97 patients (47 %). Overall, patients had a mean age of 70±10 years, 70% were male, without any significant demographic differences between TAPSE/PASP tertiles.
dyslipidemia, 37.6% smoking history, 56.5% atrial fibrillation, 20.3% COPD and 10.1% stroke were found in this cohort. Among clinical characteristics studied, there were no significant differences between TAPSE/PASP subgroups. About half of patients (50.7%) had non-ischemic cardiomyopathy. Mostly patients submitted to CRT were in NYHA III class (76.8%), with left bundle block (79.3%) and mean GFR of 61.2±23.9 mL/min/1.73m2.
Average QRS duration was 163±27 ms. All patients were under optimized medical therapy for HF, with no significant differences in medication between all subgroups. The majority of patients showed improvement of LVEF (69.6%), and 46.1% of them showed functional improvement (NYHA) with CRT. Lower TAPSE/PASP ratios were related with lower improvement of LVEF and a trended for NYHA improvement (table 1); NT-proBNP levels were negatively correlated with TAPSE/PASP (figure 1). Across TAPSE/PASP tertiles there was a significant change of hemoglobin levels (table 1).
Baseline echocardiographic evaluation before CRT
(table 2) showed that all patients enrolled in this study presented HF with reduced LVEF, with an overall LVEF of 26±7%, with lower levels present in subgroup with worse RV-PA coupling (first TAPSE/PASP tertile, p<0.05). Left atria (LA) chamber was found to be larger
in groups with lower TAPSE/PASP (p<0.05), reaching an average area of 31±9 cm2 in the
first tertile. Mean right atrial (RA) area was 21±7 cm2 for all subgroups, with no significant
differences between them. RV diameter, as well as RV end-diastolic area (RVEDA) and RV end-systolic area (RVESA), were found to be higher in patients with lower TAPSE/PASP (p<0.05). Regarding RV function, TAPSE was significantly lower in first TAPSE/PASP tertile (vs third tertile, p<0.05). PASP was significantly different across all subgroups. Higher tricuspid annular systolic velocity (S’) was associated with higher TAPSE/PASP (p<0.05). Left ventricular filling pressures, estimated by E/e’, were higher in groups with lower TAPSE/PASP ratios (p<0.05). Higher PVR was significantly related with TAPSE/PASP. Other echocardiographic characteristics did not vary significantly within the range of TAPSE/PASP ratios.
Patients were followed for a mean period of 42,2 months. During this time, 50 patients died (24,0% of the initial population screened). One-year survival was 93.3% and five-year survival was 64.8%. Survival was significantly higher in group with PASP below median, with one-year survival of 98.6% (vs 88.1% in group with PASP above median); five-year survival 71.3% (vs 57.9% in group with PASP above median) (figure 2A). According to definition of PH based on PASP, patients with PH presented higher one and fiver-year mortality (supplementary data, figure 6) Patients with compromised RV-PA coupling (TAPSE/PASP< 0.43 mm/mmHg) showed one-year survival of 91.4% and five-year survival of 50.4%, without significant differences between group with preserved RV-PA coupling (figure 2C). Patients with PH with renal dysfunction (GFR < 60mL/min/1.73m2)
prior to CRT, which corresponds to stage 3 or higher)(18), had significantly lower survival
rates when compared with patients without PH (supplementary data, figure 7).
In dichotomous analysis of TAPSE, PASP and TAPSE/PASP ratio, based on median values for each variable, PASP below threshold was significantly associated with LVEF improvement (figure 3) and all cause of death (figure 4). TAPSE/PASP>0.43 mm/mmHg was associated with higher percentage of patients that exhibited LVEF improvement (figure 3), but without significantly affecting mortality (figure 4). TAPSE per se was not associated with changes in either LVEF improvement or mortality (figures 3 and 4). In figure 5 is depicted ROC curve analysis for RV-PA variables addressed in this study for non-responders to CRT (LVEF improvement < 5%). Among them, TAPSE/PASP ratio demonstrated better accuracy to detect patients that did not show LVEF improvement to CRT. The best cut-off point for TAPSE/PASP was 0.44 mm/mmHg with a sensitivity and specificity of 76.2% and 70.8%, respectively.
Cox regression analysis of echocardiographic RV-PA correlated for primary outcome are showed in table 3. Greater baseline PASP was a significant univariate predictor (p=0.012), that was retained in multivariate analysis (p=0.025). Other variables analyzed did not seem to be independent predictors of adverse events in this population (table 3). On multivariate analysis, both NYHA and LVEF improvement were not independently associated with better survival (supplementary data, table 4).
Discussion
CRT is an established treatment for selected HF patients (2, 3). Current indications
for CRT try to identify patients most likely to benefit(1), but studies show that up to 30% of
those do not experience significant improvement and are unnecessary exposed to inherent potential complications(24). In HF, indexes of RV dysfunction are major predictors of patients’
outcome. RV-PA coupling has recently emerged as a prognostic marker outcome in patients with HF(13), although doubts still remain about its predictive power as an isolated measure(8).
Our study provides data on the RV function of patients with severe LV impairment undergoing CRT. We focused mainly on the evaluation of RV-PA coupling, by means of echocardiographic evaluation of TAPSE/PASP, as a surrogate marker of CRT response and patient’s clinical outcomes.
biomarkers associated with worse prognosis (increased NT-proBNP, reduced LVEF and increased E/e’) were related to an impaired RV-PA coupling. Second, assessment of RV function by TAPSE as an isolated measure didn’t have predictive value.
In this study, neither TAPSE nor TAPSE/PASP were significantly associated with all-cause mortality, but isolated PASP did. During follow-up period, we presented cumulative one and five-year mortalities of about 4 and 35%, in agreement with other
reports(25). Previous studies showed that between PASP and TAPSE, only PASP correlated
with mortality (in a composite outcome with hospitalizations). Of note, TAPSE/PASP was a better predictor of all-cause mortality and heart failure hospitalizations than PASP itself(26).
As pointed above, despite the wide range of PASP thresholds used to stratify the risk in HF patients with PH, data showed that PASP>40 mmHg was an independent predictor of mortality, in line with previous reports(27). Different HF phenotypes in the studied population
might explain the poor correlation of both TAPSE/PASP and TAPSE with mortality. Guazzi and co-workers worked on a HF population with moderate to severe LV impairment and differentiated four RV-PA phenotypes, with prognostic impact. They found lower mortality rates in patients with preserved RV function, defined as TAPSE≥16 mm(17). Based on
medians, we defined TAPSE<14 mm as a marker of RV dysfunction. Previous studies demonstrated that this cut-off has impact on prognosis of patients with HF(27-29). However,
almost 80% of our patients had TAPSE ≥ 14 mm, which means that RV function was preserved or at least not severely compromised, and according to Guazzi’s classification, most patients included in TAPSE/PASP analysis probably belonged to lower mortality groups with preserved RV function(13, 17, 27). Another explanation is possibly related with
TAPSE/PASP threshold defined in study that cannot fully exploit its prognostic power(14).
The proportion of patients who responded to CRT (using the echocardiographic definition stated above) was reduced in those with more impaired RV-PA coupling. To our knowledge the predictive value of TAPSE/PASP ratio hasn’t been previously examined in the population with CRT. An agreement about definition of a “responder” to CRT was not
reached, yet(24). Adding more complexity, some patients can be either later (12months or
higher) or shorter responders (about 6 months), and that also has impact on outcome(30, 31).
Several measures have been used to demonstrate response to CRT, namely functional (e.g. NYHA), quality-of-life, event-based, reverse remodeling (e.g. LVEF, LV dimensions), either used individually or as composite(24, 32). In this study, we looked for NYHA and LVEF
improvement as measures of CRT response. Several authors suggested an increase of 5%
or more in LVEF, as well as NYHA improvement (³1), as favorable responses to CRT(33-36).
We observed that 69.6% of patients showed improved LVEF³ 5%, and 46.4% showed improved NYHA, 6 to 12-months after CRT. However, between these two outcomes, only LVEF improvement was associated with TAPSE/PASP. Other researchers documented
LVEF improvement in 60-70 % of patients following 3 to 6-month post-CRT(25, 37, 38).This
suggests that reverse remodeling promoted by CRT is time-dependent(30, 39), and the
increased proportion of responders in our study is possibly due to longer period of CRT follow-up. Interestingly, once reverse remodeling is achieved it remains stable and the etiology of HF loses impact in patients’ outcome(25, 39). In a recent prospective study, LV
remodeling, evaluated by cardiac catheterization following 6 months of CRT, demonstrated that higher RV-PA coupling ratios were correlated with positive LV remodeling and long-term survival. Furthermore, RV-PA coupling remained the only independent hemodynamic predictor for the echo-defined response, among other clinical, echocardiographic and hemodynamic covariates, including those related with LV function(40). In agreement with this
find, the PROSPECT trial demonstrated that several echocardiographic parameters, most of them related with LV desynchrony, did not improve power to predict clinical response to CRT(41). The value of several echocardiographic related with RV function, including TAPSE,
strain, RV ejection fraction and RV fractional area change, in predicting response to CRT was recently challenged in a meta-analysis(42). In ROC curve analysis we observed a better
predictive value with TAPSE/PASP for LVEF improvement, with a sensitivity and a specificity very similar to those presented in Schmeisser’s study (73.2% sensitivity and 70.5% specificity) for RV-PA coupling ratio(40). Another study found that a cut-off point of
TAPSE of 14 mm adds value in predicting response to CRT but, as pointed by the authors, no single RV parameter was able to identify who are likely to respond to CRT(43). In our
data, TAPSE was the weakest predictor of LVEF improvement. TAPSE translates the main apical displacement of tricuspid annulus but its evaluation alone might be insufficient because it’s a regional parameter with angle-dependency and it doesn’t account for load conditions which are of critical importance to RV function(26). With progressive systolic
dysfunction there’s an increased use of Starling’s “heterometric adaptation” (with preservation of cardiac output though increased afterload)(27). This leads to the uncoupling
of the RV from the PA and makes load conditions increasingly important to function. In the CRT population this scenario is very frequent. Therefore, combining the evaluation of contractility (estimated by TAPSE) with afterload (estimated by PASP) might increase accuracy in RV function evaluation in this subset of patients. Further studies are necessary to prove the clinical value and explore the potential role of TAPSE/PASP as another tool to identify those who will respond to CRT.
Apart from echocardiographic parameters, other variables may predict outcome/response in patients with PH-LHD submitted to CRT. Etiology of HF, QRS morphology and duration, gender, heart rhythm, renal and lung diseases are known to
function affected survival in the subgroup of patients with PH (PASP>40 mmHg). Nevertheless, this result expands and strengthens the notion that RV dysfunction and CKD are associated with a poor outcome in chronic systolic HF(4, 15, 46, 47).
In our population, TAPSE/PASP was significantly associated with robust prognostic surrogate markers in HF such as baseline LVEF, increased E/e’ and NT-proBNP plasma concentrations. Comparably to our data, Guazzi’s study demonstrated that nonsurvivors patients with HF had poorer LV function (lower baseline LVEF, higher plasmatic NT-proBNP, and higher E/e’); and also poor RV function (lower TAPSE, higher PASP and, therefore, lower TAPSE/PASP ratio)(14). The levels of BNP or its prohormone are mostly
used to stratify risk in patients in LV failure. Yet, these natriuretic peptides also correlate
with right heart circulation (48). The inverse relation observed between TAPSE/PASP and
NT-proBNP levels is consistent with other studies(49-51). For example, Dini et al. found
prospectively in a population with reduced to mid-range LVEF a negative relation between TAPSE and NT-proBNP markers, and an increase in prognostic information to other clinical and echocardiographic variables used in HF risk stratification(50). Further, in a pediatric
population with pulmonary arterial hypertension, with no signs of LV dysfunction, RV-PA decoupling was correlated with increase of NT-proBNP levels(51). Together, these findings
emphasize the need to account for afterload when assessing RV function. Whether it adds prognostic significance to patients with HF is still uncertain.
Conclusion
Our study reinforces the value of studying right heart and pulmonary circulation in patients with left HF. TAPSE/PASP ratio is an easy tool to assess RV length/force relationship and have important clinical significance. It was associated with validated prognostic markers in HF such as NT-proBNP, LVEF and E/e’ ratio. In addition, it outperformed isolated TAPSE in identifying patients who did not respond to CRT. Whether it adds on prognostic information to PASP is still unclear.
Study limitations
Our main limitations were the small number of patients included and the exclusive non-invasive assessment of RV function. The retrospective nature of this study and the
difficulty in fully visualizing the RV in some patients resulted in significant losses of data and make it more prone to be influenced by bias and confounding factors. For complete RV assessment, right heart catheterization (for hemodynamics evaluation) and cardiac magnetic resonance (for function and chamber size) are considered the gold standard both are costly and with limited availability. Moreover, the first is an invasive exam and the second is not feasible after CRT implantation. Echocardiography remains the most accessible tool to evaluate cardiac function in daily practice and is highly validated. The correlation of non-invasive estimates with invasive measurements has been shown before to be accurate in HF with reduced LVEF patients(27). Furthermore, PASP is also influenced
by PVR, which might not be a direct consequence of cardiac dysfunction. However, since both pulmonary congestion and PVR will deleteriously affect afterload in chronic HF, hence the prognostic significance seems to be retained.
Appendix
Tables
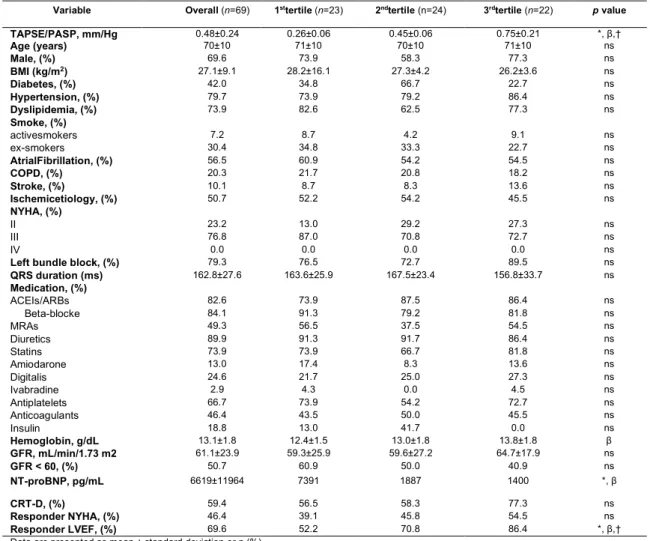
Table 1 – Clinical features of the studied population according to TAPSE/PASP
tertiles
Variable Overall (n=69) 1sttertile (n=23) 2ndtertile (n=24) 3rdtertile (n=22) p value
TAPSE/PASP, mm/Hg 0.48±0.24 0.26±0.06 0.45±0.06 0.75±0.21 *, β,† Age (years) 70±10 71±10 70±10 71±10 ns Male, (%) 69.6 73.9 58.3 77.3 ns BMI (kg/m2) 27.1±9.1 28.2±16.1 27.3±4.2 26.2±3.6 ns Diabetes, (%) 42.0 34.8 66.7 22.7 ns Hypertension, (%) 79.7 73.9 79.2 86.4 ns Dyslipidemia, (%) 73.9 82.6 62.5 77.3 ns Smoke, (%) activesmokers 7.2 8.7 4.2 9.1 ns ex-smokers 30.4 34.8 33.3 22.7 ns AtrialFibrillation, (%) 56.5 60.9 54.2 54.5 ns COPD, (%) 20.3 21.7 20.8 18.2 ns Stroke, (%) 10.1 8.7 8.3 13.6 ns Ischemicetiology, (%) 50.7 52.2 54.2 45.5 ns NYHA, (%) II 23.2 13.0 29.2 27.3 ns III 76.8 87.0 70.8 72.7 ns IV 0.0 0.0 0.0 0.0 ns
Left bundle block, (%) 79.3 76.5 72.7 89.5 ns
QRS duration (ms) 162.8±27.6 163.6±25.9 167.5±23.4 156.8±33.7 ns Medication, (%) ACEIs/ARBs 82.6 73.9 87.5 86.4 ns Beta-blocke 84.1 91.3 79.2 81.8 ns MRAs 49.3 56.5 37.5 54.5 ns Diuretics 89.9 91.3 91.7 86.4 ns Statins 73.9 73.9 66.7 81.8 ns Amiodarone 13.0 17.4 8.3 13.6 ns Digitalis 24.6 21.7 25.0 27.3 ns Ivabradine 2.9 4.3 0.0 4.5 ns Antiplatelets 66.7 73.9 54.2 72.7 ns Anticoagulants 46.4 43.5 50.0 45.5 ns Insulin 18.8 13.0 41.7 0.0 ns Hemoglobin, g/dL 13.1±1.8 12.4±1.5 13.0±1.8 13.8±1.8 β GFR, mL/min/1.73 m2 61.1±23.9 59.3±25.9 59.6±27.2 64.7±17.9 ns GFR < 60, (%) 50.7 60.9 50.0 40.9 ns NT-proBNP, pg/mL (min-max) 6619±11964 7391 (2407.5-11259.0) 1887 (761.2-6647.0) 1400 (655.1-3881.0) *, β CRT-D, (%) 59.4 56.5 58.3 77.3 ns Responder NYHA, (%) 46.4 39.1 45.8 54.5 ns Responder LVEF, (%) 69.6 52.2 70.8 86.4 *, β,†
Data are presented as mean ± standard deviation or n (%).
Abbreviation: ACEIs, angiotensin-covering enzyme inhibitors; BMI, body mass index; COPD; chronic obstructive pulmonary disease; CRT, cardiac resynchronization therapy; GFR, glomerular filtration rate; LVEF, left ventricular ejection fraction; MRAs, mineralocorticoid receptor antagonist; ns, not significat; NT-proBNP, N-terminal pro-B-type natriuretic peptide. NYHA, New York Heart Association; PASP, estimated pulmonary artery systolic pressure.
Statistical significance between groups were calculated using ANOVA tests: 1sttertile vs 2ndtertile (*p<0.05), 1sttertile vs 3rdtertile (β p<0.05),
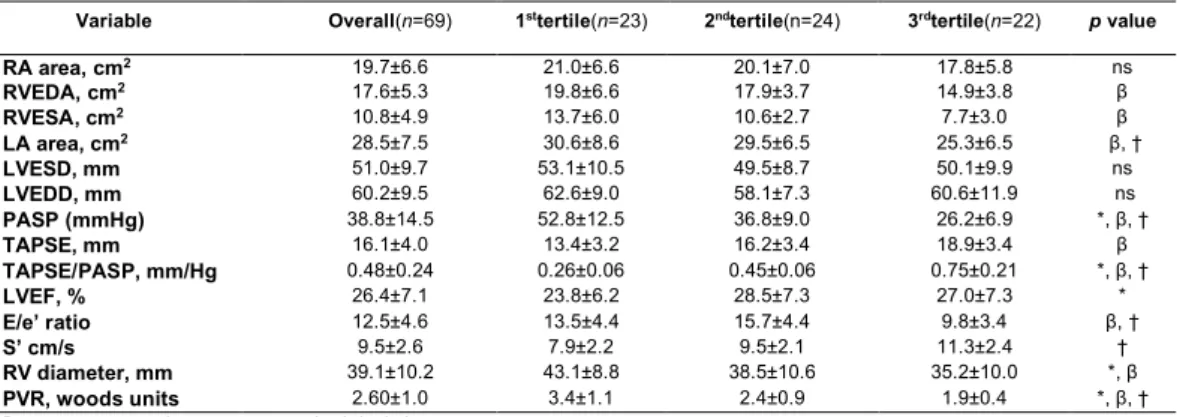
Table 2 - Echocardiographic characteristics of the studied population according
to TAPSE/PASP tertiles
Variable Overall(n=69) 1sttertile(n=23) 2ndtertile(n=24) 3rdtertile(n=22) p value
RA area, cm2 19.7±6.6 21.0±6.6 20.1±7.0 17.8±5.8 ns RVEDA, cm2 17.6±5.3 19.8±6.6 17.9±3.7 14.9±3.8 β RVESA, cm2 10.8±4.9 13.7±6.0 10.6±2.7 7.7±3.0 β LA area, cm2 28.5±7.5 30.6±8.6 29.5±6.5 25.3±6.5 β, † LVESD, mm 51.0±9.7 53.1±10.5 49.5±8.7 50.1±9.9 ns LVEDD, mm 60.2±9.5 62.6±9.0 58.1±7.3 60.6±11.9 ns PASP (mmHg) 38.8±14.5 52.8±12.5 36.8±9.0 26.2±6.9 *, β, † TAPSE, mm 16.1±4.0 13.4±3.2 16.2±3.4 18.9±3.4 β TAPSE/PASP, mm/Hg 0.48±0.24 0.26±0.06 0.45±0.06 0.75±0.21 *, β, † LVEF, % 26.4±7.1 23.8±6.2 28.5±7.3 27.0±7.3 * E/e’ ratio 12.5±4.6 13.5±4.4 15.7±4.4 9.8±3.4 β, † S’ cm/s 9.5±2.6 7.9±2.2 9.5±2.1 11.3±2.4 † RV diameter, mm 39.1±10.2 43.1±8.8 38.5±10.6 35.2±10.0 *, β PVR, woods units 2.60±1.0 3.4±1.1 2.4±0.9 1.9±0.4 *, β, †
Data are presented as mean ± standard deviation.
Abbreviation: E/E’, early diastolic transmitral flow velocity to averaged annular early diastolic velocity ratio; ePSAP: estimated pulmonary systolic artery pressure; LA: left atrial; LVEF: left ventricular ejection fraction; LVEDV, LV end-diastolic diameter; LVESV, LV end-systolic diameter; PVR: pulmonary vascular resistance; RA: right atrial; RV: right ventricle; RVEDA, RV end-diastolic area; RVESA, RV end-systolic area; S’, annular systolic velocity; TAPSE: tricuspid annular plane systolic excursion.
Statistical significance between groups were calculated using ANOVA tests: 1sttertile vs 2ndtertile (*p<0.05), 1sttertile vs 3rdtertile (β
p<0.05), 2ndtertile vs 3rdtertile († p<0.05). ns means not-significant.
Table 3 – Survival analysis for echocardiographic variables
Univariableanalysis Multivariableanalysis Variable HazardRatio 95% ConfidenceInterval Pvalue HazardRatio 95% ConfidenceInterval P value PASP 1.029 1.006 to 1.052 0.012 1.019 0.994 to 1.045 0.025 TAPSE 1.011 0.874 to 1.170 0.883 1.016 0.883 to 1.170 0.820 TAPSE/PASP 2.637 0.181 to 38.33 0.478 2.077 0.131 to 32.91 0.604
Data were calculated using Cox regression model. PASP, TAPSE and TAPSE/PASP correspond to baseline data before CRT. Multivariable models included adjustment for age, sex, log(NT-proBNP). Abbreviation ePSAP: estimated pulmonary systolic artery pressure; TAPSE: tricuspid annular plane systolic excursion.
Figures
Figure 1 - Pearson’s correlation analysis between TAPSE/PASP and log-transformed
NT-proBNP before CRT. Solid line represents its linear relationship, with 95% confidence interval limited by dashed lines. p<0.05 was considered significant.
0.0 0.5 1.0 1.5 1 2 3 4 5 6 (TAPSE/PASP)/(mm/mmHg) log (NT -proBNP/(pg/mL)) Pearson R= 0.2204 P = 0.0007
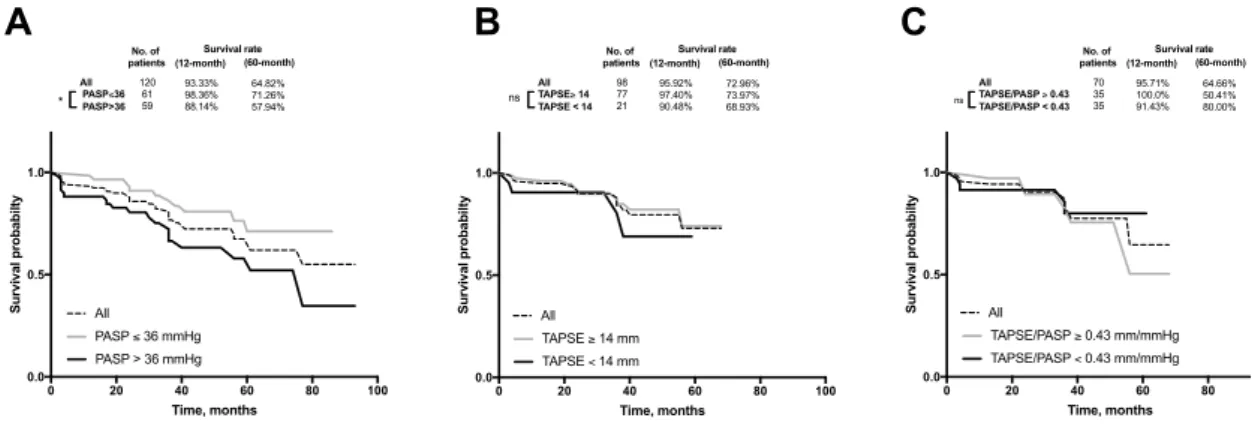
Figure 2 - Survival curves according to PASP, TAPSE and TAPSE/PASP ratio for
primary outcome all-cause of death. Cut-off values represent data median for each variable. Inside upper charts represent overall survival 12 and 60 month after CRT. P-values were obtained by log-rank (Mantel–Cox) significance (*p<0.05 was considered significant; ns means not-significant).
Figure 3 - Percentage of patients with improved LVEF response by PASP, TAPSE
and TAPSE/PASP (categorized by median) 6 to 12 months after CRT. Patients with an increase of LVEF≥5% after CRT were considered to have an improved response. Small inset indicates median values for the variables presented. Number of patients in each subgroup is indicated inside bars. P-values were calculated with use of the chi-square test (*P<0.05 was considered significant, ns means not-significant).
0 20 40 60 80 100 0.0 0.5 1.0 Time, months Survival probabilty (12-month) All PASP≤36 PASP>36 93.33% 98.36% 88.14% (60-month) 64.82% 71.26% 57.94% Survival rate No. of patients 120 61 59 * PASP > 36 mmHg PASP ≤ 36 mmHg All 0 20 40 60 80 100 0.0 0.5 1.0 Time, months Survival probabilty (12-month) All TAPSE≥ 14 TAPSE < 14 95.92% 97.40% 90.48% (60-month) 72.96% 73.97% 68.93% Survival rate No. of patients 98 77 21 ns TAPSE < 14 mm TAPSE ≥ 14 mm All 0 20 40 60 80 100 0.0 0.5 1.0 Time, months Survival probabilty (12-month) All TAPSE/PASP ≥ 0.43 TAPSE/PASP < 0.43 95.71% 100.0% 91.43% (60-month) 64.66% 50.41% 80.00% Survival rate No. of patients 70 35 35 ns TAPSE/PASP ≥ 0.43 mm/mmHg TAPSE/PASP < 0.43 mm/mmHg All
A
B
C
PASP TAPSE TAPSE/PASP
0 50 100
% patients with LEVF improvement
Below median Above median * * 27 7 15 20 7 17 ns Median ePASP = 36 mmHg TAPSE = 17 mm TAPSE/ePASP = 0.43 mm/mmHg
Figure 4 - Mortality rate by PASP, TAPSE and TAPSE/PASP (categorized by median)
6 to 12 months after CRT. Small inset indicates median values for the variables presented. Number of patients in each subgroup is indicated inside bars. P-values were calculated with use of the chi-square test (*P<0.05 was considered significant, ns means not-significant).
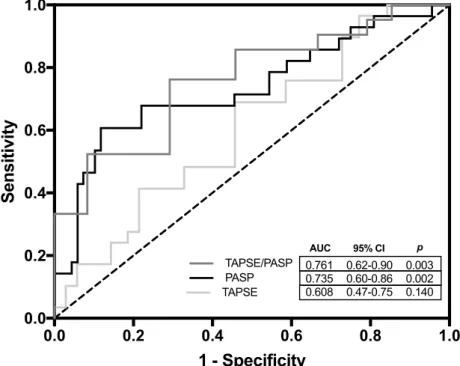
Figure 5 - ROC curves for TAPSE, PASP and TAPSE/PASP to identify unimproved
LVEF (defined as LVEF < 5%) after CRT. Area under the curve (AUC); 95% confidence interval (CI). p<0,05 was considered significantly different from dotted line (AUC=0.5)
.
PASP TAPSE TAPSE/PASP
0 50 100 mortality rate (%) Below median Above median * ns 11 20 6 9 5 6 ns Median ePASP = 36 mmHg TAPSE = 17 mm TAPSE/ePASP = 0.43 mm/mmHg 0.0 0.2 0.4 0.6 0.8 1.0 0.0 0.2 0.4 0.6 0.8 1.0 1 - Specificity Sensitivity TAPSE/PASP TAPSE PASP AUC 95% CI p 0.761 0.735 0.608 0.62-0.90 0.60-0.86 0.47-0.75 0.003 0.002 0.140
Supplementary data
Table 4 – Hazard rations for secondary outcomes
Univariable analysis Multivariable analysis Variable Hazard Ratio 95% Confidence Interval P value Hazard Ratio 95% Confidence Interval P value NYHA improvement -0.025 -0.050 to 0.001 0.058 -0.018 -0.050 to 0.014 0.262 LVEF improvement -0.022 -0.05 to 0.005 0.113 0.006 -0.031 to 1.045 0.765
Primary outcome was all cause death; secondary outcome was (NYHA and LVEF improvement). Data represent unadjusted and adjusted odds ratios (ORs) for estimated pulmonary artery systolic pressure (ePSAP) as a predictor of any improvement of left ventricular ejection fraction (LVEF) superior to 5% and improvement of NYHA between the baseline and 6 to 12-month echocardiograms or hazard ratios (HRs) for mortality. Multivariable models included adjustment for age, sex, log(NT-proBNP).
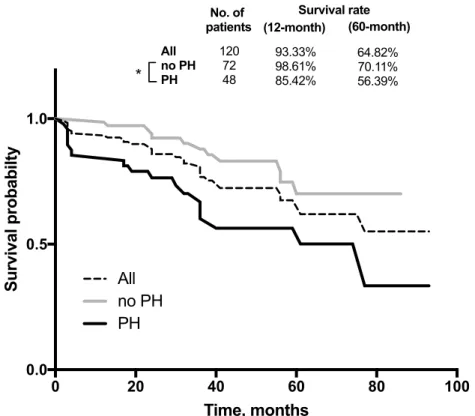
Figure 6 - Survival curves according to absence or presence of pulmonary hypertension
(PH), defined as PASP >40 mmHg, for primary outcome of all-cause death in all patients. Inside upper chart represents overall survival 12 and 60 month after CRT. P-values were obtained by log-rank (Mantel–Cox) significance (*p<0.05 was considered significant).
0 20 40 60 80 100 0.0 0.5 1.0 Time, months Survival probabilty PH no PH All (12-month) All no PH PH 93.33% 98.61% 85.42% (60-month) 64.82% 70.11% 56.39% Survival rate No. of patients 120 72 48 *
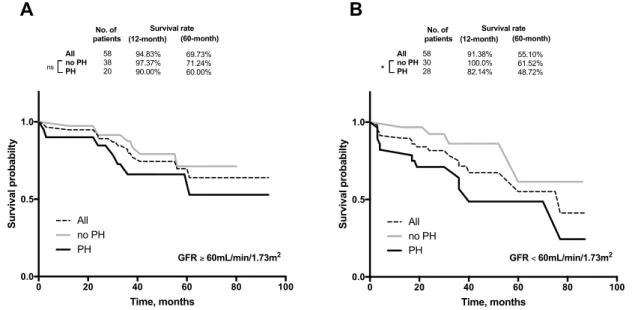
Figure 7- Survival curves according to absence or presence of pulmonary hypertension
(PH), defined as PASP >40 mmHg, for primary outcome of all-cause death in patients with glomerular filtration rate (GFR) equal or higher (panel A), or lower (panel B) than 60mL/min/1.73m2. Inside upper charts represent overall survival 12 and 60 month after
CRT. p values were obtained by log-rank (Mantel–Cox) significance (*P<0.05 was considered significant; ns means not-significant).
0 20 40 60 80 100 0.0 0.5 1.0 Time, months Survival probabilty PH no PH (12-month) All no PH PH 94.83% 97.37% 90.00% (60-month) 69.73% 71.24% 60.00% Survival rate No. of patients 58 38 20 ns All 0 20 40 60 80 100 0.0 0.5 1.0 Time, months Survival probabilty PH no PH All (12-month) All no PH PH 91.38% 100.0% 82.14% (60-month) 55.10% 61.52% 48.72% Survival rate No. of patients 58 30 28 * GFR ≥ 60mL/min/1.73m2 GFR < 60mL/min/1.73m2
A
B
References
1. Ponikowski P, Voors AA, Anker SD, Bueno H, Cleland JGF, Coats AJS, et al. 2016
ESC Guidelines for the diagnosis and treatment of acute and chronic heart failure: The Task Force for the diagnosis and treatment of acute and chronic heart failure of the European Society of Cardiology (ESC)Developed with the special contribution of the Heart Failure Association (HFA) of the ESC. Eur Heart J. 2016;37(27):2129-200.
2. Goldenberg I, Kutyifa V, Klein HU, Cannom DS, Brown MW, Dan A, et al. Survival
with cardiac-resynchronization therapy in mild heart failure. N Engl J Med. 2014;370(18):1694-701.
3. Chinitz JS, d'Avila A, Goldman M, Reddy V, Dukkipati S. Cardiac resynchronization
therapy: who benefits? Ann Glob Health. 2014;80(1):61-8.
4. Kreuz J, Horlbeck F, Linhart M, Mellert F, Fimmers R, Schrickel J, et al. Independent
predictors of mortality in patients with advanced heart failure treated by cardiac resynchronization therapy. Europace. 2012;14(11):1596-601.
5. Mullens W, Grimm RA, Verga T, Dresing T, Starling RC, Wilkoff BL, et al. Insights
from a cardiac resynchronization optimization clinic as part of a heart failure disease management program. J Am Coll Cardiol. 2009;53(9):765-73.
6. Burri H, Domenichini G, Sunthorn H, Fleury E, Stettler C, Foulkes I, et al. Right ventricular systolic function and cardiac resynchronization therapy. Europace. 2010;12(3):389-94.
7. van Everdingen WM, Walmsley J, Cramer MJ, van Hagen I, De Boeck BWL, Meine
M, et al. Echocardiographic Prediction of Cardiac Resynchronization Therapy Response Requires Analysis of Both Mechanical Dyssynchrony and Right Ventricular Function: A Combined Analysis of Patient Data and Computer Simulations. J Am Soc Echocardiogr. 2017;30(10):1012-20 e2.
8. Ricci F, Mele D, Bianco F, Bucciarelli V, De Caterina R, Gallina S. Right heart-pulmonary circulation unit and cardiac resynchronization therapy. Am Heart J. 2017;185:1-16.
9. Rosenkranz S, Gibbs JS, Wachter R, De Marco T, Vonk-Noordegraaf A, Vachiery
JL. Left ventricular heart failure and pulmonary hypertension. Eur Heart J. 2016;37(12):942-54.
10. Simonneau G, Gatzoulis MA, Adatia I, Celermajer D, Denton C, Ghofrani A, et al.
[Updated clinical classification of pulmonary hypertension]. Turk Kardiyol Dern Ars. 2014;42 Suppl 1:45-54.
11. Aronson D, Eitan A, Dragu R, Burger AJ. Relationship between reactive pulmonary
hypertension and mortality in patients with acute decompensated heart failure. Circ Heart Fail. 2011;4(5):644-50.
12. Kjaergaard J, Akkan D, Iversen KK, Kjoller E, Kober L, Torp-Pedersen C, et al. Prognostic importance of pulmonary hypertension in patients with heart failure. Am J Cardiol. 2007;99(8):1146-50.
13. Ghio S, Gavazzi A, Campana C, Inserra C, Klersy C, Sebastiani R, et al.
Independent and additive prognostic value of right ventricular systolic function and pulmonary artery pressure in patients with chronic heart failure. J Am Coll Cardiol. 2001;37(1):183-8.
14. Guazzi M, Bandera F, Pelissero G, Castelvecchio S, Menicanti L, Ghio S, et al. Tricuspid annular plane systolic excursion and pulmonary arterial systolic pressure relationship in heart failure: an index of right ventricular contractile function and prognosis. Am J Physiol Heart Circ Physiol. 2013;305(9):H1373-81.
15. Guazzi M, Dixon D, Labate V, Beussink-Nelson L, Bandera F, Cuttica MJ, et al. RV
Contractile Function and its Coupling to Pulmonary Circulation in Heart Failure With Preserved Ejection Fraction: Stratification of Clinical Phenotypes and Outcomes. JACC Cardiovasc Imaging. 2017;10(10 Pt B):1211-21.
16. Guazzi M, Naeije R. Pulmonary Hypertension in Heart Failure: Pathophysiology, Pathobiology, and Emerging Clinical Perspectives. J Am Coll Cardiol. 2017;69(13):1718-34.
17. Guazzi M, Naeije R, Arena R, Corra U, Ghio S, Forfia P, et al. Echocardiography of
Right Ventriculoarterial Coupling Combined With Cardiopulmonary Exercise Testing to Predict Outcome in Heart Failure. Chest. 2015;148(1):226-34.
18. Levey AS, Stevens LA, Schmid CH, Zhang YL, Castro AF, 3rd, Feldman HI, et al. A
new equation to estimate glomerular filtration rate. Ann Intern Med. 2009;150(9):604-12.
19. Lang RM, Badano LP, Mor-Avi V, Afilalo J, Armstrong A, Ernande L, et al.
Recommendations for cardiac chamber quantification by echocardiography in adults: an update from the American Society of Echocardiography and the European Association of Cardiovascular Imaging. Eur Heart J Cardiovasc Imaging. 2015;16(3):233-70.
20. Chung K, Strange G, Codde J, Celermajer D, Scalia GM, Playford D. Left Heart Disease and Pulmonary Hypertension: Are We Seeing the Full Picture? Heart Lung Circ. 2018;27(3):301-9.
21. Roberts JD, Forfia PR. Diagnosis and assessment of pulmonary vascular disease
by Doppler echocardiography. Pulm Circ. 2011;1(2):160-81.
22. Parasuraman S, Walker S, Loudon BL, Gollop ND, Wilson AM, Lowery C, et al. Assessment of pulmonary artery pressure by echocardiography-A comprehensive review. Int J Cardiol Heart Vasc. 2016;12:45-51.
23. Lucijanic M. Survival analysis in clinical practice: analyze your own data using an
Excel workbook. Croat Med J. 2016;57(1):77-9.
24. Daubert C, Behar N, Martins RP, Mabo P, Leclercq C. Avoiding non-responders to
cardiac resynchronization therapy: a practical guide. Eur Heart J. 2017;38(19):1463-72. 25. Di Biase L, Auricchio A, Sorgente A, Civello K, Klersy C, Faletra F, et al. The magnitude of reverse remodelling irrespective of aetiology predicts outcome of heart failure patients treated with cardiac resynchronization therapy. Eur Heart J. 2008;29(20):2497-505. 26. Bosch L, Lam CSP, Gong L, Chan SP, Sim D, Yeo D, et al. Right ventricular dysfunction in left-sided heart failure with preserved versus reduced ejection fraction. Eur J Heart Fail. 2017;19(12):1664-71.
27. Ghio S, Temporelli PL, Klersy C, Simioniuc A, Girardi B, Scelsi L, et al. Prognostic
relevance of a non-invasive evaluation of right ventricular function and pulmonary artery pressure in patients with chronic heart failure. Eur J Heart Fail. 2013;15(4):408-14.
28. Ghio S, Recusani F, Klersy C, Sebastiani R, Laudisa ML, Campana C, et al.
Prognostic usefulness of the tricuspid annular plane systolic excursion in patients with congestive heart failure secondary to idiopathic or ischemic dilated cardiomyopathy. Am J Cardiol. 2000;85(7):837-42.
29. Kjaergaard J, Akkan D, Iversen KK, Kober L, Torp-Pedersen C, Hassager C. Right
ventricular dysfunction as an independent predictor of short- and long-term mortality in patients with heart failure. Eur J Heart Fail. 2007;9(6-7):610-6.
30. Oka T, Inoue K, Tanaka K, Toyoshima Y, Isshiki T, Kimura T, et al. Duration of reverse remodeling response to cardiac resynchronization therapy: Rates, predictors, and clinical outcomes. Int J Cardiol. 2017;243:340-6.
31. Linde C, Abraham WT, Gold MR, Daubert JC, Tang ASL, Young JB, et al. Predictors
of short-term clinical response to cardiac resynchronization therapy. Eur J Heart Fail. 2017;19(8):1056-63.
32. Fornwalt BK, Sprague WW, BeDell P, Suever JD, Gerritse B, Merlino JD, et al. Agreement is poor among current criteria used to define response to cardiac resynchronization therapy. Circulation. 2010;121(18):1985-91.
33. Bleeker GB, Bax JJ, Fung JW, van der Wall EE, Zhang Q, Schalij MJ, et al. Clinical
versus echocardiographic parameters to assess response to cardiac resynchronization therapy. Am J Cardiol. 2006;97(2):260-3.
with end-stage heart failure before pacemaker implantation. Am J Cardiol. 2003;92(10):1238-40.
35. Zhang Y, Guallar E, Blasco-Colmenares E, Butcher B, Norgard S, Nauffal V, et al.
Changes in Follow-Up Left Ventricular Ejection Fraction Associated With Outcomes in Primary Prevention Implantable Cardioverter-Defibrillator and Cardiac Resynchronization Therapy Device Recipients. J Am Coll Cardiol. 2015;66(5):524-31.
36. Brambatti M, Guerra F, Matassini MV, Cipolletta L, Barbarossa A, Urbinati A, et al.
Cardiac resynchronization therapy improves ejection fraction and cardiac remodelling regardless of patients' age. Europace. 2013;15(5):704-10.
37. Rao RK, Kumar UN, Schafer J, Viloria E, De Lurgio D, Foster E. Reduced ventricular
volumes and improved systolic function with cardiac resynchronization therapy: a randomized trial comparing simultaneous biventricular pacing, sequential biventricular pacing, and left ventricular pacing. Circulation. 2007;115(16):2136-44.
38. Abreu A, Oliveira M, Silva Cunha P, Santa Clara H, Santos V, Portugal G, et al. Predictors of response to cardiac resynchronization therapy: A prospective cohort study. Rev Port Cardiol. 2017;36(6):417-25.
39. Linde C, Gold MR, Abraham WT, St John Sutton M, Ghio S, Cerkvenik J, et al.
Long-term impact of cardiac resynchronization therapy in mild heart failure: 5-year results from the REsynchronization reVErses Remodeling in Systolic left vEntricular dysfunction (REVERSE) study. Eur Heart J. 2013;34(33):2592-9.
40. Schmeisser A, Rauwolf T, Ghanem A, Groscheck T, Adolf D, Grothues F, et al. Right
heart function interacts with left ventricular remodeling after CRT: A pressure volume loop study. Int J Cardiol. 2018.
41. Chung ES, Leon AR, Tavazzi L, Sun JP, Nihoyannopoulos P, Merlino J, et al. Results of the Predictors of Response to CRT (PROSPECT) trial. Circulation. 2008;117(20):2608-16.
42. Sharma A, Bax JJ, Vallakati A, Goel S, Lavie CJ, Kassotis J, et al. Meta-Analysis of
the Relation of Baseline Right Ventricular Function to Response to Cardiac Resynchronization Therapy. Am J Cardiol. 2016;117(8):1315-21.
43. Kusiak A, Wilinski J, Wojciechowska W, Jastrzebski M, Sondej T, Kloch-Badelek M,
et al. Echocardiographic assessment of right ventricular function in responders and non-responders to cardiac resynchronization therapy. Arch Med Sci. 2015;11(4):736-42.
44. Rickard J, Michtalik H, Sharma R, Berger Z, Iyoha E, Green AR, et al. Predictors of
response to cardiac resynchronization therapy: A systematic review. Int J Cardiol. 2016;225:345-52.
45. Loutfi M, Nawar M, Eltahan S, Elhoda AA. Predictors of response to cardiac
resynchronization therapy in chronic heart failure patients. The Egyptian Heart Journal. 2016;68(4):227-36.
46. Dzudie A, Kengne AP, Thienemann F, Sliwa K. Predictors of hospitalisations for heart failure and mortality in patients with pulmonary hypertension associated with left heart disease: a systematic review. BMJ Open. 2014;4(7):e004843.
47. Dini FL, Demmer RT, Simioniuc A, Morrone D, Donati F, Guarini G, et al. Right ventricular dysfunction is associated with chronic kidney disease and predicts survival in patients with chronic systolic heart failure. Eur J Heart Fail. 2012;14(3):287-94.
48. Schoen SP, Zimmermann T, Kittner T, Braun MU, Fuhrmann J, Schmeisser A, et al.
NT-proBNP correlates with right heart haemodynamic parameters and volumes in patients with atrial septal defects. Eur J Heart Fail. 2007;9(6-7):660-6.
49. Palazzuoli A, Beltrami M, Ruocco G, Franci B, Campagna MS, Nuti R. Diagnostic
utility of contemporary echo and BNP assessment in patients with acute heart failure during early hospitalization. Eur J Intern Med. 2016;30:43-8.
50. Dini FL, Fontanive P, Panicucci E, Andreini D, Chella P, De Tommasi SM.
Prognostic significance of tricuspid annular motion and plasma NT-proBNP in patients with heart failure and moderate-to-severe functional mitral regurgitation. Eur J Heart Fail. 2008;10(6):573-80.
51. Kheyfets VO, Dunning J, Truong U, Ivy DD, Hunter KA, Shandas R. Assessment of N-terminal prohormone B-type natriuretic peptide as a measure of vascular and ventricular function in pediatric pulmonary arterial hypertension. Pulm Circ. 2015;5(4):658-66.