Carlos Chaves* Andr´e C. Silva**
Abstract
We examine the impact of expected inflation on stock returns. We use in-flation forecasts from the Focus survey and real returns of Ibovespa (the index of B3, the Brazilian stock exchange). In our main specification, an increase of 1 percentage point in expected inflation for the next 12 months is associated with a decline of 0.57 percentage points in stock returns. Stock returns react negatively to the 5-year CDS volatility and the VIX index. A simulated portfolio with a strategy based on changes in inflation expec-tations from 2003 to 2016 has cumulated real returns of 135 percent while cumulated real Ibovespa returns are 48 percent. The strategy implies higher cumulated real returns compared with Ibovespa in 69 percent of the period.
Keywords: Stock returns, inflation, B3, inflation forecasts, Focus survey,
Ibovespa
C´odigos JEL: E31, G11, G12, G17.
Resumo N´os analisamos o impacto da infla¸c˜ao esperada nos retornos de a¸c˜oes. Usamos as previs˜oes de infla¸c˜ao da pesquisa Focus e retornos reais do Ibovespa (o ´ındice da B3, a bolsa de valores do Brasil). Na nossa especi-fica¸c˜ao principal, um aumento de 1 ponto percentual na infla¸c˜ao esperada para os pr´oximos 12 meses ´e associado a uma diminui¸c˜ao de 0.57 ponto per-centual nos retornos de a¸c˜oes. Os retornos de a¸c˜oes reagem negativamente `a
Submetido em 21 de mar¸co de 2018. Reformulado em 14 de agosto de 2018. Aceito em 14 de agosto de 2018. Publicado on-line em 17 de novembro de 2018. O artigo foi avaliado segundo o processo de duplo anonimato al´em de ser avaliado pelo editor. Editor respons´avel: M´arcio Laurini.
*Ita´u BBA, S˜ao Paulo, SP, Brazil E-mail: crchaves@gmail.com
**Nova School of Business and Economics, Universidade NOVA de Lisboa,
Carcavelos, Portugal. E-mail: andre.silva@novasbe.pt. ORCID
0000-0002-4907-038X. We thank Edson Gon¸calves and Tiago Souza for comments and dis-cussion. We also thank two anonymous referees and the editor for comments and suggestions. This work was funded by FCT-Funda¸c˜ao para a Ciˆencia e a Tec-nologia (PTDC/IIM-ECO/4825/2012, UID/ECO/00124/2013 and Social Sciences DataLab Project 22209), POR Lisboa (LISBOA-01-0145-FEDER-007722 and So-cial Sciences DataLab Project 22209), and POR Norte (SoSo-cial Sciences DataLab Project 22209).
Rev. Bras. Finan¸cas (Online), Rio de Janeiro, 16, No. 4, Oct. 2018, pp. 521-544 ISSN 1679-0731, ISSN online 1984-5146
volatilidade do CDS de 5 anos e ao ´ındice VIX. Um portf´olio simulado com uma estrat´egia baseada em mudan¸cas nas expectativas de infla¸c˜ao de 2003 a 2016 possui retornos reais acumulados de 135 por cento enquanto que o Ibovespa possui retornos reais acumulados de 48 por cento. A estrat´egia implica retornos reais acumulados maiores do que o Ibovespa em 69 por cento do per´ıodo.
Keywords: Retornos de a¸c˜oes; Infla¸c˜ao; B3; Previs˜oes de infla¸c˜ao; Pesquisa Focus; Ibovespa.
1. Introduction
We study the empirical relation between inflation and stock re-turns at B3, the Brazilian stock exchange. We use weekly real rere-turns for Ibovespa (the stock market index), the Brazil 5-year CDS, the Bloomberg Ibovespa target for the next 12 months, Ibovespa earn-ings per share forecasts, the VIX index and, from the Focus survey, forecasts for the next 12 months of CPI (IPCA) inflation, industrial production growth and GDP growth1.
We find robust evidence of a negative relation between expected inflation on stock returns. From July 2005 to December 2016, in our main specification (regression 3, in Table 2), a 1 percentage point increase in expected inflation for the next 12 months from the Focus survey is associated with a 0.57 percentage point decline in the weekly real returns for Ibovespa. We control for country risk, the VIX index, industrial production forecasts and other variables. The coefficient on expected inflation is statistically significant at the 1 percent level. With a value of 0.57, it is also economically significant.
We also observe a negative relation between expected industrial production growth and stock returns. An increase of 1 percentage point in the industrial production growth forecasts is associated to decrease of real stock returns of 0.23 percentage points. Moreover, we find that the Ibovespa returns react negatively to changes of the 5-year CDS and the VIX index.
The negative relation between inflation and stock returns has been related to a decrease in future earnings per share (Sharpe, 2002). However, we do not find any statistically significant relation between inflation and earnings forecasts for Ibovespa.
1The Focus survey is a shorthand for the Market Expectations System of the Central Bank of Brazil. We describe the Focus survey in section 2.
Figure 1 shows cumulated nominal and real returns for Ibovespa and cumulated inflation measured by the CPI (IPCA) from January 2000 to December 2016. Cumulated inflation during the period is equal to 182.8 percent. Cumulated Ibovespa returns are 252.4 per-cent. An investor who invested in the Ibovespa portfolio earned cu-mulated real returns of only 17.2 percent during the whole period, approximately 1 percent per year.
2000 2002 2004 2006 2008 2010 2012 2014 2016 0 50 100 150 200 250 300 350 400 450 Ibovespa CPI Ibovespa real Figure 1
Cumulated returns from Ibovespa, CPI (IPCA), and real Ibovespa. Weekly returns from January 2000 to December 2016. Ibovespa and CPI from Economatica.
Fama and Schwert (1977) pointed out the negative correlation between inflation and returns of financial assets, including real stock returns. According to Feldstein (1980), in an early explanation, the negative correlation between inflation and stock returns is due to the nominal capital gains generated by inflation, which results in higher tax rates.
Fama (1981) stated that the negative correlation between inflation and real stock returns is a result of the negative correlation between inflation and real activity. The negative correlation between infla-tion and real activity, together with a positive correlainfla-tion between real activity and real stock returns, implies the negative correlation between inflation and real stock returns.2 Related to the negative
2
correlation between inflation and real activity, Piazzesi and Schnei-der (2007) state that inflation is negatively correlated with future consumption growth. Piazzesi and Schneider (2012) show that infla-tion can explain an increase in housing prices together with a decrease in the stock market, as inflation implies portfolio changes from stocks to real estate.3
For Brazil, Nunes et al. (2005) study the relation between Ibovespa returns and different macroeconomic variables. Nunes et al. find a negative relation between inflation and real stock returns, in accor-dance with our results. However, our study differs from Nunes et al. in different dimensions. In particular, we focus on the relation between inflation and real stock returns, and we relate our findings with investment strategies of fund managers. Moreover, we use the Focus survey for data on inflation expectations and we consider ad-ditional variables such as earnings forecasts and proxies for sovereign risk and market volatility.4 Given these differences, we find a stronger and more robust negative relation between inflation and real stock returns.5
For Treasury bonds, there are studies on the term structure, in-flation expectations and the inin-flation premium for Brazil. Among a positive correlation between real stock returns and real activity. Geske and Roll (1983) connects stock returns and inflation through fiscal policy. A weaker economic activity would lead to a decrease in government revenues and fiscal deficits, which the market would associate with future inflation. Campbell and Vuolteenaho (2004) consider the possibility of mispricing generated by inflation. Ang et al. (2012) study inflation-sensitivity and risk premium of specific stocks. Downing et al. (2012) use the relation between stock returns and expected inflation to construct indicators of future inflation.
3
As stated by Rigobon and Sack (2003), current stock returns might be related to future economic activity and inflation, which might imply endogeneity between monetary policy and stock returns. To mitigate this problem, following Sharpe (2002) and Rigobon and Sack (2003), we also analyze our regressions with real bond yields. As discussed in section 3, the introduction of real bond yields changes little the regression coefficients (they increase in absolute value and the significance is maintained) and do not change our conclusions.
4
Nunes et al. (2005) analyze the relation between economic activity, exchange rates, interest rates and the stock index using a VAR. Nunes et al. use monthly returns (January 1995 to December 2004) and we use weekly returns (July 2005 to December 2016).
5
We find negative and significant relations under 1 percent significance level in most of our regressions, considering additional controls and different horizons for stock returns.
others, Vicente and Guillen (2013) analyze the relation between the breakeven inflation rate for indexed and nominal Treasury bonds in Brazil with future rates of inflation. Doi et al. (2017) study the rela-tion between the level of disagreement of inflarela-tion expectarela-tions across investors and the term structure of inflation risk premium of Brazil-ian Treasury bonds.6 For the best of our knowledge, our paper is the first to focus on inflation and stock returns for Brazil.7
The relation between real stock returns and expected inflation is especially relevant for the Brazilian market. Brazil has a long history of high and volatile inflation. Given the high magnitudes and volatil-ity of inflation, taking into account changes in inflation for portfolio management could result in considerable gains. Establishing a con-sistent negative correlation between inflation and stock returns for Brazil, therefore, is important to set guidelines for portfolio man-agers.
According to our findings, inflation expectations help to forecast stock returns. As a result, an investor or portfolio manager can opti-mize the gains of an investment strategy by observing the evolution of expected inflation.
2. Data
Ibovespa is the most frequently used stock index in Brazil. We use weekly returns since November 2001. Real Ibovespa returns are obtained with the nominal returns deflated with the consumer price index (CPI). We use the IPCA for the CPI. We obtain Ibovespa and the IPCA from Economatica.
We also use the Ibovespa target, the forecast of Ibovespa earnings per share (EPS), and the median of inflation, industrial production growth, and GDP growth forecasts for the next 12 months. We in-clude the Brazil 5-year CDS (Credit Default Swap) to capture expec-tations of financial agents with respect to the risk in financial markets in Brazil, and the VIX index to capture the overall risk expectations in financial markets.
6
Doi et al. define the inflation risk premium as the difference between the rates of nominal and indexed Treasury bonds minus the rate of survey expectations of inflation.
7For hedging inflation in Brazil, see Bri`ere and Signori (2013) for strategies using bonds and foreign currency.
Inflation expectations are obtained from the Focus survey (Mar-ket Expectations System of the Central Bank of Brazil). The system was created in 1999 to support the implementation of the inflation targeting regime, established in the same year. The system collects market expectations from banks, asset managers, brokers and other institutions about future inflation, GDP, and other economic indica-tors. The data are collected online continuously from each institution and consolidated daily. The forecast of each institution is identified with a specific login ID. To encourage participation and improve the quality of forecasts, the central bank ranks institutions by the accu-racy of forecasts on a set of indicators and makes public the top 5 institutions. Participation on the survey is open to accredited insti-tutions by the central bank and requires the existence of a specialized team on macroeconomic forecasts. The system also requires the reg-ular update of forecasts. According to Gaglianone et al. (2017), the format of the Focus survey, especially with the ranking of institutions, contributes to the frequency of updating and accuracy of estimates.8 We use the median of inflation forecasts for the next 12 months since November 2003. Figure 2 shows cumulated inflation for the last 12 months and the inflation forecast for the same month made 12 months before. The Focus survey also provides the standard devia-tions of inflation forecasts. Figure 3 shows the standard deviadevia-tions together with the squared error of the projections, calculated as the square of the difference between cumulated inflation of the last 12 months and the forecast for the same month made 12 months ear-lier. The largest standard deviations and errors of the projections are concentrated in the initial period of the Focus survey.
Data on expectations about industrial production growth for the next 12 months were also obtained from the Focus survey. Industrial production is used as a proxy for aggregate demand because of the lack of availability of a weekly series suitable for economic activity as
8
More than 130 institutions have active logins. According to the central bank, most participants update forecasts weekly. Through the disclosure of the rankings, as the identities of the participants are not public, it can be observed that the survey includes the largest financial institutions in Brazil. It is expected that the survey includes most of the financial market in Brazil in terms of trading volume. Additional information about the Market Expectations System can be obtained from the Central Bank of Brazil, at http://www.bcb.gov.br/en/\#!/ n/marketexpec. See also Marques (2013).
2004 2006 2008 2010 2012 2014 2016 2 4 6 8 10 12 14 16 18 % p.a. Inflation Forecast Figure 2
Actual inflation and median inflation forecast for the next 12 months. Actual inflation from Economatica and inflation forecasts from the Focus survey.
2004 2006 2008 2010 2012 2014 2016 0 0.5 1 1.5 2 2.5 3 0 0.2 0.4 0.6 0.8 1 1.2 1.4 1.6 1.8 %
Std Dev Inflation (left) Quad Error (right)
Figure 3
Standard deviation of inflation forecasts for the next 12 months and quadratic error of the median forecast with respect to actual inflation. Standard deviation of forecasts from the Focus survey.
a whole. Figure 4 shows the percentage actual industrial production growth with respect to the same month of the previous year together with the growth forecast for the same month made 12 months be-fore. Market forecasts do not capture large variations in industrial production. Figure 5 shows the standard deviations of the forecasts along with squared errors.
2004 2006 2008 2010 2012 2014 2016 -20 -15 -10 -5 0 5 10 15 20 % p.a.
Ind Production Growth Forecast
Figure 4
Actual industrial production growth and median industrial production growth forecast for the next 12 months. Industrial production from the Focus survey
There is a substantial difference between the accuracy of the dustrial production growth forecasts and inflation forecasts. The in-flation forecasts have a mean squared error of 0.10 percent for the period. Industrial production growth forecasts, on the other hand, have a mean squared error of 0.53 percent. The average standard deviation of inflation forecasts is 0.48 and of industrial production growth forecasts 1.34. Because of the low accuracy of the Focus pro-jections for industrial production, we use Focus survey data for GDP in additional regressions.9
Data on earnings per share forecasts for the next 12 months and 9
The Focus survey reports GDP growth forecasts for each year. We obtain weekly forecast from the forecasts for the current and following years, taking into account the remaining number of weeks until the end of year and the number of weeks in the following year for each observation.
2004 2006 2008 2010 2012 2014 2016 0 0.5 1 1.5 2 2.5 3 3.5 0 0.5 1 1.5 2 2.5 3 3.5 4 4.5 5 %
Std Dev Ind Prod Growth (left) Quad Error (right)
Figure 5
Standard deviation of industrial production growth forecasts for the next 12 months and quadratic error of the median forecast with respect to the actual industrial production growth. Standard deviation of forecasts from the Focus survey.
for the Ibovespa target are from Bloomberg. Using EPS forecasts for Ibovespa, we capture the sell-side analysts estimates.10 We obtain the EPS forecasts for Ibovespa for the next 12 months by the average of EPS forecasts for each firm in the Ibovespa index, weighted by the participation of the firm in the index. The 12-month Ibovespa target, like the EPS, reflects the sell-side forecasts for fair value of each firm in the Ibovespa index. Data availability of these variables is relatively short. EPS data is available since July 2005 and the Ibovespa target since March 2004. Sharpe (2002) argues that the negative relation between equity valuations and expected inflation is the result of lower expected real earnings growth and higher required real returns. The earnings channel mostly reflects a negative relation between expected long-term earnings growth and expected inflation.
The Brazil 5-year CDS is used as a measure of risk for the domestic market. The CDS is a form of protection against default in the credit of an asset. The lender pays a premium to the CDS issuer and obtains
10
Buy-side analysts represent portfolio managers of investment funds, includ-ing pension funds. Sell-side analysts represent brokerage firms and investment banks willing to sell financial products. Sell-side analysts issue investment recom-mendations and disclose their projections to the market.
protection for risky events. With CDS, the risk of default, or non-payment of contractual obligations, is transferred from the creditor to the CDS issuer. We can then use CDS as the risk that the market assigns to a given issuer. For emerging markets the CDS is used as a proxy for the cost of capital, which directly affects the the valuation of listed assets.
The VIX is used as our measure of expected risk for international financial markets. The VIX is an index calculated by the Chicago Board Options Exchange (CBOE) and measures the implied volatility in the S&P 500 for the next 30 days. The VIX reflects prices at which investors are willing to buy and sell options on the S&P 500. It tends to move in the opposite direction of the stock market.11
3. Results and Discussion
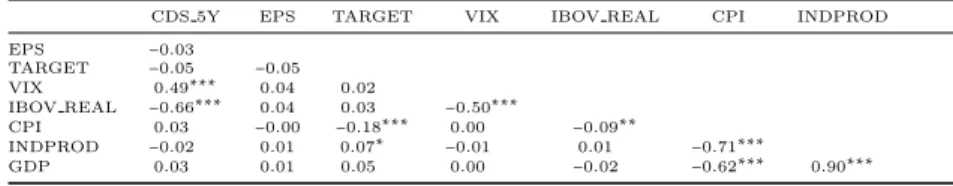
Table 1 shows the correlations of the variables studied. Real re-turns from Ibovespa are negatively correlated with inflation forecasts for the next 12 months, the VIX and the CDS. Real Ibovespa returns are positively correlated with industrial production growth forecasts, the Ibovespa target and EPS. The EPS forecast has negative corre-lations with the CDS and inflation forecasts, and positive correlation with the other variables.
Table 1
Correlations
CDS 5Y EPS TARGET VIX IBOV REAL CPI INDPROD
EPS −0.03 TARGET −0.05 −0.05 VIX 0.49∗∗∗ 0.04 0.02 IBOV REAL −0.66∗∗∗ 0.04 0.03 −0.50∗∗∗ CPI 0.03 −0.00 −0.18∗∗∗ 0.00 −0.09∗∗ INDPROD −0.02 0.01 0.07∗ −0.01 0.01 −0.71∗∗∗ GDP 0.03 0.01 0.05 0.00 −0.02 −0.62∗∗∗ 0.90∗∗∗
Brazil 5-year CDS (CDS 5Y), Ibovespa real returns (IBOV REAL), Ibovespa target for the next 12 months (TARGET), VIX index (VIX), Ibovespa EPS forecast for the next 12 months (EPS), median of CPI expectations for the next 12 months (CPI) from the Focus survey, expectations of industrial production growth for 12 months (INDPROD) and median for GDP growth for the next 12 months (GDP). Weekly observations. *, ** and *** indicate significance at the 10, 5 and 1 percent levels, respectively.
11
Baffes (1997) states that standard econometric techniques might not yield the expected results when the dependent variable is stationary but the regressors are non-stationary. Baffes proposes alternative techniques when this is the case. However, we did not find evidence of non-stationarity. In particular, the variables used as regressors, with the exception of the CDS and the VIX, are growth rates and returns; and these kinds of variables are usually stationary.
Table 2 shows the results of the main regressions using Ibovespa returns as dependent variable and a combination of the other ex-planatory variables. The estimated standard deviations are robust for heteroskedasticity.
Regression 1 has real returns of Ibovespa as dependent variable and, as explanatory variables, the median of CPI inflation forecasts and industrial production growth forecasts for the next 12 months. The regression does not show a statically significant relation between market returns and industrial production growth forecasts. Although not statistically significant, we did not expect a negative impact of in-dustrial production growth forecasts on Ibovespa, since it contradicts the positive correlation initially found in Table 1. More important for our purposes, regression 1 shows a negative and statistically sig-nificant relationship between market returns and expected inflation. The impact of a 1 percentage point increase in expected inflation for 12 months is associated with a decline of 0.42 percentage points in the weekly real return of Ibovespa.
Regression 2 has Brazil 5-year CDS, median CPI inflation fore-casts, VIX, and industrial production growth forecasts as explanatory variables. As above, the regression shows a negative and statistically significant relation between market returns and expected inflation. The impact of a 1 percentage point increase in expected inflation for the next 12 months is associated with a decline of 0.42 percentage points of weekly real returns of Ibovespa. As in Regression 1, we find a negative impact of industrial production growth forecasts. Regres-sion 2 also shows the importance of the VIX and CDS in explaining Ibovespa returns at a significance level of 1 percent.
Regression 3 is our main specification. We include all six vari-ables as explanatory varivari-ables. We observe a negative relation be-tween stock returns and inflation forecasts at a significance level of 1 percent. An increase of 1 percentage point in expected inflation for 12 months is associated with a decline of 0.57 percentage points in weekly real returns of Ibovespa. We observe a negative relation of industrial production growth forecasts with Ibovespa returns at a significance level of 1 percent, in line with the previous regressions. The impact of a 1 percentage point increase in expected industrial production for the next 12 months is associated with a decrease of 0.23 percentage points in weekly real returns of Ibovespa. Again, we
Table 2
Regressions for Ibovespa real returns
Regression 1 Regression 2 Regression 3 Regression 4
CPI −0.42∗∗ −0.42∗∗∗ −0.57∗∗∗ −0.55∗∗∗ s.d. 0.20 0.14 0.16 0.16 t-stat −2.13 −2.96 −3.56 −3.46 INDPROD −0.11 −0.15∗ −0.23∗∗∗ −0.22∗∗∗ s.d. 0.11 0.08 0.08 0.09 t-stat −1.03 −1.88 −2.66 −2.59 CDS 5Y −0.20∗∗∗ −0.19∗∗∗ −0.19∗∗∗ s.d. 0.02 0.02 0.02 t-stat −11.75 −10.87 −10.94 VIX −0.06∗∗∗ −0.05∗∗∗ −0.05∗∗∗ s.d. 0.01 0.01 0.01 t-stat −6.81 −6.42 −6.42 EPS 0.01∗∗∗ s.d. 0.00 t-stat 2.88 TARGET −0.03 s.d. 0.06 t-stat −0.43 Intercept 0.03∗∗ 0.03∗∗∗ 0.04∗∗∗ 0.04∗∗∗ s.d. 0.01 0.01 0.01 0.01 t-stat 2.09 3.22 3.87 3.77 Observations 683 683 598 598 R2 0.01 0.48 0.48 0.48
Regressions 1 and 2: 2001-2016. Regressions 3 and 4: 2005-2016. Weekly observations. Robust standard errors and covariance for heteroskedasticity. *, ** and *** indicate significance at the 10, 5 and 1 percent levels, respectively.
observe a negative impact of VIX and CDS in explaining Ibovespa re-turns at a significance level of 1 percent. The Target for 12 months of the Ibovespa does not show statistical significance and the EPS fore-casts for the next 12 months, despite being statistically significant, have a small economic impact on Ibovespa returns.12
Regression 4 uses the same variables as Regression 2 but with the number of observations and period of Regression 3. We observe again a statistically significant relationship between stock returns and all variables at a significance level of 1 percent. The most relevant impact comes from expected inflation, where an increase of 1 per-centage point is associated with a decline of 0.55 perper-centage points in the Ibovespa weekly real returns. We obtain a negative impact of industrial production growth forecasts, where an increase of 1 per-centage point is associated with a decrease of 0.22 perper-centage points in the Ibovespa weekly returns. The VIX index and the CDS also have negative impact on Ibovespa real returns, of 0.05 percent and 0.19 percent.
We respecified the four regressions above using Ibovespa real re-turns after two weeks as a dependent variable. Table 3 shows the results. The estimated coefficients for expected inflation and ex-pected industrial production are approximately two times the val-ues observed in the regressions using weekly variations as dependent variable. The impact of the VIX and CDS variables on Ibovespa real returns after two weeks is similar to the one observed for the weekly variations.
Despite the negative relation observed between expected inflation and weekly real returns of Ibovespa, a large component of the varia-tion of these weekly returns is a result of the inclusion of the 5-year CDS. This is observed from the impact on R2, which increases from 0.01 in Regression 1 to 0.48 after the inclusion of the 5-year CDS in
12
We include real bond yields in regression 3, in an additional analysis, using the yields from NTN-B inflation-indexed treasury bonds, with the interpolation method of Svensson (1994). We obtain similar results for all coefficients, and a non-significant coefficient for the NTN-B (t-stat −0.54). Sharpe (2002) finds that the coefficient for inflation is not significant anymore with the inclusion of real bonds. Here, the effect of inflation is maintained even with the inclusion of real bonds. For the coefficient on inflation expectations, we obtain −0.60 when we include real yields, still significant at the 1 percent level (s.d. −0.02 and t-stat of −2.92).
Table 3
Regressions for Ibovespa real returns two weeks ahead
Regression 5 Regression 6 Regression 7 Regression 8
CPI −0.82∗∗∗ −0.82∗∗∗ −1.16∗∗∗ −1.14∗∗∗ s.d. 0.26 0.22 0.26 0.25 t-stat 3.07 −3.68 −4.55 −4.51 INDPROD −0.22 −0.26∗ −0.42∗∗∗ −0.41∗∗∗ s.d. 0.15 0.14 0.15 0.15 t-stat −1.45 −1.87 −2.86 −2.82 CDS 5Y −0.16∗∗∗ −0.15∗∗∗ −0.15∗∗∗ s.d. 0.03 0.03 0.03 t-stat 3.74 −4.78 −4.74 VIX −0.06∗∗∗ −0.06∗∗∗ −0.06∗∗∗ s.d. 0.01 0.02 0.02 t-stat −4.24 −3.8 −3.83 EPS 0.01 s.d. 0.01 t-stat 0.97 TARGET −0.04 s.d. 0.10 t-stat −0.38 Intercept 0.05∗∗∗ 0.06∗∗∗ 0.08∗∗∗ 0.08∗∗∗ s.d. 0.02 0.01 0.02 0.02 t-stat 3.07 3.74 4.64 4.62 Observations 683 683 598 598 R2 0.01 0.22 0.22 0.22
Regressions 5 and 6: 2001-2016. Regressions 7 and 8: 2005-2016. Weekly observations. Robust standard errors and covariance for heteroskedasticity. *, ** and *** indicate significance at the 10, 5 and 1 percent levels, respectively.
Regression 2. Although it shows the highest coefficient, the contribu-tion of expectacontribu-tions to the weekly returns of Ibovespa is small. This is due to the difficulty of observing large variations in expectations on a weekly basis. On average, changes in expectations from one week to another are close to zero.
We investigate further the role of economic activity forecasts on Table 4. As discussed above, a negative impact from industrial pro-duction growth forecasts was not expected, given the positive corre-lation initially found in Table 1. These results (Table 2) might be a consequence of the low accuracy of the industrial production growth forecasts. We then replace the industrial production growth fore-casts with GDP growth forefore-casts. As shown in Table 4, GDP growth forecasts also shows a negative coefficient, similar to the coefficient previously calculated for industrial production. The impact of the VIX and CDS variables on Ibovespa returns are also similar to the observed in Table 2. Moreover, the estimated coefficients on expected inflation are close to the coefficient estimated previously.
Table 5 shows the results of the analysis whether expected infla-tion impacts analysts’ EPS forecasts (Regression 13). The regression has Ibovespa EPS forecasts for the next 12 months as dependent vari-able. The coefficients of the regression show the same signs as the cor-relations in Table 1, although not statistically significant. Expected inflation shows a positive coefficient, contrary to the observed in pre-vious regressions and contrary to the evidence in Sharpe (2002).13 However, the coefficient is not statistically significant. The evidence does not allow us to conclude that there is a relevant impact of ex-pected inflation on the Ibovespa analysts’ EPS forecast.
Mariani and Laurini (2017) shows that inflation expectations ob-tained from the breakeven inflation rate (the difference between nom-inal and real yields) tend to be more accurate than inflation
expecta-13
Sharpe (2002) study further the relation between stock returns and inflation by analyzing the long-run relation between stock returns, real bond yields and dividends, following the decomposition of Campbell and Shiller (1988a,b). Sharpe finds that the negative relation between expected inflation and equity returns can be explained by a negative correlation between expected inflation and expected real earnings growth and a positive correlation between inflation and higher equity real returns. Boucher (2006) uses the Campbell-Shiller decomposition to study the role of subjective inflation risk premium for the long-run relation between stock prices and inflation.
Table 4
Regressions for Ibovespa real returns
Regression 9 Regression 10 Regression 11 Regression 12
CPI −0.49∗∗∗ −0.39∗∗∗ −0.50∗∗∗ −0.49∗∗∗ s.d. 0.18 0.13 0.15 0.15 t-stat −2.73 −2.95 −3.41 −3.29 GDP −0.16∗ −0.11∗ −0.15∗∗ −0.14∗∗ s.d. 0.08 0.06 0.07 0.07 t-stat −1.90 −1.73 −2.24 −2.17 CDS 5Y −0.20∗∗∗ −0.19∗∗∗ −0.19∗∗∗ s.d. 0.02 0.02 0.02 t-stat −11.7 −10.76 −10.83 VIX −0.06∗∗∗ −0.05∗∗∗ −0.05∗∗∗ s.d. 0.01 0.01 0.01 t-stat −6.83 −6.44 6.44 EPS 0.01∗∗∗ s.d. 0.00 t-stat 2.92 TARGET −0.02 s.d. 0.06 t-stat Intercept 0.03∗∗∗ 0.03∗∗∗ 0.03∗∗∗ 0.03∗∗∗ s.d. 0.01 0.01 0.01 0.01 t-stat 2.91 3.29 3.74 3.63 Observations 683 683 598 598 R2 0.01 0.48 0.48 0.48
Regressions 9 and 10: 2001-2016. Regressions 11 and 12: 2005-2016. Weekly observations. Robust standard errors and covariance for heteroskedasticity. *, ** and *** indicate significance at the 10, 5 and 1 percent levels, respectively.
Table 5
Regressions for earnings per share
Regression 13 CPI 0.16 s.d. 0.63 t-stat 0.25 INDPROD 0.20 s.d. 0.21 t-stat 0.93 CDS 5Y −0.04 s.d. 0.05 t-stat −0.67 VIX 0.07 s.d. 0.08 t-stat 0.94 IBOV REAL 0.25 s.d. 0.26 t-stat 0.96 TARGET −0.41 s.d. 0.84 t-stat −0.49 Intercept −0.01 s.d. 0.04 t-stat −0.33 Observations 598 R2 0.01
Weekly observations, 2005-2016. Robust standard errors and covariance for heteroskedasticity.
tions obtained from the Focus survey. We then investigate our results when we substitute our measure of inflation expectations, from the Focus survey, with the breakeven inflation rate. The results are on Table 6, shown as regression 14. We include in the table our previous results with the Focus survey (regression 3) for direct comparison.
We use weekly real and nominal yields for Brazil from 2006 to 2016 for 12 months. We use LTN and NTN-F Brazilian Treasury bonds for nominal yields and the inflation-protected NTN-B Brazil-ian Treasury bonds for real yields.14 The dataset is from ANBIMA (Brazilian Financial and Capital Markets Association). We use the Svensson (1994) interpolation model to construct the term structure for nominal and real yields. The variable for the breakeven inflation rate is defined as the difference between the nominal and real yields with maturity 12 months ahead.15
As shown on Table 6, using the breakeven inflation rate does not change our results. We still find a negative and highly significant coefficient for the coefficient related to inflation expectations. The coefficient decreases in absolute value from −0.57 to −0.35 when we substitute the regressor from the Focus survey expectations with the breakeven inflation rate. In addition to being statistically significant, the coefficient is still economically significant. A decrease of 1 per-centage point in expected inflation for 12 months is associated with an increase of 0.35 percentage points in the weekly real return of Ibovespa. Moreover, the coefficients of the other regressions change little when we use the breakeven inflation rate as regressor. This re-sult shows the same trend that we observed in our regressions using the median of CPI inflation forecasts from the Focus survey for the next 12 months.16
14
LTN and NTN-F are nominal bonds. LTN bonds are zero-coupon bonds and NTN-F bonds have semi-annual coupon payments. The NTN-B bonds are linked to the IPCA index for inflation. The CPI forecasts of the Focus survey in our regressions are also for the IPCA index.
15
The breakeven inflation rate can be decomposed into inflation expectations, risk premium and liquidity premium. Here, we observe the breakeven inflation rate and assign changes in the breakeven rate to changes in inflation expectations. See Mariani and Laurini (2017) for the decomposition of the breakeven inflation into implicit inflation and risk premium and additional discussion. See also Mariani and Laurini for a description of the fixed income market in Brazil and for the relevance of the NTN-B bonds to obtain inflation expectations for the IPCA.
16
ad-Table 6
Regressions for Ibovespa real returns: inflation expectations and breakeven inflation rate
Regression 3 Regression 14 CPI −0.57∗∗∗ s.d. 0.16 t-stat −3.56 BEIR −0.35∗∗∗ s.d. 0.12 t-stat −3.02 INDPROD −0.23∗∗∗ −0.20∗∗ s.d. 0.08 0.09 t-stat −2.66 −2.28 CDS 5Y −0.19∗∗∗ −0.19∗∗∗ s.d. 0.02 0.02 t-stat −10.87 −10.34 VIX −0.05∗∗∗ −0.05∗∗∗ s.d. 0.01 0.01 t-stat −6.42 −6.30 EPS 0.01∗∗∗ −0.01 s.d. 0.00 0.01 t-stat 2.88 −0.15 TARGET −0.03 0.02 s.d. 0.06 0.11 t-stat −0.43 0.16 Intercept 0.04∗∗∗ 0.03∗∗∗ s.d. 0.01 0.01 t-stat 3.87 3.23 Observations 598 575 R2 0.48 0.49
CPI: inflation expectations from the Focus survey. BEIR: breakeven inflation rate. Regression 14 sub-stitutes the inflation forecasts from the Focus survey with the breakeven inflation rate. Regression 3 is repeated from Table 2 to facilitate direct comparison. Weekly observations. Robust standard errors and covariance for heteroskedasticity. *, ** and *** indicate significance at the 10, 5 and 1 percent levels, respectively.
Given the evidence of negative relation between stock market re-turns and expected inflation, we simulate a portfolio that takes into account inflation forecasts from the Focus survey as selection crite-rion. The portfolio has two allocation options: equity income, repre-sented by Ibovespa returns, or fixed income, reprerepre-sented by IRF-M 1 returns. The IRF-M 1 is an index of the value of a fixed-income portfolio of Brazilian nominal treasury bonds LTN and NTN-F with maturities less than one year.
The decision to allocate to equity or fixed income is taken weekly and based on inflation forecasts for 12 months from the Focus survey. At the end of each week, we compare the median inflation forecast for the next 12 months with the median forecast of the previous week. If there is an increase in inflation forecasts, the entire portfolio is invested in fixed income. If inflation forecasts remain constant or fall, the entire portfolio is invested in equity. We analyze the period between November 2003 and December 2016. As we do for the Ibovespa returns, we deflate the IRF-M 1 returns with the CPI.17 Figure 6 shows the results of the strategy. The figure shows cu-mulated real returns for the strategy together with cucu-mulated real returns for the IRF-M 1 index and for Ibovespa. The strategy implies cumulated real returns of 135 percent while cumulated real IRF-M 1 returns are 119 percent and Ibovespa real returns are 48 percent. The strategy implies a cumulated profitability higher than the Ibovespa in 69 percent of the period and higher than that of the IRF-M 1 in 96 percent of the period.18
4. Conclusions
We find evidence that expected inflation is negatively related with Ibovespa real returns. An increase of 1 percentage point in expected ditional analysis, using the yields from the NTN-B. Also for this case, we obtain similar results for all coefficients and a non-significant coefficient for the NTN-B (t-stat −0.32). When we include real yields, we obtain −0.37 for the coefficient on the breakeven inflation rate. Higher in absolute value in comparison with the regression without the NTN-B, and still significant at the 1 percent level (s.d. −0.13 and t-stat of −2.83).
17
Both assets would be taxed by their capital gains, with similar tax rates. Transaction costs would also be similar, as the assets considered are highly liquid. 18We obtain similar results when we use the CDI rates for the fixed income component.
2004 2006 2008 2010 2012 2014 2016 -50 0 50 100 150 200 250 real returns, % Simulated portfolio IRF-M 1 Ibovespa Figure 6
Cumulated real returns of the simulated portfolio with strategy based on changes in inflation forecasts, and cumulated real returns of IRF-M 1 and Ibovespa. Returns deflated by the CPI (IPCA). The IRFM 1 is the index of nominal treasury bonds with less than 1-year maturity. The cumulated real returns of the simulated portfolio is higher than the cumulated real returns of Ibovespa in 69 percent of the period. CPI from Economatica and and IRF-M 1 from Anbima.
inflation for the next 12 months is associated with a 0.57 percentage point decline in weekly Ibovespa real returns.19 We also find that the Brazil 5-year CDS and the VIX index negatively influence Ibovespa real returns respectively by 0.05 and 0.19 percentage points. This result is compatible with the sensitivity of the capital market in Brazil to capital flows.
We simulate a portfolio using changes in inflation forecast from the Focus survey as selection criterion. The strategy of the portfolio manager in the simulation is to sell the position in equity and reallo-cate the amount in short-term fixed income if inflation expectations increase. When inflation expectations decrease, the strategy is to sell the position on fixed income and repurchase equity. For the period from November 2003 to December 2016, the simulated portfolio has cumulated returns higher than Ibovespa cumulated returns in 69 per-cent of the period, and higher than the IRF-M 1 cumulated returns in 96 percent of the period. These results reinforce the evidence that in-flation is an important component in the decision-making of investors and portfolio managers.
References
Ang, A., Bri`ere, M., and Signori, O. (2012). Inflation and individual equities. Financial Analysts Journal, 68(4):35–55.
Baffes, J. (1997). Explaining stationary variables with non-stationary regressors. Applied Economics Letters, 4(1):69–75.
Boucher, C. (2006). Stock prices–inflation puzzle and the predictabil-ity of stock market returns. Economics Letters, 90(2):205–212. Bri`ere, M. and Signori, O. (2013). Hedging inflation risk in a
de-veloping economy: The case of Brazil. Research in International Business and Finance, 27(1):209–222.
Campbell, J. Y. and Shiller, R. J. (1988a). The dividend-price ratio and expectations of future dividends and discount factors. The Review of Financial Studies, 1(3):195–228.
19
When the breakeven inflation rate is used as the measure for inflation ex-pectations, a 1 percentage point increase in expected inflation is associated to a decrease of 0.35 percentage point of Ibovespa real returns.
Campbell, J. Y. and Shiller, R. J. (1988b). Stock prices, earnings, and expected dividends. The Journal of Finance, 43(3):661–676. Campbell, J. Y. and Vuolteenaho, T. (2004). Inflation illusion and
stock prices. The American Economic Review, 94(2):19–23. Doi, J., Fernandes, M., and Nunes, C. V. A. (2017). Disagreement
in inflation forecasts and inflation risk premia in Brazil. Brazilian Review of Econometrics, 37(1):45–59.
Downing, C. T., Longstaff, F. A., and Rierson, M. A. (2012). Infla-tion tracking portfolios. Working Paper 18135, NaInfla-tional Bureau of Economic Research.
Fama, E. F. (1981). Stock returns, real activity, inflation, and money. The American Economic Review, 71(4):545–565.
Fama, E. F. and Schwert, G. W. (1977). Asset returns and inflation. Journal of Financial Economics, 5(2):115–146.
Feldstein, M. (1980). Inflation and the stock market. The American Economic Review, 70(5):839–847.
Gaglianone, W. P., Giacomini, R., Issler, J. V., and Skreta, V. (2017). Incentive-driven inattention. Working Paper.
Geske, R. and Roll, R. (1983). The fiscal and monetary linkage be-tween stock returns and inflation. The Journal of Finance, 38(1):1– 33.
Mariani, L. A. and Laurini, M. P. (2017). Implicit inflation and risk premiums in the Brazilian fixed income market. Emerging Markets Finance and Trade, 53(8):1836–1853.
Marques, A. B. C. (2013). Central Bank of Brazil’s market expecta-tions system: a tool for monetary policy. In Settlements, B. f. I., editor, Proceedings of the Sixth IFC Conference, volume 36, pages 304–324. Bank for International Settlements.
Nunes, M. S., da Costa, Jr., N. C. A., and Meurer, R. (2005). A rela¸c˜ao entre o mercado de a¸c˜oes e as vari´aveis macroeconˆomicas: Uma an´alise econom´etrica para o Brasil. Revista Brasileira de Economia, 59(4):585–607.
Piazzesi, M. and Schneider, M. (2007). Equilibrium yield curves. In NBER Macroeconomics Annual 2006 vol 21, pages 389–472. Na-tional Bureau of Economic Research.
Piazzesi, M. and Schneider, M. (2012). Inflation and the price of real assets. Working Paper.
Rigobon, R. and Sack, B. (2003). Measuring the reaction of monetary policy to the stock market. The Quarterly Journal of Economics, 118(2):639–669.
Schwert, G. W. (1990). Stock returns and real activity: A century of evidence. The Journal of Finance, 45(4):1237–1257.
Sharpe, S. A. (2002). Reexamining stock valuation and inflation: The implications of analysts’ earnings forecasts. The Review of Economics and Statistics, 84(4):632–648.
Svensson, L. E. (1994). Estimating and interpreting forward interest rates: Sweden 1992 - 1994. Working Paper 4871, National Bureau of Economic Research.
Vicente, J. V. M. and Guillen, O. T. C. (2013). Do
inflation-linked bonds contain information about future inflation? Revista Brasileira de Economia, 67(2):251–260.