MASTER OF SCIENCE IN MECHANICAL ENGINEERING
EXTRACTION OF PLASTICITY PARAMETERS OF
METALLIC MATERIALS FROM SPHERICAL
INDENTATION TESTS AND FEM MODELLING
BY
LUCAS QUEIROZ MACHADO
UNIVERSITY OF BRASÍLIA
FACULTY OF TECHNOLOGY
UNIVERSITY OF BRASÍLIA
FACULTY OF TECHNOLOGY
MECHANICAL ENGINEERING DEPARTMENT
MASTER OF SCIENCE IN MECHANICAL ENGINEERING
EXTRACTION OF PLASTICITY PARAMETERS OF
METALLIC MATERIALS FROM SPHERICAL
INDENTATION TESTS AND FEM MODELLING
A Dissertation
Presented to
The Faculty of Technology
by
Lucas Queiroz Machado
In Partial Fulfillment
of the Requirements for the Degree of
Master of Science in Mechanical Engineering
at the
UNIVERSITY OF BRASÍLIA / MECHANICAL ENGINEERING DEPARTMENT
PUBLICAÇÃO: ENM.DM - 300/2019
BRASÍLIA-DF: JANUARY - 2019
UNIVERSITY OF BRASÍLIA
FACULTY OF TECHNOLOGY
MECHANICAL ENGINEERING DEPARTMENT
MASTER OF SCIENCE IN MECHANICAL ENGINEERING
EXTRACTION OF PLASTICITY PARAMETERS OF
METALLIC MATERIALS FROM SPHERICAL
INDENTATION TESTS AND FEM MODELLING
Approved by:
Prof. Lucival Malcher, DSc. - Supervisor
ENM-FT-UnB
University of Brasília
Prof. Luciano Mendes Bezerra, Ph.D. - External Examiner
ENC-FT-UnB
University of Brasília
Prof. Fábio Comes de Castro, DSc. - Internal Examiner
ENM-FT-UnB
University of Brasília
FICHA CATALOGRÁFICA
REFERÊNCIA BIBLIOGRÁFICA
MACHADO, L. Q (2019). Extraction of Plasticity Parameters of Metallic Materials from Spherical Indentation Tests and FEM Modelling. Dissertação de Mestrado em Ciências Mecânicas, Publicação ENM.DM – 300/2019, Departamento de Engenharia Mecânica, Universidade de Brasília, DF, 84p.
CESSÃO DE DIREITOS
AUTOR: Lucas Queiroz Machado.
TÍTULO: Extraction of Plasticity Parameters of Metallic Materials from Spherical Indentation
Tests and FEM Modelling.
GRAU: Mestre
ANO: 2019
É concedida à Universidade de Brasília permissão para reproduzir cópias desta dissertação de mestrado e para emprestar ou vender tais cópias somente para propósitos acadêmicos e científicos. O autor reserva outros direitos de publicação e nenhuma parte dessa dissertação de mestrado pode ser reproduzida sem autorização por escrito do autor.
Lucas Queiroz Machado [email protected]
BRASÍLIA-DF MACHADO, LUCAS QUEIROZ
EXTRACTION OF PLASTICITY PARAMETERS OF METALLIC MATERIALS FROM SPHERICAL INDENTATION TESTS AND FEM MODELLING.
xvii, 84p., 210 x 297 mm (ENM/FT/UnB, Mestre, Ciências Mecânicas, 2019) Dissertação de Mestrado – Universidade de Brasília, Faculdade de Tecnologia. Departamento de Engenharia Mecânica.
1. Indentation Test 2. Parameter Identification 3. Multi-Image Analysis 4. Stress-Strain Curve 5. Optimization Process 6. Inverse Method I. ENM/FT/UnB II. Título (série)
ACKNOWLEDGEMENTS
I would like to thank God for guiding my path and giving me much more than I can ask or imagine. I would like to express my very great appreciation to my supervisor Professor Lucival Malcher for his guidance, enthusiastic encouragement, and all the opportunities that he created to benefit me.
My special thanks to my parents Antonio Machado and Maria José Machado for all the support, counseling, and for always being close to me.
I would like to thank my dear girlfriend for all her love, encouragement, help, and for making this trajectory more enjoyable.
I would like to thank my siblings Fernanda, Jeftali, Suzana, Cecília, Júlio, and Pedro for always having a great expectation about me and giving their best to help me.
I am particularly grateful for the assistance provided by Professor Thiago Doca for his valuable and constructive suggestions on the development of the FEM model.
I would like to thank MSc Leonel Morales and UDF for providing and manufacturing some of the specimens used in this work.
I wish to thank B.Eng. Pedro Rocha, MSc. Guilherme Ferreira, MSc. Felipe Canut, MSc Raniere Neves, MSc. Maycol Coutinho, and MSc. Cainã de Barros for all their help and constructive recommendations on this project.
I would also like to extend my thanks to the technicians of the laboratory for their help in processing the samples.
I wish to thank my church family, the SDA Ponte Alta Norte-DF, for all the prayers.
iv
TABLE OF CONTENTS
LIST OF TABLES
vi
LIST OF FIGURES
vii
LIST OF SYMBOLS AND ABBREVIATIONS
xi
Abstract
xiv
Resumo
xv
CHAPTER 1.
INTRODUCTION
1
Background and motivation
1
Research Aims
3
Outline
3
CHAPTER 2.
ELASTIC-PLASTIC CONTACT
5
Hertzian Contact
5
Post-yielding contact in metals
9
Representative stress
11
Indentation Response
13
2.4.1
Shallowing effect
13
2.4.2
Piling-up and sinking-in
15
2.4.3
Influence of the hardening exponent and friction on profile geometry and
loading-unloading curve
16
2.4.4
Determination of the contact radius from indentation morphology
18
Non-linear mathematical models for material hardening
20
Constitutive formulation
20
Parameter Identification
23
CHAPTER 3.
EXPERIMENTAL PROCEDURES
25
Uniaxial Tensile Test
25
3.1.1
Specimen
25
3.1.2
Data acquisition
26
3.1.3
Parameter identification
30
Brinell Indentation Hardness Test
32
3.2.1
Specimen
33
3.2.2
Data acquisition
33
CHAPTER 4.
NUMERICAL APPROACH
37
Part Module
37
Property Module
38
Assembly Module
38
Step Module
39
Interaction Module
39
4.5.1
Contact Formulation.
40
4.5.2
Contact Constraint Enforcement Methods.
43
4.5.3
Constraints
44
Load Module
45
Mesh Module
45
v
CHAPTER 5.
EMPIRICAL CORRELATION OF SPHERICAL INDENTATION TESTS
TO STRESS-STRAIN DATA
49
Representative stress-strain curves by spherical indentation
49
5.1.1
Determining the contact parameters from FEM analysis for the SAE 1524
50
5.1.2
Determining the contact parameters from measurements of experimental indentation
profiles
52
5.1.3
Defining the true stress-strain relationship
53
CHAPTER 6.
ASSESSMENT
OF
INDENTATION
HARDNESS
TESTS
FOR
EXTRACTION OF PLASTICITY PARAMETERS OF METALLIC MATERIALS
58
Extraction of plasticity parameters from indentation load-depth curve.
59
6.1.1
Parameter identification
60
Extraction of plasticity parameters from indentation profiles.
65
6.2.1
Parameter identification
66
Comparative Analysis
70
CONCLUSION
72
APPENDIX A. User-friendly interface
74
APPENDIX B. Optimization Routine
78
vi
LIST OF TABLES
Table 1: Empirically obtained non-linear mathematical models for material hardening. ... 20
Table 2. Elastic Properties of the Specimens. ... 28
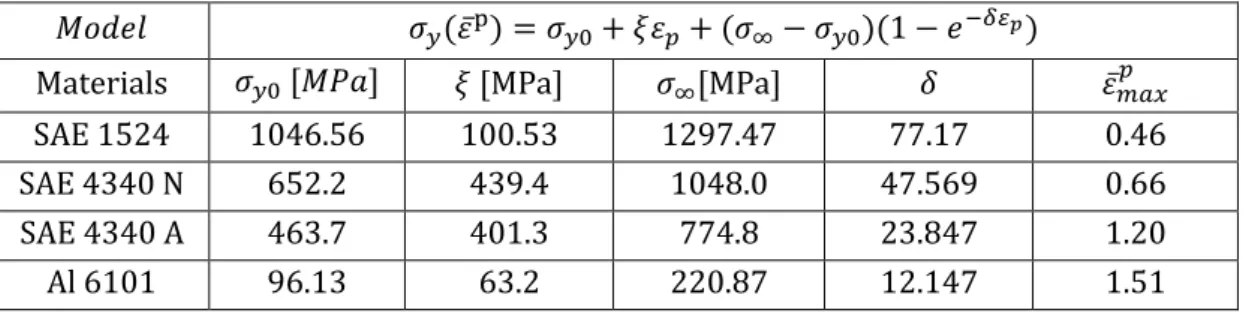
Table 3. Material parameters obtained from the numerical inverse optimization process for
Kleinermann-Ponthot’s model. ... 30
Table 4. Mean values for final indentation depth and radius. ... 35
Table 5. Element types description. ... 46
Table 6. Representative stress-strain relationship calculated from Brinell hardness tests for the
SAE 1524. ... 53
Table 7. Representative stress-strain relationship calculated from Brinell hardness tests for the
SAE 4340 N ... 54
Table 8. Representative stress-strain relationship calculated from Brinell hardness tests for the
SAE 4340 A ... 54
Table 9. Representative stress-strain relationship calculated from Brinell hardness tests for the
Aluminum 6101 ... 54
Table 10. Material parameters obtained from the numerical inverse optimization process based
on the indentation reaction curve. ... 61
Table 11. Error in the prediction of indentation profiles from stress-strain relationship obtained
by tensile test (TT) approach and by indentation reaction curve (IRC) approach. ... 63
Table 12. Error in the prediction of indentation profiles from stress-strain relationship obtained
by tensile test (TT) approach and by indentation profile (IP) approach. ... 69
Table 13. Material parameters obtained from the numerical inverse optimization process based
on the indentation reaction curve. ... 70
vii
LIST OF FIGURES
Figure 1 Contact of two spheres. (Hills, Nowell and Sackfield, 1993). ... 5
Figure 2. Contours of the von Mises equivalent stress for the spherical Hertzian contact. ... 8
Figure 3. Internal stresses along the axis of symmetry (r = 0) for the Hertzian pressure
distribution. ... 8
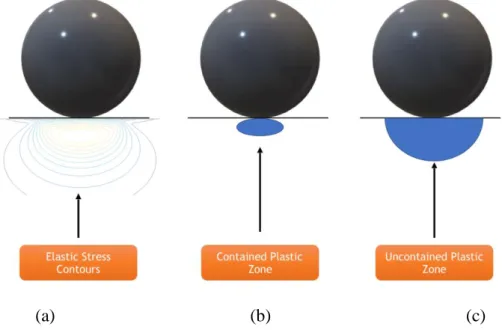
Figure 4. Evolution of plastic zone for ball indentation in three regimes: (a) elastic, (b)
elastic-plastic, and (c) fully plastic. Adapted from Ahn and Kwon (2001). ... 10
Figure 5. Ball indentation of a surface and influence of the angle 𝜷. ... 10
Figure 6. Schematic correlation of spherical indentation testing of elastic-plastic materials
proposed by Johnson (1970, 1985). Adapted from Olsson and Larsson (2013) ... 11
Figure 7. Variation of the yield stress along the indentation area ... 12
Figure 8. Hardening curve obtained from hardness measurements. Adapted from Li et al .... 13
Figure 9. Unloading a spherical indenter. Adapted from Johnson ... 14
Figure 10. Indentation load-displacement data. ... 14
Figure 11. Spherical indentation contact geometry.Adapted from Taljat and Pharr ... 15
Figure 12. Influence of contact friction on unloaded indentation profile considering (a) an
elastic perfectly plastic behavior and (b) an elastic strain-hardening-plastic material with
𝒏 =
𝟎. 𝟓 for six different friction coefficients: 𝟎. 𝟎, 𝟎. 𝟏, 𝟎. 𝟐, 𝟎. 𝟑, 𝟎. 𝟓 and 𝟏. 𝟎. ... 17
Figure 13. Effect of friction on the indentation loading-unloading curve. ... 17
Figure 14. Distribution of effective plastic strain on the axis of symmetry beneath the indenter
for an elastic-perfectly plastic material. with 𝑬/𝝈𝒚 = 𝟐𝟎𝟎. ... 18
Figure 15. Optimization Approach. ... 24
Figure 16: MTS with Clip Gauge Used for Tensile Test. ... 26
Figure 17. Reaction curves produced by uniaxial tension tests for the SAE 1524, SAE 4340
normalized and SAE 4340 annealed. ... 27
Figure 18. Reaction curve produced by uniaxial tension tests for the SAE 1524 in terms of the
strain provided by the clip gauge. ... 27
Figure 19. Engineering stress-strain relationship. ... 28
Figure 20. Engineering and true stress-strain relationships. ... 29
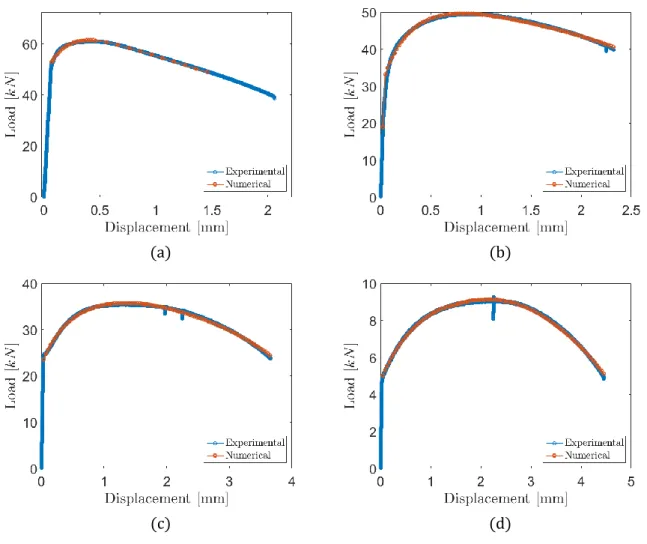
Figure 21. Reaction curve fitting provided by the optimization procedure to determine the
optimum plasticity parameters for the (a) SAE 1524, (b) SAE 4340 N, (c) SAE 4340 A, and (d)
Aluminium 6101. ... 31
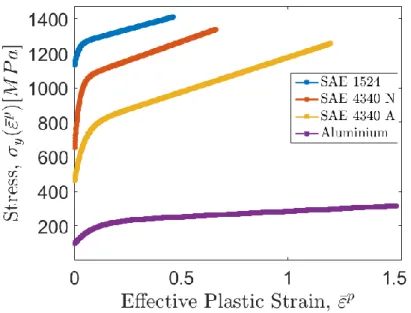
Figure 22. Hardening curves determined from the uniaxial tensile test ... 32
viii
Figure 23. Specimens: (a) SAE 1524, (b) 4340 N, (c) 4340 A, and (d) Aluminum 6101. ... 33
Figure 24. Zwick/Roell ZHU250 Universal Hardness Machine. ... 34
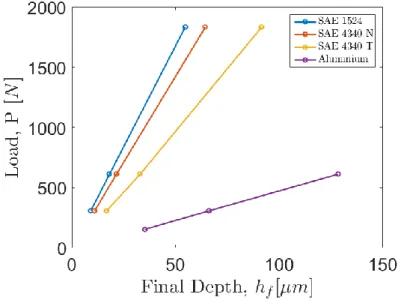
Figure 25. Experimental Indentation reaction data from Brinell Hardness tests for three different
loads applied to the materials under analysis. ... 34
Figure 26: Images from LEXT OLS4100 of the impression left in the specimen after indentation
test for a steel alloy. (a) 2D Top view; (b) 3D view. ... 35
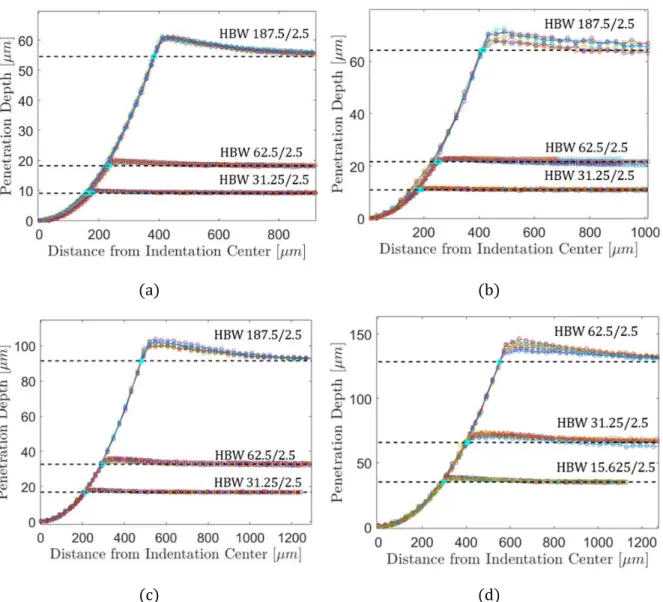
Figure 27. Resultant indentation profiles from Brinell hardness tests for the (a) SAE 1524, (b)
SAE 4340 N, (c) SAE 4340 A, and (d) Aluminium 6101. ... 36
Figure 28. (a) Indenter; (b) Specimen. ... 37
Figure 29. Contact configuration ... 38
Figure 30. Contact pressure response from surface-to-surface (a) and node-to-surface (b)
contact discretization methods. ... 40
Figure 31. Contact pressure error for each node along indentation. ... 41
Figure 32. Contact pressure error for each node along indentation for finite and small sliding
tracking approach. ... 42
Figure 33. Material's response to applied load for finite and small sliding. ... 42
Figure 34. Tie constraints applied to the indenter (a) and the specimen (b) ... 44
Figure 35. Coupling constraints applied to the indenter (a) and to the specimen (b). ... 45
Figure 36. Meshing Assignment. ... 46
Figure 37. Mesh Convergence analysis in terms of plastic strain (a), von Mises equivalent stress
(b) and CPU time (c). ... 47
Figure 38: Optimization Process. ... 48
Figure 39. Predicted indentation profile parameters at a load of 187.5 kgf for SAE 1524. ... 50
Figure 40. Predicted indentation profile parameters after unloading for (a) 187.5 kgf, (b) 62.5,
and (c) 31.25 for SAE 1524. ... 51
Figure 41. Experimental profiles and contact parameters for (a) SAE 1524, (b) SAE 4340 N,
(c) SAE 4340 A, and (d) Aluminium 6101. ... 52
Figure 42. Representative stress-strain points
(𝚿 = 𝟑. 𝟎) plotted in comparison with the
hardening curve obtained from tensile tests. ... 55
Figure 43. Representative stress-strain points
(𝚿 = 𝟐. 𝟖) plotted in comparison with the
hardening curve obtained from tensile tests. ... 55
Figure 44. Representative stress-strain points plotted in comparison with the hardening curve
obtained from tensile tests for SAE 4340 N. ... 56
Figure 45. Representative stress-strain points plotted in comparison with the hardening curve
obtained from tensile tests for SAE 4340 A. ... 56
ix
Figure 46. Representative stress-strain points plotted in comparison with the hardening curve
obtained from tensile tests for Aluminum 6101. ... 57
Figure 47. Inverse problem. ... 59
Figure 48. (a) Typical indentation loading-unloading curve and (b) adopted response for
simulation. ... 60
Figure 49. Reaction curves obtained numerically in comparison with experimental data for (a)
SAE 1524, (b) SAE 4340 N, (c) SAE 4340 A, and (d) Aluminium 6101. ... 61
Figure 50: Comparison between hardening curves obtained from uniaxial tensile test and
inverse method using the indentation reaction curve for (a) SAE 1524, (b) SAE 4340 N, (c)
SAE 4340 A, and (d) Aluminium 6101. ... 62
Figure 51. Predicted indentation profiles generated through the parameters generated from the
tensile test (yellow), the indentation method (orange) in comparison with the experimental
profiles (blue) for the SAE 1524. ... 63
Figure 52. Predicted indentation profiles generated through the parameters generated from the
tensile test (yellow), the indentation method (orange) in comparison with the experimental
profiles (blue) for the SAE 4340 N. ... 64
Figure 53. Predicted indentation profiles generated through the parameters generated from the
tensile test (yellow), the indentation method (orange) in comparison with the experimental
profiles (blue) for the SAE 4340 A. ... 64
Figure 54. Predicted indentation profiles generated through the parameters generated from the
tensile test (yellow), the indentation method (orange) in comparison with the experimental
profiles (blue) for the Aluminum 6101. ... 65
Figure 55. (a) Typical indentation loading-unloading curve and (b) adopted response for
simulation. ... 66
Figure 56. Predicted indentation profiles generated through the parameters generated from the
tensile test (yellow), the indentation method (orange) in comparison with the experimental
profiles (blue) for the SAE 1524. ... 67
Figure 57. Predicted indentation profiles generated through the parameters generated from the
tensile test (yellow), the indentation method (orange) in comparison with the experimental
profiles (blue) for the SAE 4340 N. ... 67
Figure 58. Predicted indentation profiles generated through the parameters generated from the
tensile test (yellow), the indentation method (orange) in comparison with the experimental
profiles (blue) for the SAE 4340 A. ... 68
x
Figure 59. Predicted indentation profiles generated through the parameters generated from the
tensile test (yellow), the indentation method (orange) in comparison with the experimental
profiles (blue) for the Aluminum 6101. ... 68
Figure 60. Comparison between hardening curves obtained from uniaxial tensile test and
inverse method using the indentation profile for (a) SAE 1524, (b) SAE 4340 N, (c) SAE 4340
A, and (d) Aluminium 6101. ... 69
Figure 61. User interface. ... 74
Figure 62. Experiment configuration input. ... 75
Figure 63. Experimental profile data input. ... 75
Figure 64. Selecting text files with the coordinates of the measured indentation profiles. ... 76
Figure 65. Material definition input. ... 76
Figure 66. Save data and submit analysis buttons. ... 77
xi
LIST OF SYMBOLS AND ABBREVIATIONS
Latin Letters
𝐴
0Initial cross-sectional area
𝐴
𝑖Current cross-sectional area
𝑎
𝑐Contact radius
𝑎
𝑝Plastic radius
𝐶
Indentation loading constant
𝑐
Pile-up/sink-in indicator
𝐷
Indenter diameter
𝑑
Approach of two remote points
𝑑
𝑖Indentation diameter
𝔻
Elastic modulus tensor
𝐸
Young’s modulus
𝐸
𝑒𝑞Equivalent Young’s modulus
𝑓(𝒑)
Objective function
𝑯
Generalized hardening modulus
𝑯
𝑘Hessian matrix
𝐻
Hardening modulus
ℎ
Indentation depth
ℎ
𝑓Final indentation depth
ℎ
𝑚𝑎𝑥Maximum indentation depth
ℎ
𝑟Surface displacement
𝐼
1, 𝐼
2, 𝐼
3Stress tensor invariants
𝐽
1, 𝐽
2, 𝐽
3Deviatoric stress tensor invariants
𝑚
Indentation loading constant
𝑚
𝑘Objective function model
𝐍
Flow vector
𝑛
Hardening exponent
𝑃
Applied load
𝑃
𝑌Load associated with initial yielding
𝑃
𝑚𝑎𝑥Applied maximum load
xii
𝑝
Pressure distribution
𝒑
Parameters
𝑝
0Peak contact pressure
𝑝
0𝑌Peak contact pressure associated with initial yielding
𝑅
𝑒𝑞Equivalent radius
𝑹
𝑖𝐹𝐸𝑀FEM response
𝑹
𝑖𝐸𝑋𝑃Experimental response
𝑟
Radial coordinate
𝑺
Deviatoric stress tensor
𝑆
Indentation unloading stiffness
𝒔
Trial step of the optimization problem
𝑠
Pile-up/sink-in height
𝑊
𝑝Plastic work
Greek Letters
𝛽
Indentation contact angle
Γ
Johnson parameter
𝛾̇
Plastic multiplier
𝜺
Strain tensor
𝜺
𝑒Elastic strain tensor
𝜺
𝑝Plastic strain tensor
𝜺
𝑑𝑒Deviatoric strain tensor
𝜀
𝑣𝑒Volumetric strain
𝜀̅
𝒑Effective (or accumulated) plastic strain
𝜀
𝑟𝑒𝑝Representative strain
𝜀
Engineering strain
𝜀̅
True strain
𝜇
Friction coefficient
𝝈
Cauchy stress tensor
𝜎
1, 𝜎
2𝑒 𝜎
3Principal stresses
𝜎
𝑥𝑥, 𝜎
𝑦𝑦, 𝜎
𝑧𝑧Stress components
𝜎
𝑦Yield stress
xiii
𝜎
𝑟𝑒𝑝Representative stress
𝜎
𝑒𝑞von Mises equivalent stress
𝜎
Engineering stress
𝜎̅
True stress
𝜎
𝑦0, 𝜉, 𝜎
∞, 𝛿
Kleinermann-Ponthot’s hardening parameters
𝜐
Poisson’s ratio
Φ
Yield function
Ψ
Plastic constraint factor
Λ
Flow potential
𝛺
𝑘Trust region
Acronyms
ABNT
Associação Brasileira de Normas Técnicas
ASTM
American Society for Testing and Materials
CAX4R
4-node bilinear axisymmetric quadrilateral, reduced integration, hourglass
control
CAX4
4-node bilinear axisymmetric quadrilateral
IRC
Indentation Reaction Curve approach
xiv
ABSTRACT
The plastic behavior of a metallic material is resultant of non-linearities which leads to complex stress-strain fields, making it difficult to devise analytical relationships beyond the elastic domain. Traditionally, the material’s stress-strain relationship has been acquired from uniaxial testing, which is widely used to describe its behavior under plastic deformation. However, there are samples that due to their configurations cannot be tested using the uniaxial tensile test. Furthermore, the hardness test is more versatile, operative, cheaper, and faster than the uniaxial test. When it comes to traditional hardness tests, such as in the Brinell, Knoop, Rockwell, and Vickers, they have been mostly used as a way to assess the capability a material has to resist plastic deformation. They relate the applied load to the resultant area or depth of indentation impressed in the material. The technique developed and presented here has gone beyond that by determining other material properties in addition to hardness. Therefore, this work presents two approaches to describe the hardening behavior of metallic materials from indentation hardness tests. The Brinell hardness test is the chosen method due to its simplicity and versatility. The methodology consists of performing three Brinell hardness tests in three distinct configurations, to have a representative material’s response. A multi-image analysis of the indention impressions is performed in a confocal laser microscope, providing the experimental indentation responses. They are obtained to be a reference which with the predicted output of repeated FEM modeling is compared. In this process, several trial stress-strain curves are provided to minimize the discrepancy between numerical and experimental data in an iterative FEM modeling of the indentation process. The process runs until reaching the established tolerance and thus providing the hardening parameters that best fit the experimental data. As mentioned, two approaches were developed. The first, designated as Indentation Reaction Curve (IRC) approach, numerically replicates the load-final depth response of an experimental indentation test. The second, designated as Indentation Profile (IP) approach, numerically replicates the same indentation impressions left in the specimen by the indenter in an experimental indentation test. To facilitate the use of this resource by other users, a user-friendly interface was also built. A tutorial on how to use it is included in APPENDIX A. Lastly, the hardening curves obtained from uniaxial tests and the approaches presented here are compared. Four materials were analyzed: the SAE 1524, SAE 4340 A (annealed), SAE 4340 N (normalized), and Aluminum 6101. Their parameters were determined by IRC, IP, and tensile test approaches. However, with exception for the SAE 1524, the results showed that the curves obtained from uniaxial tensile tests for these materials were not adequate to use in compressive analyses because they were not able to predict the experimental indentation responses. Consequently, the hardening curves obtained from IRC and IP approaches did not match those from uniaxial tensile tests for the SAE 4340 A, SAE 4340 N, and Aluminum 6101. The hypothesis assumed is that these materials present distinct behavior under tension and compression.
Keywords: parameter identification, indentation test, indentation multi-image analysis,
xv
RESUMO
O comportamento plástico de materiais metálicos é resultante de não linearidades que conduzem a complexos campos de tensão-deformação. Isso torna difícil o desenvolvimento de relações analíticas aplicáveis além do domínio elástico. Tradicionalmente, a relação tensão-deformação da maioria dos materiais tem sido adquirida a partir de ensaios uniaxiais de tração, que é largamente utilizado para descrever seu comportamento quando submetido à deformação plástica. Entretanto, há certos componentes materiais que devido à sua configuração não podem ser ensaiados por ensaios uniaxiais de tração ou compressão. Além do mais, o ensaio de dureza é mais versátil, operativo, barato e rápido que os ensaios uniaxiais. Quando se fala em ensaios tradicionais de dureza, tais como Brinell, Knoop, Rockwell e Vickers, eles são majoritariamente utilizados como uma forma de avaliar a resistência do material à deformação plástica. Eles relacionam o carregamento aplicado à resultante área ou profundidade da calota impressa no material. As técnicas desenvolvidas e apresentadas aqui vão além ao determinar outras propriedades materiais em adição à medida de dureza. Portanto, este trabalho apresenta dois métodos para descrever o comportamento de endurecimento de materiais metálicos a partir de ensaios de dureza. O ensaio de dureza Brinell é o método escolhido devido sua simplicidade e versatilidade. A metodologia consiste na execução de três ensaios de dureza Brinell em três configurações distintas, para se ter uma resposta representativa do material. Análises de imagem da impressão resultante do ensaio de dureza são realizadas com o auxílio de microscópio confocal à laser. Daí são obtidas as respostas experimentais do material. Desta análise são extraídas as medidas dos perfis da calota impressa no material, as quais serão utilizadas como referência para os resultados numéricos previstos pela repetitiva análise em elementos finitos. Neste processo, várias tentativas de curvas tensão-deformação são providas com o intuito de minimizar a discrepância entre as respostas numérica e experimental. Como mencionado, dois métodos foram desenvolvidos. O primeiro é designado como IRC (Indentation Reaction Curve) e replica numericamente a resposta de carga-profundidade final obtida experimentalmente. O segundo método, designado como IP (Indentation Profile), replica numericamente as impressões deixadas no corpo de prova pelo teste de dureza. Para facilitar o uso deste recurso por outros usuários, uma interface gráfica foi construída. Um tutorial sobre seu uso é também anexado a este trabalho. Por fim, as curvas de encruamento obtidas a partir de ensaio de tração e pelos métodos apresentados aqui são comparadas. Quatro materiais foram analisados: SAE 1524, SAE 4340 N (normalizado), SAE 4340 A (recozido), e Alumínio 6101. Seus parâmetros plásticos foram determinados pelos métodos IRC, IP e por ensaio de tração. Entretanto, com exceção do SAE 1524, os resultados mostram que as curvas obtidas a partir do ensaio uniaxial de tração para esses materiais não são adequadas para uso em análises compressivas, devido ao fato de não serem capazes de prever as respostas experimentais de indentação. Consequentemente, as curvas de endurecimento obtidas a partir dos métodos IRC e IP não correspondem àquelas obtidas a partir do ensaio de tração para o SAE 4340 N, SAE 4340 A, e Alumínio 6101. A justificativa para essa ocorrência é de que esses materiais apresentam comportamentos distintos sobre tração e compressão.
Palavras-chave: Identificação paramétrica, perfis de calotas esféricas, curva tensão-deformação, ensaio de dureza, processo de otimização.
1
CHAPTER 1.
INTRODUCTION
Background and motivation
Indentation hardness tests have been traditionally understood as a way to assess the capability a material has to resist plastic deformation by relating the applied load to the resultant area or depth of indentation, such as in Brinell, Knoop, Rockwell and Vickers hardness tests (Chandler, 1999). Over the past years, new techniques have been devised for probing the mechanical properties of materials by indentation tests. This is mainly due to the development of instruments able to provide the indentation load-displacement data. Properties such as the Young’s modulus and Poisson’s Ratio can be directly extracted by continuously measuring the depth of indentation while a normal load is being applied in the material. Thanks to numerical methods, such as the Finite Element Method, the determination of material hardening parameters by inverse analyses using indentation tests has become possible (Oliver and Pharr, 1992; Guillonneau et al., 2012; Kang, 2013; Dean and Clyne, 2017).
The increasing scientific knowledge has enabled engineers to elaborate solutions for practical problems and, as result of that, they have a greater number of tools and resources that can help in the problem solving and comprehension of science. The understanding of the mechanical behavior of ductile materials is closely tied to the development of many devices that facilitate the life of many. It greatly induces progress in several sectors of the industry, such as transportation, housing, communication, safety, clothing, food production, and sports.
Launching a new product into the market requires careful planning in several areas, from its conception to its installation and operation. It happens due to the perception that scientific methods have great potential to provide functionality with low manufacturing costs. Therefore, the selection of the material to be applied in an engineering project is an important decision for the designer, especially when the material undergoes plastic deformation.
The increasing interest in optimizing manufacturing processes has stimulated the important development of methodologies for obtaining stress-strain curves from indentation tests to provide a more versatile and convenient way to extract the material’s plasticity parameters (Oliver and Pharr, 1992; Giannakopoulos and Suresh, 1999; Bucaille et al., 2003; Bobzin et al., 2013; Kang, 2013; Njeugna et
al., 2016). The uniaxial test is traditionally performed to determine several material properties such as
the plasticity parameters. However, difficulties arise in this method when the amount of material available is not enough to manufacture the specimen.
The indentation test approach is also justified when other uniaxial test limitations are exposed: first, it requires a standard specimen, which brings costs spending funds and time to manufacture it; and
2
second, the specimen can only be used once since the uniaxial test is destructive. These two conditions make the parameter identification process more expensive and thus incite the development of new methodologies to perform the same task. Having the situation exposed, the indentation test is suggested to replace the traditional uniaxial test in the parameter identification task, providing versatility and convenience, since it is simple, cheap and the same specimen can be used several times for micro indentations.
The link between indentation tests and the stress-strain curve of the material is seen, for example, when this stress-strain relationship is inserted into numerical models to simulate contact problems. Assuming that this curve can be multiaxially applied to the deviatoric components of stress and strain (von Mises), it is possible to predict the mechanical behavior of an indented material and extract its load-depth response and the resultant indentation geometry. This work, however, presents the inverse problem, i.e., inferring the stress-strain relationship from experimental responses of a material to indentation tests.
The extraction of the stress-strain relationship of the material is performed by repetitive FEM analysis. In principle, several stress-strain curves are generated until the best fit between predicted and experimental responses is given. To produce the stress-strain curve, the Kleinermann-Ponthot (2003) constitutive model is adopted. It is defined by four plasticity parameters; thus, they are the variables to be optimized. For this, a methodology coupling FEM modeling and optimization approach was developed. To a great extent, the efficiency of the method relies on the efficiency of the optimization algorithm, since it conducts the whole process.
Instrumented indentation devices, usually used for similar purposes, are not available. Consequently, the collection of rich indentation data, such as the loading-unloading curve, was not possible. However, the method and all the algorithms developed here are applicable to extract the plasticity parameters using the loading-unloading information as the target curve. Instead of an instrumented indentation device, a universal hardness machine is used. It has a wide range of applicable loads and indenter sizes. From it, two experimental indentation responses are obtained, which will be used as the target information during the optimization process. The first relates the applied load to the final indentation depth while the second relates the applied load to the indentation profile extracted from a laser confocal microscope. The load-final depth response was primarily thought to give a good start for the development of the technique. Using the profile as the target information comes as a refinement of the method since it provides other contact parameters that are related to the hardening behavior of the material.
Therefore, two approaches for the extraction of plasticity parameters of metallic materials are provided. They are designed according to the target experimental data used in the process as the Indentation Reaction Curve (IRC) approach and the Indentation Profile (IP) approach. By them, four
3
materials are evaluated: the SAE 1524, SAE 4340 N, the SAE 4340 A, and the Aluminum 6101, where N stands for normalized and A for Annealed.
Research Aims
The aim of this work is to provide a sound methodology for extraction of plasticity parameters of metallic materials. Toward this aim, several distinct goals are established building up to the overall proposal fulfillment:
1. The development of a numerical model for the indentation test in python to be read by Abaqus. 2. Understanding the material response to indentation under different contact conditions, e.g. for distinct friction coefficients, contact formulation, and meshing.
3. Adoption of an optimization algorithm and the establishment of communication between it and the FE model.
4. Evaluation of the capability of the methodology by comparing the hardening curves extracted from it with the ones obtained from the uniaxial tensile tests.
5. The development of a friendly-user interface to facilitate the use of the methodology by other users in the task of extracting material plasticity parameters of metallic materials from indentation tests.
Outline
This dissertation is dived into six chapters, a conclusion and two appendices. Each chapter is divided into subsections to provide a clear understanding of the distinct processes involved in the development of this work. A brief outline is given below:
CHAPTER 1 introduces the subjects addressed in this work. It includes a brief comment on the indentation background and on the aspects that motivated the development of the technique proposed here. It establishes a connection between the indentation techniques and the extraction of the plasticity parameters from its responses. Lastly, it gives an overview of the numerical aspects and experimental shortcomings presented in this analysis.
CHAPTER 2 addresses the elastic-plastic contact in a didactic path starting from the description of the Hertzian contact up to recent theoretical conclusions about indentations in the full-plasticity regime. It introduces the concept of representative stress-strain, which analytically correlates indentations experiments with the traditional uniaxial test. It also presents the main phenomena related to the indentation experiment, such as the shallowing effect and pile-up/sink-in. The theoretical relationships of the constitutive formulation adopted is presented. It describes the evolution laws for the elastic-plastic behavior of most metals.
4
CHAPTER 3 describes the experimental procedures adopted to promote and evaluate the methodologies presented here. First, the uniaxial tensile test is depicted showing all the steps for the extraction of the plasticity parameters by its means. Second, the Brinell hardness test is addressed. This is the test used to generate the target information to be compared with the FEM output.
CHAPTER 4 presents the indentation FEM model built for this analysis. It is depicted as it was built in ABAQUS, showing all the procedures and considerations for the analysis. It included decisions on contact formulation, frictional effects, and meshing, for example.
CHAPTER 5 uses empirical analytical formulations as a tentative to correlate indentation tests to the stress-strain data obtained from uniaxial tests. The experimental data extracted in CHAPTER 3 are then used to obtain the indentation parameters necessary for the analytical relationships. Representative stress-strain points are obtained from that which are plotted against the stress-strain curves obtained from traditional uniaxial tensile tests.
CHAPTER 6 is the main point of this work. Here, the two approaches are explained in detail and applied for four different materials. They both are, in general, a curve fitting process. In this, experimental resultant data is continually compared with the numerical output for different sets of plasticity parameters provided in the optimization process. The optimum plasticity parameters are determined once the best fit between numerical and experimental data has been provided. With this done, the optimum plasticity parameters are inserted in their respective constitutive model and the material stress-strain curve is generated. It is then compared with the ones obtained from traditional uniaxial tensile tests.
The Conclusion is presented making an overall consideration of the two approaches developed here for the extraction of plasticity parameters of metals. Their efficiency and limitations are compared based on the results obtained. It states the hypotheses for the discrepancies in the analysis and suggests how the methodology could be better assessed considering the compressive nature of the indentation test. It also mentions the shortcomings of the optimization algorithm adopted and points out solutions to be added to the optimization routine.
APPENDIX A is a brief tutorial of the user-friendly interface built to spread the use of this technique by other researchers and students. APPENDIX B shows the optimization routine adopted.
5
CHAPTER 2.
ELASTIC-PLASTIC CONTACT
In several industrial applications, it is essential to predict the mechanical behavior of bodies that are brought into contact. It ranges from rollers and bearings to ultrasonic welding. Therefore, there has been an increasing focus on understanding and describing the nature of contact mechanics. Here, it is presented three main inquiries related to the body’s reaction to an applied load. They encompass the resultant shape of the contact area and how it grows, the magnitude and distribution of the surface tractions across the interface and how to obtain the stress and strain fields in the vicinity of the contact region. When it comes to a frictionless and fully-elastic contact interaction, the mechanics of contacts are well known and described by Hertz (1881). However, a complete analytical solution for contact problems involving yielding has not yet been achieved (Hills, 1983).
Hertzian Contact
Hertz developed the analytical solution for the contact between two elastic bodies whose profiles can be described by a smooth surface. Here, the sphere-flat contact pair will be exclusively addressed, since the scope of this work is about ball indentation tests. The sphere-on-flat contact configuration can be studied from the perspective of the contact of two spheres (Figure 1), where one of them has an infinite radius of curvature and, thus, is a true half space (Hills, Nowell and Sackfield, 1993).
Figure 1 Contact of two spheres. (Hills, Nowell and Sackfield, 1993).
In his theory, Hertz presents the relationship between the load applied to the indenter and other parameters that will describe the specimen response to an indentation within the elastic domain. There are four main considerations assumed in the elastic contact theory derived by Hertz: first, it must be assured that the contact area is sufficiently small when compared to the characteristic dimensions of the bodies in contact, i.e., 𝑎 ≪ 𝑅, where 𝑎 is the contact radius and 𝑅𝑒𝑞 is the equivalent radius of curvature. This condition requires continuous and non-conforming surfaces. Second, the deformation applied to
6
the elastic bodies must guarantee a stress state ruled by Hooke’s elastic law. Third, the solids can be considered as an elastic half-space. It means that the resultant contact area must be smaller than the radii and the significant dimensions, both laterally and in depth, of each body in contact. Last, the Hertz theory admits only normal pressure transmitted between the surfaces in contact. Therefore, there is no tangential resistance which leads to a frictionless contact (Hertz, 1881; Johnson, 1985).
To understand the basics of the Hertz’s contact theory, consider surface forces acting upon an elastic half-space, deforming it. According to Hertz’s theory, the displacement (ℎ𝑟) experienced by the surface
is given by Equation 1.
ℎ
𝑟=
1
𝐸
𝑒𝑞3
2
𝑝
0𝜋
4𝑎
(2𝑎
2− 𝑟
2),
𝑟 ≤ 𝑎 ,
(1)
which is led by the resultant pressure distribution (𝑝) caused by the surface forces, as given by Equation 2.
𝑝 = 𝑝
0{1 − (
𝑟
𝑎
)
2}
1 2,
(2)
where 𝑎 is the contact radius, 𝑟 is a radial coordinate. The term 𝑝0 is the peak contact pressure, expressed in Equation 3:
𝑝
0=
3𝑃
2𝜋𝑎
2.
(3)
and 𝐸𝑒𝑞 is the equivalent Young’s modulus defined in terms of the Young’s modulus and the Poisson’s ratio of each body (𝐸1, 𝐸2, 𝜐1, 𝜐2), expressed in Equation 4:
𝐸
𝑒𝑞= (
1 − 𝜐
12𝐸
1+
1 − 𝜐
22𝐸
2)
−1,
(4)
Still, from Equation 1, the contact radius (𝑎) is given by Equation 5:
𝑎 = (
3𝑃𝑅
𝑒𝑞4𝐸
𝑒𝑞)
1/3
,
(5)
where 𝑅𝑒𝑞 is the equivalent radius defined in terms of the radius of each body (Equation 6):
𝑅
𝑒𝑞= (
1
𝑅
1+
1
𝑅
2)
−1.
(6)
7
The total force exerted on the contacting surface is obtained by integrating the pressure (𝑝) over the contact area, as given by Equation 7:
𝑃 = ∫ 𝑝(𝑟)2𝜋𝑟𝑑𝑟
𝑎 0
=
2
3
𝑝
0𝜋𝑎
2(7)
The third restriction stated by Hertz (1881) (i.e. the contacting bodies touch each other over a small portion of their surface area, when compared to their dimensions) makes possible to describe the physical surface profile as a rotated parabola (Equation 8):
ℎ
𝑟= 𝑑 −
𝑟
22𝑅
𝑒𝑞,
(8)
where 𝑑 is the approach of two remote points. By substituting Equation 1 into 8, it is possible to describe the total force (Equation 7) in terms of the rigid body approach 𝑑, as seen in Equation 9:
𝑃 =
4
3
𝐸
𝑒𝑞𝑅
𝑒𝑞 12
𝑑
32(9)
So far, the contact pressure has been addressed and the answer has been provided regarding the shape of the contact and how it grows. Now the attention is turned to the development of the stress fields across the interface and inside the material for a purely normal indentation.
Huber (1904) detailed the stress field for the normal contact of two spheres in an axis-symmetric configuration where no shear tractions arise. The stress field is (𝜎𝑥𝑥, 𝜎𝑦𝑦, 𝜎𝑧𝑧, 𝜏𝑦𝑧, 𝜏𝑧𝑥, 𝜏𝑥𝑦) described from Equations 10 to 14 𝜎𝑥𝑥 −𝑝0
=
1 − 2𝑣 3(
𝑎2 𝑟2) [1 − (
𝑧 𝑢)
3] +
𝑢𝑧[2𝑣 + (
(1 − 𝑣)𝑢𝑎2+ 𝑢22)]
−(1 + 𝑣) (
𝑢𝑎) 𝑎𝑡𝑎𝑛 (
𝑎𝑢)
(10)
𝜎𝑦𝑦 𝑝0=
1 − 2𝑣 3(
𝑎2 𝑟2) [ 1 − (
𝑧 𝑢)
3] + (
𝑢𝑧)
3𝑢4 + 𝑎𝑎2𝑢2 𝑧2
+
𝑢𝑧
[(
(1 − 𝑣)𝑢𝑎2+ 𝑢22) + (1 + 𝑣)
𝑢𝑎𝑎𝑡𝑎𝑛 (
𝑎𝑢) − 2]
(11)
𝜎𝑧𝑧 −𝑝0= (
𝑧 𝑢)
3𝑢4𝑎+ 𝑎2𝑢22𝑧2
(12)
𝜏𝑦𝑧 −𝑝0=
𝑟𝑧2 𝑢4+ 𝑎2𝑧2 𝑎2𝑢 𝑎2+ 𝑢2(13)
𝜏
𝑧𝑥= 𝜏
𝑥𝑦= 0
(14)
8
where 𝑢2 is
𝑢
2=
1
2
(𝑟
2+ 𝑧
2− 𝑎
2+ √(𝑟
2+ 𝑧
2− 𝑎
2)
2+ 4𝑎
2𝑧
2(15)
Having defined the stresses at a general point (𝑟, 𝑧) , where 𝑟 = 𝑥2+ 𝑧2, (Equations 10 to 14),
contours for the von Mises equivalent stress (Equation 16) are represented in Figure 2 for 𝑣 = 0.30.
𝜎
𝑒𝑞=
√21[(𝜎
𝑥𝑥− 𝜎
𝑦𝑦)
2+ (𝜎
𝑥𝑥− 𝜎
𝑧𝑧)
2+ (𝜎
𝑧𝑧− 𝜎
𝑦𝑦)
2+ 6(𝜏
𝑥𝑦2+ 𝜏
𝑥𝑧2+ 𝜏
𝑦𝑧2)]
1/2(16)
Figure 2. Contours of the von Mises equivalent stress for the spherical Hertzian contact.
Figure 2 shows that the critical stress state lies on the axis of symmetry. Therefore, by looking at Figure 3, which shows the internal stresses distribution for 𝑟 = 0, the maximum shear stress and the equivalent von Mises stress have their critical value at a depth of 0.481𝑎.
Figure 3. Internal stresses along the axis of symmetry (r = 0) for the Hertzian pressure distribution.
9
Post-yielding contact in metals
The severest stress state point of an indentation is distinguished out as the location where plastic yield begins. Therefore, there is a specific load associated with the transition from a totally elastic state to a regime that admits yielding. To find out the applied load (𝑃) that leads to yielding, the maximum equivalent von Mises stress is considered as the yield criterion. For the Hertzian contact, the maximum equivalent von Mises stress is 0.62𝑝0 and takes place at a depth of 0.481𝑎 on the axis of symmetry (𝑟 = 0) (Figure 3). Therefore, yield occurs when the peak contact pressure reaches 𝑝0𝑌 = 1.613𝜎𝑌, where 𝜎𝑌 is the material yield strength. To relate the applied load 𝑃 with the yield strength, Equation 5 first is
substituted into Equation 3 to produce a relationship that links the applied load with the peak contact pressure, as shown in Equation 17 :
𝑝
0= (
6𝑃𝐸
𝑒𝑞2𝜋
3𝑅
𝑒𝑞 2)
1/3.
(17)
From Equation 17, the load associated with initial yielding is then given:
𝑃
𝑌=
𝜋
3𝑅
𝑒𝑞 26𝐸
𝑒𝑞2(𝑝
0𝑌)
3.
(18)
At this stage, the elastic zone is still predominant as it surrounds the plastic zone. However, as the load increases, the plastic zone expands until breaking out to the free surface. Consequently, there is a redistribution of the surface contact pressure to the point of reaching the state of full plasticity, which is characterized by the dominant plastic material under the indenter (Hills, 1983; Johnson, 1985). At the state of full plasticity, the yield pressure is independent of the load and of the size of indentation (for fully work-hardened materials), which makes the contact pressure become uniform and provides appropriate means of measuring hardness (Tabor, 1951).
The evolution of the plastic zone in the indented material happens in three stages (Figure 4). The first is purely elastic (Figure 4a), where no plastic deformation is present. The second starts when the peak contact pressure assumes the critical value of 𝑝0𝑌 = 1.613𝜎𝑌, which is equivalent to the mean
contact pressure of 𝑃𝑚 ≈ 1.075𝜎𝑌. At this state, plasticity initiates, but is kept contained by the elastic material (Figure 4b), therefore it is a regime of transition from the elastic to the fully-plastic. Once the plastic flow becomes uncontained (Figure 4c), the third indentation stage takes place. Experimental analysis carried out by Tabor (1951) on several work-hardened metals led him to conclude that the fully-plastic stage initiates when 𝑃𝑚 ≈ 3𝜎𝑌.
10
(a)
(b)
(c)
Figure 4. Evolution of plastic zone for ball indentation in three regimes: (a) elastic, (b) elastic-plastic, and (c) fully plastic. Adapted from Ahn and Kwon (2001).
Johnson (1970, 1985) then proposes a parameter Γ to govern the indentation pressure, whereby the plastic zone develops. He first considers that the indentation is idealized as an expanding cavity where its volumetric expansion is equivalent to the volume displaced by the indenter. This assumption leads him to admit that the amount of strain experienced by the solid is proportional to the contact angle 𝛽 between the indenter and the specimen (𝛽 kept small), as shown in Figure 5.
Figure 5. Ball indentation of a surface and influence of the angle 𝜷.
The parameter (Γ) proposed by Johnson (1970, 1985) is defined in terms of the contact angle 𝛽 and the yield strain of the material 𝜎𝑌/𝐸. It then provides the ratio
Γ =
tan(𝛽)
𝜎
𝑌
𝐸
11
which informs the amount of strain experienced by the indented material to its elastic strain capacity. With this consideration, he correlates the ratio of the mean contact pressure to yield stress (𝑃𝑚/𝜎𝑌 ) with
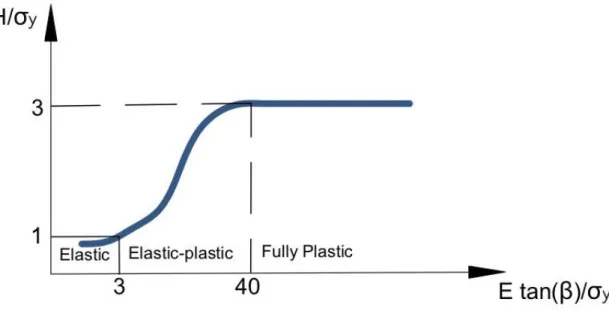
the proposed parameter Γ, in order to level the indentation in the elastic, elastic-plastic or fully-plastic regimes. According to Johnson (1970, 1985), the indentation behavior is elastic if Γ < 3, elastic-plastic if 3 ≤ Γ < 40 and fully-plastic for Γ ≥ 40. This correlation is shown in Figure 6.
Figure 6. Schematic correlation of spherical indentation testing of elastic-plastic materials proposed by Johnson (1970, 1985). Adapted from Olsson and Larsson (2013)
Representative stress
Equation 19 does not consider materials capable of work-hardening, i.e. materials whose yield stress evolves under plastic deformation. To overcome this limitation Tabor (1951) suggests a representative stress 𝜎𝑟𝑒𝑝 related to the elastic limit measured at a representative strain 𝜀𝑟𝑒𝑝, given as
𝜀
𝑟𝑒𝑝(𝑥/𝑎, 𝑦/𝑎) = 0.2 tan(𝛽).
(20)
In the full plasticity state, the mean contact pressure 𝑃𝑚 is now related to the representative stress σrep according to Equation 21 (Tabor, 1951):
𝑃
𝑚= Ψ σ
rep,
(21)
where Ψ is a plastic constraint factor expected to be related with the plastic zone expansion (Ahn and Kwon, 2001). This parameter assumes a constant value of 1.11 in the elastic regime, a linear function of ln (Γ) during the elastic-plastic transition, and a constant value ranging from 2.8 to 3.0 in the fully-plastic regime (Johnson, 1970; Li et al., 2016).
12
Thus, the representative stress expression assumes the form shown in Equation 22:
𝜎
𝑟𝑒𝑝=
1
Ψ
𝑃
𝜋𝑎
2,
(22)
From the definitions in Equations 20 and 21, the Johnson parameter (Γ) assumes the form expressed in Equation 23. The Johnson parameter considers materials able of work-hardening through the representative stress.
Γ =
𝐸
𝜎
𝑟𝑒𝑝tan(𝛽).
(23)
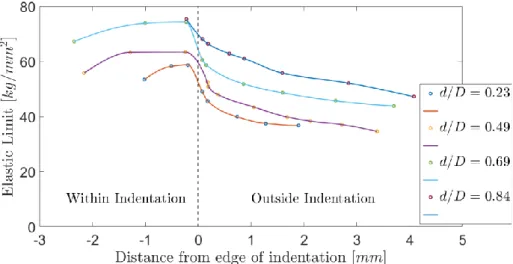
For work-hardening materials, the increasing indentation load will cause yield stress and plastic strain evolution. Unlike wedge, cone, and pyramid shaped indenters, spherical indenters are not geometrically similar. It means that tan(𝛽) is not constant and thus change as a function of the indentation depth. Because the shape of the indentation changes as an increasing load is applied, it is possible to determine how the yield stress evolves with the amount of deformation. This excludes the use of different indenters’ size to obtain distinct strain levels.
Figure 7. Variation of the yield stress along the indentation area
As Figure 7 illustrates, the plastic deformation is not uniform in the free surface inside and around the indentation. As a result of that, the material is hardened at different levels in the surrounding area of the indentation. Indeed, Tabor (1951) showed through several measurements on mild steel that the yield stress gradually rises as the edge of the indentation is approached (Figure 7). Even though the yield stress varies around the indentation, Equations 20 and 21 were empirically devised after concluding that the yield stress at the edge of the indentation stands as a representative quantity for the entire indentation area. It allows a direct correlation between hardness and true stress-strain curves, as shown in Figure 8.
13
Figure 8. Hardening curve obtained from hardness measurements. Adapted from Li et al (2016)
The increasing yield pressure accompanying the size of indentation is a useful feature of spherical indentations. Not only the yield stress growth can be deduced from it but the amount of work-hardening as well. Therefore, each indentation depth will lead to a stress-strain point of the hardening curve of the material. This provides a suitable means to estimate the stress-strain characteristics of the indented material.
However, the analysis of post-yield indentation is not an easy task due to the complexity of the stress and strain fields beneath the indenter. For this reason, a theoretical treatment of this problem has not yet been achieved successfully, although many analyses have been performed through FEM and yielded more accurate results (Mesarovic and Fleck, 1999; Olsson and Larsson, 2013; Li et al., 2016). Thus, equations 19 to 23 present analytical relationships devised empirically for the post-yield contact. Consequently, they are limited and only represent a correlation of indentation experiments.
Indentation Response
The impressed profile from spherical indentation does not solely depend on the material’s hardness but is also strongly influenced by its strain-hardening behavior, indentation depth, and contact friction (Oliver and Pharr, 2004; Taljat and Pharr, 2004; Karthik et al., 2012). Three main effects that accompany the indentation are shallowing, piling-up and sinking-in. Indentation shallowing happens as a result of the elastic recovery after the material is unloaded. Pile-up and sink-in happen around the edge of the indentation due to material flow.
2.4.1 Shallowing effect
During indentation unloading, there is a release of the elastic stresses in the material around the indentation. As a result, the impression shallows and yields a permanent curvature radius greater than the radius of the indenter. Figure 9 shows this effect through an illustration of the unloading process. In
14
(a), the indenter is brought into contact with the specimen. In (b), the indenter is pressed against the specimen and an impression is formed. In (c), the indenter is removed yielding a spherically shaped indentation impression with a radius of curvature 𝜌 greater than that of the indenter 𝑅.
(a) (b) (c)
Figure 9. Unloading a spherical indenter. Adapted from Johnson (1985)
Figure 10 shows the shallowing effect from the perspective of the loading-unloading indentation curve. As it can be seen, the indenter displacement at peak load (ℎ𝑚𝑎𝑥) considerably decreases when
the load is fully withdrawn (ℎ𝑓).
Figure 10. Indentation load-displacement data.
Since unloading is essentially elastic, Equation 9 can be modified to represent it. This is achieved by replacing the depth 𝑑 that appears in this equation by ℎ – ℎ𝑓, as shown in Equation 24:
𝑃 =
4
3
𝐸
𝑒𝑞𝑅
1
2
(ℎ – ℎ
𝑓)
32(24)
From Figure 10, two important relationships can be derived. The first is the Kick’s law expressed in Equation 25, which is used to describe the loading portion of the indentation reaction curve (Kang, 2013).
15
𝑃 = 𝐶ℎ
𝑚,
(25)
where 𝑃 is the applied load, ℎ is the indentation depth and 𝐶 and 𝑚 are constants. Usual values for some common geometries are 𝑚 = 1 for flat cylinders, 𝑚 = 2 for cones, 𝑚 = 1.5 for spheres considering small displacements and 𝑚 = 1.5 for paraboloids of revolution (Oliver and Pharr, 1992).
The second important relationship derived from the indentation reaction curve is the initial unloading stiffness 𝑆. 𝑆 is obtained by differentiating Equation 24 with respect to ℎ, as expressed in Equation 26 (Oliver and Pharr, 2004).
𝑆 =
dP𝑑ℎ= 2√𝑅𝐸
𝑒𝑞(ℎ − ℎ
𝑓)
1
2
,
(26)
where P is the load being continuously withdrawn.
2.4.2 Piling-up and sinking-in
When an indenter is pressed against a specimen with a load 𝑃, the plastic flow around the indenter may cause the surrounding material to pile-up or to sink-in. Pile-up happens when the plastic zone beneath the indenter and the surrounding elastic volume are not able to accommodate the volume change that occurs as the indenter penetrates the specimen (Karthik et al., 2012). This reallocation due to volume change causes the material to pile-up at the contact edge. Sink-in is present in strongly hardening materials, indicating that this effect happens due to the constraint imposed by the surrounding material, making the plastic zone and the elastic volume to accommodate the volume change due to the indentation. Other factors, such as penetration depth, also influences the indentation contact area. These effects may be characterized by the parameter 𝑠, which is a height related to the undeformed surface. If 𝑠 > 0, the material experiences piling-up; If 𝑠 < 0, the material experiences sinking-in. These conditions are illustrated in Figure 11, where both pile-up (left-hand side) and sink-in (right-hand side) effects are shown.
16
The determination of the contact area in indentation tests can be severely affected by the amount of pile-up/sink-in experienced by the material. Bolshakov and Pharr (1998) concluded that the true contact area can be underestimated by as much as 60% if pile-up is not taken into account. Figure 11 also shows the discrepancy in the measurement of the contact radius (𝑎𝑐) and the contact height (ℎ𝑐), which respectively varies from 𝑎 and ℎ depending on the amount of pile-up or sink-in.
2.4.3 Influence of the hardening exponent and friction on profile geometry and
loading-unloading curve
According to Tabor (1951), pile-up and sink-in will be led by the work-hardening state of the material. Therefore, it is shown that the level of piling-up or sinking-in can be described by a numerical invariant 𝑐2= 𝑎𝑐2/(2𝑅ℎ) dependent on the material hardening exponent 𝑛 alone. Hill et all (1989)
relates 𝑐2 and 𝑛 based on a power-law hardening of the form 𝜎 = 𝐻𝜀𝑝𝑛, where 𝐻 is the hardening modulus. This relationship is then given according to Equation 27:
𝑐
2=
5
2
(
2 − 𝑛
4 + 𝑛
).
(27)
The parameter 𝑐2 then represents the ratio of the contact depth to the total depth of penetration and
is applicable for small penetration depths only. Thus, 𝑐2> 1 indicates that the material will pile-up while 𝑐2 < 1 indicates that the material will sink-in. When 𝑛 ≅ 0.28, neither piling-up nor sinking-in will occur and 𝑐2 = 1.
The contact friction is present in the interaction indenter-specimen due to their asperities. For the indentation contact configuration, the resistance to sliding is influenced by the material strain hardening, and the real contact area ratio (Leu, 2011). On the other hand, friction will influence the distribution of plastic strain beneath the indenter, the load-depth response, and the resultant profile (Mesarovic and Fleck, 1999; Karthik et al., 2012).
According to Taljat and Pharr (2004), materials that strain harden are less sensitive to friction. This happens because, when indented, the surrounding material hardens (Figure 7). The evolution of the yield stress at the contact edge works as a barrier against plasticity at that region. Consequently, the plastic zone is driven deeper into the material instead of radially outward. A good way to visualize this effect is looking at the amount of pile-up of an indented material. Figure 12 shows how friction influences the resultant profile for a material with 𝐸/𝜎𝑦= 200 considering (a) an elastic perfectly plastic behavior and (b) an elastic strain-hardening-plastic material with 𝑛 = 0.5 for six different friction coefficients: 0.0, 0.1, 0.2, 0.3, 0.5 and 1.0.
17
(a) (b)
Figure 12. Influence of contact friction on unloaded indentation profile considering (a) an elastic perfectly plastic behavior and (b) an elastic strain-hardening-plastic material with 𝒏 = 𝟎. 𝟓 for
six different friction coefficients: 𝟎. 𝟎, 𝟎. 𝟏, 𝟎. 𝟐, 𝟎. 𝟑, 𝟎. 𝟓 and 𝟏. 𝟎.
As concluded by Taljat et all and Karthik et all (2004; 2012), friction has a small effect on the indentation profile for strongly hardening materials. Furthermore, the profile is shown to be affected only for friction coefficients below 0.2. For those materials affected by friction, it acts toward diminishing pile-up and indentation depth.
Figure 13 shows the effect of friction on the loading-unloading indentation response. It is noted that the higher the load applied, the higher is the discrepancy caused by friction. As for the profile response, friction has no discernable effect for coefficients above 0.2.
18
The plastic strain distribution beneath the indenter is also affected by friction as shows in Figure 14. When considering a frictionless relationship between indenter and specimen, the specimen material is free to move relative to the indenter and the maximum effective plastic strain is nearer the surface. If friction is included, it acts as a radial constraint for the material relative motion near the contact site. Consequently, the strain distribution along the indentation axis of symmetry start at low values near the contact area and reaches its maximum values at a depth of 0.2𝑎. By comparing their results with Chaudhri’s (1996), Mesarovic and Fleck (1999) concluded that this is a frictional effect.
Figure 14. Distribution of effective plastic strain on the axis of symmetry beneath the indenter for an elastic-perfectly plastic material. with 𝑬/𝝈𝒚= 𝟐𝟎𝟎.
Tabor (1951) states that experimental results reveal that surface roughness has little effect on the indentation profile geometry as long as the indentation is large enough when compared with the dimensions of the asperities. He concludes that there is no necessity to produce a high degree of surface finishing to obtain satisfactory hardness measurement on a metal sample.
2.4.4 Determination of the contact radius from indentation morphology
As mentioned above, the determination of the right contact radius is a difficulty task that arises when using the empirical relationships for the post-yield contact. This limitation is increased if the elastic deflection and pile-up/sink-in are included. One way to overcome it would be to optically measure the contact radius. However, a more convenient way is to obtain the contact radius from the indentation morphology.