Psychological barriers in the
cryptocurrency market
Vítor Fonseca
Faculty of Economics, Universidade do Porto, Porto, Portugal
Luís Pacheco
Department of Economics and Management,
Universidade Portucalense Infante D. Henrique, Porto, Portugal, and
Júlio Lobão
Faculty of Economics, Universidade do Porto, Porto, Portugal
Abstract
Purpose – The purpose of this paper is to study the existence of psychological barriers in cryptocurrencies. Design/methodology/approach – To detect psychological barriers, the authors perform a uniformity test, a barrier hump test, a barrier proximity test and conditional effects test to a sample comprised by the daily closing quotes of six of the most liquid cryptocurrencies.
Findings – The results evidence the existence of psychological barriers in four of the cryptocurrencies under scrutiny, namely, Bitcoin, Dash, NEM and Ripple.
Practical implications – The fact that the cryptocurrency market has a high share of unexperienced investors and presents several cases of psychological barriers is consistent with the hypothesis that that class of investors is particularly prone to the behavioral biases which cause psychological barriers.
Originality/value – This paper studies, for the first time, the existence of psychological barriers in the market of cryptocurrencies.
Keywords Market efficiency, Bitcoin, Psychological barriers, Cryptocurrencies Paper type Research paper
1. Introduction
Psychological barriers are currently one of the most important topics of research in the field of behavioral finance, with several empirical studies published since the 1990s on a variety of financial assets, such as stock indices, single stocks, bonds, derivatives and gold, among others. However, there is a lack of studies regarding the existence of psychological barriers in the cryptocurrency market. This gap in the literature is surprising given the size of the market. According to CoinMarketCap (http://coinmarketcap.com), the market capitalization of the ten largest cryptocurrencies totaled more than US$140bn in March 2019.
Although Philip et al. (2018) defended that cryptocurrencies exhibit patterns identical to those detected in stock markets, a question yet to be answered is whether there are psychological barriers in those assets. In this paper we fill this gap in the literature by examining for the first time the existence of psychological barriers on the emerging market of cryptocurrencies. We include in our sample six of the most liquid cryptocurrencies and apply the methodology suggested by Aggarwal and Lucey (2007) for the detection of psychological barriers, which includes a uniformity test, a barrier proximity test, a barrier hump test and a conditional effects test.
The results evidence the existence of psychological barriers in four of the cryptocurrencies under scrutiny: Bitcoin, Dash, NEM and Ripple. The fact that the cryptocurrency market has a high share of unexperienced investors and presents several cases of psychological barriers is consistent with the hypothesis that unexperienced investors are more prone to the behavioral biases which cause psychological barriers than professional traders.
The remainder of this paper is organized as follows: Section 2 presents the literature review, and Section 3 addresses the methodological aspects, namely, the data used in the study and the various methodological steps. Section 4 discusses the empirical results. Section 5 concludes the paper.
2. Literature review
2.1 Causes of psychological barriers
2.1.1 Behavioral biases. Psychological barriers can be seen as limits to arbitrage provoked
by mental biases. For example, Mitchell (2001) pointed out that a psychological barrier can be viewed as an impediment to an individual’s mental outlook, that is, an obstacle created by the mind, barring advance or preventing access. Accordingly, Hirshleifer (2001) claimed that investors are affected by judgment and decision biases caused by heuristic simplification, self-deception and emotional loss of control. Anchoring is one of those biases and it can be defined as the phenomenon that different starting points yield different estimates, since people tend to make estimates by starting from an initial value and then adjust, most of the times insufficiently (Tversky and Kahneman, 1974). Westerhoff (2003) developed a model in which investors’ perception of the fundamental value is anchored to the nearest round number. This model predicts excessive volatility, alternation between periods of turbulence and periods of tranquility, and fluctuation of the exchange rate around its perceived fundamental value. Because of anchoring, exchange rates are persistently misaligned, which establishes support and resistance levels in the limits of the fluctuation band. In other words, the perceived fundamental value acts as a psychological barrier.
2.1.2 Aspiration levels. Sonnemans (2006) indicated that some investors, when
buying a stock, already have an idea for what price they will be able to sell the stock in the future. This notion can be linked to aspiration levels, a concept of the psychological theory which was introduced to the economic theory by Simon (1955), alongside the notion that the economic agent might not pursue the optimal solution but actually settle for a satisfactory solution.
Additionally, some financial analysts also use target prices for individual stocks and these are also typically round numbers (Sonnemans, 2006), which will lead to many limit sell offers being posted at round whole numbers.
2.1.3 Odd pricing. According to Sonnemans (2006, p. 1938), “odd pricing is the tendency
of consumers to consider an odd price like 19.95 as significantly lower than the round price of 20.00.” This tendency could be originated by the limited amount of memory that people have, which leads them to attach more significance to the first digits of a price as they contain more significant information than the last digits (Brenner and Brenner, 1982).
Odd pricing is very common in consumer goods, with a number of studies (e.g. Holdershaw et al., 1997; Folkertsma, 2002) showing that prices tend to have 9 as the last significant digit. Additionally, Kahn et al. (1999) argued that, due to this tendency, financial institutions would profit by quoting retail loan rates with odd-ending yields and deposit rates with even-ending yields. The theory proposed by the authors predicts that banks tend to set deposit rates at integers and that rates are sticky at those levels. Also, when banks set non-integer rates, those are more likely to be just above, rather than just below integers.
2.1.4 Option exercise prices. Dorfleitner and Klein (2009) stated that psychological
barriers could also be caused by the fact that option exercise prices are usually round numbers. Delta hedgers are frequently most active when the price of the underlying is close to the exercise price – in other words, when the option is at the money – so, purely technical reasons can also cause additional trading activity in the underlying asset.
2.2 Previous empirical studies
Our study adds to the literature on psychological barriers by studying the phenomenon for the first time in the market of cryptocurrencies. The first studies about psychological barriers in financial markets took place in the 1990s. The initial research focused mainly on stock indices of developed markets, concluding in most cases by the existence of psychological barriers. These conclusions are shared by the studies conducted by Donaldson and Kim (1993), Ley and Varian (1994), Koedijk and Stork (1994) and Cyree et al. (1999), and also by the more recent study authored by Woodhouse et al. (2016).
Donaldson and Kim (1993) tested whether DJIA’s movements around key reference points exhibited psychological barriers during the period 1974-1990. The main finding is that those movements were indeed restrained by support and resistance levels at multiples of 100. After breaking through a 100-level, the DJIA moved by more than otherwise warranted. Ley and Varian (1994) confirmed these findings considering a wider timer interval (1952–1993). They found fewer observations around 100-levels than what is predicted by a uniform distribution. Additionally, they argued that there was no predictive power on the daily closing prices resulting from psychological barriers.
Koedijk and Stork (1994) expanded the research to a number of indices, considering the stock markets from Belgium, Germany, Japan, USA and UK. The results corroborate the conclusions from the previous studies: psychological barriers are real, but they do not necessarily imply predictability of stock returns.
Cyree et al. (1999) concluded that the last two digits of the DJIA, the S&P 500, the Financial Times UK Actuaries (London) and the DAX are not equally distributed. Moreover, their findings support the existence of psychological barriers and show that these effects are particularly pronounced when the barrier is approached in an upward move.
Finally, Woodhouse et al. (2016) found evidence of psychological barriers at the 100-level in the NASDAQ Composite index in the period 1990–2012.
Some other studies focusing on European stock markets like those conducted by Dorfleitner and Klein (2009) and Shawn and Kalaichelvan (2012) found mixed results.
Dorfleitner and Klein (2009) analyzed the German DAZ 30, the French CAC 40, the British FTSE 50 and the Euro-zone related DJ EURO STOXX 50 for different periods until 2003. They found “fragile traces of psychological barriers” in all indices at the 1,000s barrier level and also indications of barriers at the 100 barrier level, except in the CAC 40. However, the authors did not find any systematic barrier effect for any barrier level, thus concluding that there are no consistent barriers in European stock indices.
Shawn and Kalaichelvan (2012) examined five indices (ATX, CAC, DAX, FTSE, SMI) in the period 2001–2011, having found evidence for barriers in only one index (SMI) at the 1,000-level but no significant evidence of barriers at the 100 and 1,000 levels in the other indices.
Bahng (2003) and Lobão and Fernandes (2018) carried out two of the few studies regarding the existence of psychological barriers in emerging stock markets.
Bahng (2003) conducted the first study about the topic on Asian stock markets, using the daily prices of seven indices (South Korea, Taiwan, Hong Kong, Thailand, Malaysia, Singapore and Indonesia) from the beginning of 1990 to the end of 1999. The Taiwanese index and the Indonesian index exhibited some signs of psychological barriers.
Lobão and Fernandes (2018) found no consistent psychological barriers in individual stock prices near round numbers in the markets of Taiwan, Brazil and South Africa in the period 2000–2014. The authors also documented that the relationship between risk and return tended to be weaker in the proximity of round numbers for about half of the stocks under study.
Different studies concluded that price barriers or at least significant deviations from uniformity also exist in other asset classes such as bonds (Burke, 2001), commodities (Aggarwal and Lucey, 2007) and derivatives (Schwartz et al., 2004).
The present study also contributes to the emerging literature about the price dynamics of cryptocurrencies. For example, Dwyer (2015) documented a significant difference between the pattern of volatility in Bitcoin and that observed in gold and other currencies while Urquhart (2016) and Barriviera (2017) found signs of inefficiency in the market of that cryptocurrency. Fry and Cheah (2016) showed that cryptocurrency markets contain a considerable speculative component, and Cheah and Fry (2015) and Corbet et al. (2018) concluded that Bitcoin and Ethereum exhibited speculative bubbles.
Finally, our paper relates to the literature on price clustering in cryptocurrencies. Mitchell (2001) draws a distinction between psychological barriers and price clustering. While price barriers regard some numbers as support or resistance levels, price clustering is the concentration of prices on some numbers rather than others.
Urquhart (2017) found significant evidence of clustering of daily Bitcoin closing prices on round numbers and Hu et al. (2019) concluded that the price clustering also existed in the intraday prices of cryptocurrencies Bitcoin, Litecoin and Ripple. Xin et al. (2019) found significant clustering for open, high and low Bitcoin prices at various time frames, suggesting that that can be explained by the existence of psychological barriers. Some authors have tried to shed light on the causes of price clustering. For example, Mbanga (2019) showed that the clustering of Bitcoin was not driven by any day-of-the-week and Baig et al. (2019) documented the existence of a strong positive association between sentiment and price clustering.
3. Data and methodology
3.1 Data
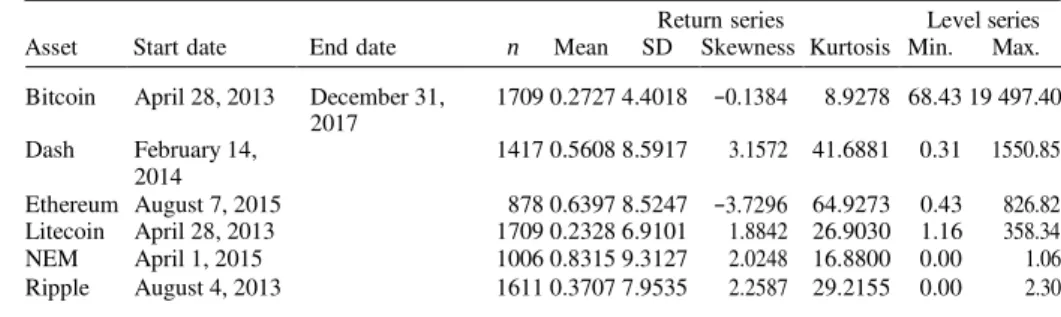
The sample considered in the study includes six of the most liquid cryptocurrencies, namely, Bitcoin, Dash, Ethereum, Litecoin, NEM and Ripple, which, at the end of March 2019, and according to CoinMarketCap, account for nearly 85 percent of the cryptocurrencies’ market capitalization. We collected the daily closing quotes for each asset for the period between the first trading day of the asset and December 31, 2017 from CoinMarketCap.
Table I presents the descriptive statistics of the assets included in the sample. The table shows that all the studied cryptocurrencies yielded positive mean returns in the period under analysis.
3.2 Methodology
3.2.1 Definition of barriers. Following Dorfleitner and Klein (2009), we will use the so-called
band technique and define barriers as an interval between two numbers at the same distance from the number which constitutes the actual barrier. The main reason for this technique is the idea that market players will become more active at a certain level before the price touches a round number. Dorfleitner and Klein (2009) defined the barrier level l as the number of zeros that a barrier has; we will follow the same definition, also introducing
Return series Level series
Asset Start date End date n Mean SD Skewness Kurtosis Min. Max.
Bitcoin April 28, 2013 December 31, 1709 0.2727 4.4018 −0.1384 8.9278 68.43 19 497.40 2017
Dash February 14, 1417 0.5608 8.5917 3.1572 41.6881 0.31 1550.85
2014
Ethereum August 7, 2015 878 0.6397 8.5247 −3.7296 64.9273 0.43 826.82
Litecoin April 28, 2013 1709 0.2328 6.9101 1.8842 26.9030 1.16 358.34
Table I. NEM April 1, 2015 1006 0.8315 9.3127 2.0248 16.8800 0.00 1.06
¼
Σ
~ ð Þ ð ÞΣ ~ ð Þ ð Þ
k
the barrier levels l −1 and −2 for the 0.1-level and 0.01-level barriers, respectively. We define as potential barriers the multiples of 0.01, 0.1, 1, 10, 100 and 1,000 and define intervals with an absolute length of 2, 5 and 10 percent to the corresponding barriers, thus considering the following restriction bands:
Barrier level l ¼ 3ð1; 000sÞ : 980—1; 020; 950—1; 050; 900—1; 100
Barrier level l ¼ 2ð100sÞ : 98—102; 95—105; 90—110 Barrier level l ¼ 1ð10sÞ : 9:8—10:2; 9:5—10:5; 9:0—11:0 Barrier level l ¼ 0ð1sÞ : 0:98—1:02; 0:95—1:05; 0:90—1:10 Barrier level l ¼ —1ð0:1sÞ : 0:098—0:102; 0:095—0:105; 0:090—0:110 Barrier level l ¼ —2ð0:01sÞ : 0:0098—0:0102; 0:0095—0:0105; 0:0090—0:0110: For each cryptocurrency, we then examine the barrier levels which are susceptible of constituting psychological barriers.
3.2.2 M-values. The concept of M-values was introduced by Donaldson and Kim (1993),
who considered potential barriers at the levels …, 300, 400, …, 3,400, 3,500, …, i.e. at:
k X 100; k ¼ 1; 2; ::: (1)
De Ceuster et al. (1998) found two problems with this approach: not only it was too narrow, as the series was not multiplicatively regenerative, leading to 3,400 being considered a barrier while 340 was not, for instance, but also the gap between barriers, as defined by Equation (1), would tend to zero as the price series increased, intuitively reducing the probability of those levels to represent psychological barriers. Thus, the authors claim we should consider the possibility of barriers at the levels …, 10, 20, …, 100, 200, …, 1,000, 2,000, …, i.e. generally at:
k X 10l ; k ¼ 1; 2; .. .; 9; l ¼ :::; —1; 0; 1; .. .; (2)
and also at the levels …, 10, 11, …, 100, 110, …, 1,000, 1,100, …, i.e. generally at:
k X 10l ; k ¼ 10; 11; .. .; 99; l ¼ :::; —1; 0; 1; . . . (3)
The M-values we will use in our study can now be defined according to these barriers:
Mk ¼
Σ
Pt ~
100Σ
mod 100; k ¼ 0:01; 0:1; 1; 10; 100; 1; 000; (4)
where Pt 100 = k is the integer part of Pt 100 = k , and mod 100 is the reduction
modulo of 100.
Illustrating this with a purely theoretical quote of 1,234.56789, the M0.01 is 78, the M0.1 is 67, the M1 is 56, the M10 is 45, the M100 is 34 and the M1000 is 23.
3.2.3 Uniformity test. After defining the M-values, the next step is to examine if they
follow a uniform distribution, through the uniformity test introduced by Ley and Varian (1994), which consists of a Kolmogorov–Smirnov Z-statistic test where we will be testing: H0 – uniform distribution – against H1 – non-uniform distribution. In the presence of psychological barriers, it is expected to reject the null hypothesis. However, it is important to underline that this rejection does not by itself confirm the existence of such barriers.
¼
Additionally, De Ceuster et al. (1998) stated that, as the series grows, the interval between barriers widens and, as a result, the distribution of digits and their frequency of occurrence tends to stop being uniform.
3.2.4 Barrier tests. We will perform two barrier tests, a barrier proximity test and a
barrier hump test. The purpose of these tests is to assess if the series observations on or near a barrier occur less frequently than what would be predicted by a uniform distribution, examining the shape of the M-values distribution.
A barrier proximity test examines the frequency of M-values in the proximity of potential barriers, applying the following equation:
f ðM Þ ¼ aþbD þe; M ¼ 00; 01; .. .; 99; (5)
where f(M) is defined as the frequency with which a quote closes with its last two digits in cell M, minus 1 percentage point, and D is a dummy variable which takes the value 1 if the price of the asset is at the potential barrier and 0 elsewhere. Besides the strict dummy, which takes the value 1 if M 00 and takes the value 0 otherwise, we will study 3 dummies for each potential barrier level:
D98—02 ¼ 1 if M X98 or M p02; ¼ 0 otherwise; D95—05 ¼ 1 if M X95 or M p05; ¼ 0 otherwise; D90—10 ¼ 1 if M X90 or M p10; ¼ 0 otherwise:
The β coefficients are expected to be negative and statistically significant in the presence of psychological barriers.
The barrier hump test examines the entire shape of the distribution of M-values and is broader than the barrier proximity test as it does not focus solely on the proximity of the potential barriers. We will implement this test using the following equation, which was introduced by Bertola and Caballero (1992):
f ðM Þ ¼ aþgM þdM 2 þe; M ¼ 00; 01; .. .; 99; (6)
where f(M) is once again defined as the frequency with which a quote closed with its last two digits in cell M, minus 1 percentage point, and the independent variables are the M- value and its square.
In the presence of psychological barriers, the M-values are expected to follow a hump- shape distribution, which will be reflected in Equation (6) through negative and statistically significant δ, whereas under the null hypothesis of no barriers, δ should be zero and the M- values should follow a uniform distribution.
3.2.5 Conditional effects test. The final test of our methodology was introduced by Cyree et al. (1999) and is designed to detect changes in the conditional mean and variance of the
distribution of returns during the sub-periods before and after crossing a barrier, either from above or below. We use a five-day window before and after crossing a barrier.
In order to identify if a barrier is crossed in an upward or downward movement and examine the difference in returns between the five-day periods before and after the barrier is crossed, we will use four dummy variables: UB for the five-day period before prices cross a barrier on an upward movement, UA for the five-day period after prices cross a barrier on an upward movement, DB for the five-day period before prices cross a barrier on a downward movement and DA for the five-day period after prices cross a barrier on a downward movement. Each of these dummies will take the value 1 on the identified days and the value 0 elsewhere. Taking into account, as stated by Cyree et al. (1999), that the distributional shifts implied by psychological barriers invalidate the basic assumptions of
t—
OLS, we will then regress the following equations using a GARCH (1,1) model:
Rt ¼ b1 þb2UBt þb3UAt þb4DBt þb5DAt þet; (7)
et N ð0; VtÞ; (8)
Vt ¼ a1 þ a2U Bt þ a3U At þ a
e
4DBt þ a5DAt þ a6Vt—1 þ a7e2 1 þZt : (9)
In the absence of barriers, it is expected that the coefficients of the indicator variables will take the value zero both in the mean and variance equations, whereas any coefficient significantly different from zero (either positive or negative) will indicate the presence of psychological barriers.
The four null hypotheses to be tested using a Wald test are the following:
H1. There is no significant difference in the conditional mean return before and after an
upwards crossing of a barrier.
H2. There is no significant difference in the conditional mean return before and after a
downwards crossing of a barrier.
H3. There is no significant difference in the conditional variance before and after an
upwards crossing of a barrier.
H4. There is no significant difference in the conditional variance before and after a
downwards crossing of a barrier. 4. Empirical results
4.1 Uniformity test
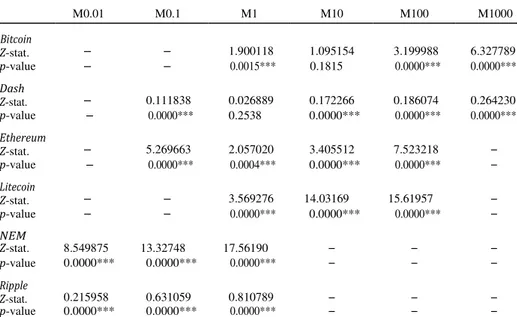
Table II shows the results of the uniformity tests for each cryptocurrency, using a Kolmogorov–Smirnov Z-test. Overall, the studied financial assets show signs of psychological
M0.01 M0.1 M1 M10 M100 M1000 Bitcoin Z-stat. – – 1.900118 1.095154 3.199988 6.327789 p-value – – 0.0015*** 0.1815 0.0000*** 0.0000*** Dash Z-stat. – 0.111838 0.026889 0.172266 0.186074 0.264230 p-value – 0.0000*** 0.2538 0.0000*** 0.0000*** 0.0000*** Ethereum Z-stat. – 5.269663 2.057020 3.405512 7.523218 – p-value – 0.0000*** 0.0004*** 0.0000*** 0.0000*** – Litecoin Z-stat. – – 3.569276 14.03169 15.61957 – p-value – – 0.0000*** 0.0000*** 0.0000*** – NEM Z-stat. 8.549875 13.32748 17.56190 – – – p-value 0.0000*** 0.0000*** 0.0000*** – – – Ripple Z-stat. 0.215958 0.631059 0.810789 – – – p-value 0.0000*** 0.0000*** 0.0000*** – – –
Notes: The results of a Kolmogorov–Smirnov test for uniformity. Z-stat. stands for the value of the test statistic; p-value shows the marginal significance of this statistic. H0: uniformity; H1: non-uniformity. *,**,***Significant at the 10, 5 and 1 percent levels, respectively
Table II. Uniformity test results
barriers, as there are statistically significant evidence at a 1 percent significance level that M- values do not follow a uniform distribution at, at least, three barrier levels for all the six assets. Additionally, the Ethereum, Litecoin, NEM and Ripple cryptocurrencies reject uniformity at a 5 percent significance level for every potential barrier level.
4.2 Barrier tests
4.2.1 Barrier proximity test. Table III–VI show the results of the barrier proximity
tests performed on the selected cryptocurrencies. As previously mentioned, in the presence of a psychological barrier, it is expected that β is negative and significant, which means that there is a lower frequency on the M-values which constitute the potential barrier.
Testing for psychological barriers in cryptocurrencies, when we consider a barrier to be in the exact zero modulo point (Table III), we find no negative and significant β estimates for any asset or any barrier level, even though we find negative (but not significant) estimates for all assets except NEM. When we assume a barrier in the 98-02 interval (Table IV ), Bitcoin and Dash present negative estimates for β for the 1,000-level potential barrier, both significant at a 10 percent level. Widening the interval to 95-05 (Table V), we find 9 negative and significant β estimates: Bitcoin at the 100 and 1,000-level barriers, Dash at the 1-, 10-, 100- and 1,000-level barriers, Litecoin at the 10- and 100-level barriers and Ripple at the 0.01-level barrier. Finally, considering a barrier to be in the 90-10 interval (Table VI), we find the same negative and significant estimates for β of the previous table except for Dash at the 1-level barrier, leading to a total of eight negative and significant β estimates. Once again, as we widen the barrier intervals some estimates change signal, becoming positive with the enlargement of the intervals, namely, for Ethereum at the 10- and 100-level barriers, Litecoin at the 1-level barrier and Ripple at the 0.1-level barrier.
Summing up, we are not able to reject the no-barrier hypothesis for Ethereum and NEM at any potential barrier level; Bitcoin presents some signs of the existence of a psychological barrier around the 100- and 1,000-level round numbers; Dash presents some signs of the existence of a psychological barrier around the 1-, 10-, 100- and 1,000-level round numbers; Litecoin presents some signs of the existence of a psychological barrier around the 10 and 100-level round numbers and the same happens with Ripple at the 0.01-level round numbers.
4.2.2 Barrier hump test. The barrier hump test examines the entire shape of the
distribution of M-values. As mentioned before, in the presence of barriers, these values are assumed to follow a hump-shape distribution, and thus δ is expected to be negative and significant in the presence of such barriers. Table VII shows the results of this test on the selected cryptocurrencies, which seem to corroborate most of the results obtained from the barrier proximity test.
We find negative and significant δ estimates for Bitcoin at the 100- and 1,000-level, Dash at the 10-level, Litecoin at the 10- and 100-level and Ripple at the 0.01-level, leading to a total of six potential barriers. This means that the barrier hump test does not detect signs of psychological barriers in three of the nine barrier levels which, according to the proximity test, exhibited some signs of psychological barriers, namely, Dash at the 1-, 100- and 1,000-level. The results also corroborate the absence of psychological barriers for Ethereum and NEM.
Summing up, at this point of our battery of tests, we have found consistent signs of the existence of psychological barriers around round numbers for four of the six selected cryptocurrencies – Bitcoin, Dash, Litecoin and Ripple. We also observe that, as we widen the barrier intervals, the existence of evidence supporting psychological barriers tends to become more frequent and also more significant.
¼ ¼ ¼ Cryptocurrency β M0.01 p- value R² β M0.1 p- value R² β M1 p- value R² β M10 p- value R² β M100 p- value R² β M1000 p- value R² Bitcoin – – – – – – 0.8221 0.0017*** 0.0963 −0.1235 0.6000 0.0028 −0.1826 0.5887 0.0039 −0.6555 0.4233 0.0066 Dash – – – 8.5420 0.0030*** 0.0861 −0.1546 0.5953 0.0029 −0.3685 0.6301 0.0024 −0.6536 0.4320 0.0063 −0.9388 0.3446 0.0091 Ethereum – – – 1.9811 0.0000*** 0.2638 0.0253 0.9440 0.0001 −0.0897 0.8709 0.0003 −0.6649 0.6899 0.0016 – – – Litecoin – – – – – – −0.4782 0.1363 0.0225 −0.8919 0.4467 0.0059 −0.8919 0.4781 0.0051 – – – NEM 2.3033 0.3506 0.0089 33.2289 0.0000*** 0.8285 69.3757 0.0000*** 0.9918 – – – – – – – – – Ripple −0.0069 0.9926 0.0001 −0.6966 0.8064 0.0006 64.9506 0.0000*** 0.9596 – – – – – – – – –
Notes: The results of a barrier proximity test using the regression f(M) α+βD+ε, where the dependent variable is the frequency of appearance of M-values, minus 1 percentage
point, and ð· is a dummy variable that takes the value 1 if M 00 and 0 otherwise (see Section 3.2.4. for further details). H0: β 0; H1: βo0. *,**,***Significant at the 10, 5 and 1
percent levels, respectively
T ab le II I. B ar rie r p ro x im ity te st re su lts fo r t h e str ic t d u m m y
¼
¼
Ripple −0.4515 0.1820 0.0181 −0.8174 0.5283 0.0041 16.223 0.0000*** 0.2873 – – – – – – – – – Notes: The results of a barrier proximity test using the regression f(M) α+βD+ε, where the dependent variable is the frequency of appearance of M-values, minus 1 percentage point, and ð· is a dummy variable that takes the value 1 if M⩾98 or M⩽02 and 0 otherwise (see Section 3.2.4. for further details). H0: β 0; H1: βo0. *,**,***Significant at the 10, 5 and 1 percent levels,
respectively T a b le I V . B ar rie r p ro x im ity te st re su lts fo r t h e 9 8 -0 2 d u m m y Cryptocurrency M0.01 p- β value R² β M0.1 p- value R² M1 p- β value R² β M10 p- value R² β M100 p- value R² M1000 p- β value R² Bitcoin – – – – – – 0.3271 0.0065*** 0.0731 −0.0455 0.4290 0.0064 −0.1657 0.2815 0.0118 −0.6584 0.0762* 0.0317 Dash – – – 0.9382 0.4850 0.0050 −0.1166 0.3798 0.0079 −0.5029 0.1481 0.0212 −0.5178 0.1714 0.0190 −0.8001 0.0760* 0.0318 Ethereum – – – 0.5539 0.0014*** 0.0990 0.0024 0.9884 0.0001 0.2182 0.3858 0.0077 −0.1175 0.8773 0.0002 – – – Litecoin – – – – – – −0.1287 0.3815 0.0078 −0.6708 0.2089 0.0161 −0.8555 0.1344 0.0227 – – – NEM 5.4138 0.0000*** 0.2358 8.6157 0.0000*** 0.2672 14.705 0.0000*** 0.2138 – – – – – – – – –
¼
¼
Notes: The results of a barrier proximity test using the regression f(M) α+βD+ε where the dependent variable is the frequency of appearance of M-values, minus 1 percentage point, and ð· is a dummy variable that takes the value 1 if M⩾95 or M⩽05 and 0 otherwise (see section 3.2.4. for further details). H0: β 0; H1: βo0. *,**,***Significant at the 10, 5 and 1 percent levels,
respectively T ab le V . B ar rie r p ro x im ity te st re su lts fo r t h e 9 5 -0 5 d u m m y Cryptocurrency β M0.01 p-value R² β M0.1 p-value R² β M1 p-value R² β M10 p-value R² β M100 p-value R² β M1000 p-value R² Bitcoin – – – – – – 0.1196 0.1589 0.0201 −0.0717 0.3379 0.0094 −0.2271 0.0326** 0.0458 −0.6813 0.0078*** 0.0700 Dash – – – −0.1216 0.8967 0.0002 −0.2009 0.0282** 0.0482 −0.4892 0.0423** 0.0414 −0.5613 0.0321** 0.0460 −0.8208 0.0083*** 0.0689 Ethereum – – – 0.2143 0.0821* 0.0305 −0.0184 0.8726 0.0003 0.1910 0.2752 0.0121 −0.0416 0.9374 0.0001 – – – Litecoin – – – – – – −0.0418 0.6839 0.0017 −0.6454 0.0814* 0.0307 −0.9742 0.0134** 0.0607 – – – NEM 2.5418 0.0009*** 0.1071 5.5067 0.0000*** 0.2250 6.6845 0.0023*** 0.0911 – – – – – – – – – Ripple −0.4705 0.0446* 0.0405 1.5457 0.0849* 0.0300 7.5502 0.0003*** 0.1282 – – – – – – – – –
¼
and ð· is a dummy variable that takes the value 1 if M⩾90 or M⩽10 and 0 otherwise (see Section 3.2.4. for further details). H0: β 0; H1: βo 0. *,**,***Significant at the 10, 5 and 1 percent levels,
respectively T a b le V I. B ar rie r p ro x im ity te st re su lts fo r t h e 9 0 -1 0 d u m m y Cryptocurrency β M0.01 p-value R² β M0.1 p-value R² β M1 p-value R² β M10 p-value R² β M100 p-value R² β M1000 p-value R² Bitcoin – – – – – – −0.0243 0.7108 0.0014 −0.0455 0.4290 0.0064 −0.1830 0.0247** 0.0504 −0.6698 0.0006*** 0.1147 Dash – – – 0.6314 0.3795 0.0079 −0.0620 0.3831 0.0078 −0.5342 0.0035*** 0.0836 −0.4576 0.0227** 0.0518 −0.6575 0.0058*** 0.0750 Ethereum – – – 0.0454 0.6336 0.0023 0.0730 0.4069 0.0070 0.4093 0.0019*** 0.0944 0.4642 0.2528 0.0133 – – – Litecoin – – – – – – 0.1097 0.1620 0.0199 −0.7932 0.0048*** 0.0785 −0.9872 0.0010*** 0.1057 – – – NEM 1.2327 0.0392** 0.0424 3.3898 0.0001*** 0.1445 3.4257 0.0446** 0.0405 – – – – – – – – – Ripple −0.6073 0.0006*** 0.1144 3.0857 0.0000*** 0.2025 3.8714 0.0166** 0.0571 – – – – – – – – –
¼
Notes: The results of a barrier hump test using the regression f(M) α+γM+δM2ε where the dependent variable is the frequency of appearance of M-values, minus 1 percentage point, regressed to the said
M-values and the respective squares (see Section 3.2.4. for further details). H0: δ ¼ 0; H1: δ o0. *,**,***Significant at the 10, 5 and 1 percent levels, respectively
T ab le V II. B ar rie r h u m p te st re su lts Cryptocurrency δ M0.01 p-value R² δ M0.1 p-value R² δ M1 p-value R² δ M10 p-value R² δ M100 p-value R² M1000 δ p-value R²
Bitcoin – – – – – – −1.11E-05 0.7567 0.0052 −3.78E-05 0.2298 0.0154 −8.72E-05 0.0398** 0.1445 −0.0004 0.0001*** 0.1985
Dash – – – 6.67E-05 0.8660 0.0031 −2.53E-05 0.5153 0.0105 −0.0002 0.0624* 0.1104 −2.55E-05 0.8136 0.0636 −0.0001 0.3873 0.1311
Ethereum – – – – – – 2.62E-05 0.5644 0.1177 0.0004 0.0000*** 0.3347 0.0006 0.0038*** 0.0939 – – –
Litecoin – – – – – – 0.0001 0.0006*** 0.2150 −0.0005 0.0003*** 0.2485 −0.0006 0.0001*** 0.2898 – – –
NEM 0.0007 0.0225** 0.1302 0.0019 0.0000*** 0.2641 0.0022 0.0145** 0.1046 – – – – – – – – –
t—1
4.3 Conditional effects test
Tables VIII–X present the results of the conditional effects test, where we examine the behavior of the selected cryptocurrencies’ prices in the five-day periods before and after crossing a barrier from below (thus, constituting a potential resistance level), and also in the five-day periods before and after crossing a barrier from above (thus, constituting a potential support level). We assess if the return series exhibit a pattern on these days which is significantly different from that when prices are not in the proximity of any barrier. We perform this test for one potential barrier level only for each asset, chosen as the most
likely to constitute an actual barrier level, according to the results from the previous tests. Therefore, this test is applied to the 0.1-level barrier for NEM and Ripple, to the 10-level barrier for Ethereum and Litecoin and to the 100-level barrier for Bitcoin and Dash. The results of the mean return equation are shown in Table VIII. We may observe that the mean return after crossing a barrier from below is positive for all the six cryptocurrencies – and significant at a 5 percent level for all of them except Litecoin – while before crossing a barrier in such movement it is positive for all cryptocurrencies but only significant at a 5 percent level for two of them: Bitcoin and Ripple. Still regarding the upward movements, the results show that the magnitude of returns is higher after crossing a barrier for all assets except Litecoin. The crossing of a barrier from below does not originate a change in the signal of the mean returns and regarding crossings from above we observe that the mean return is negative for all assets after crossing a barrier in such movement – significant at a 5 percent level for all cryptocurrencies but Ripple – and also negative before crossing the barrier for four assets – Dash and Ripple being the exceptions. Curiously, there are no negative and significant mean returns for any of the six studied cryptocurrencies in the five-day periods before crossing
C UB UA DB DA Bitcoin Coefficient 0.0473 0.6532 1.4683 −0.1983 −1.7376 p-value 0.5462 0.0131** 0.0000*** 0.5782 0.0000*** Dash Coefficient 0.1795 0.8628 2.5630 0.6653 −3.0760 p-value 0.2156 0.4316 0.0268** 0.0559* 0.0000*** Ethereum Coefficient 0.3179 0.2525 1.3925 −0.1249 −1.6333 p-value 0.1601 0.6747 0.0049*** 0.8291 0.0023*** Litecoin Coefficient −0.1418 2.2870 1.3822 −0.6813 −1.8873 p-value 0.3025 0.0908* 0.1519 0.5085 0.0086*** NEM Coefficient 0.3632 1.0636 5.9505 −1.2022 −5.1457 p-value 0.1155 0.1095 0.0106** 0.0937* 0.0062*** Ripple Coefficient −0.4388 3.4611 3.9798 1.9683 −1.8759 p-value 0.0000*** 0.0475** 0.0154** 0.4140 0.1406
Notes: The results of the mean equation of a GARCH estimation of Rt ¼ b1 þb2UBt þb3UAt þb4DBt þ b5DAt þ et ; et eN ð0; Vt ÞVt ¼ a1 þ a2U Bt þ a3U At þ a4DBt þ a5DAt þ a6Vt—1 þ a7e2 þZt , where UB, UA, Table VIII.
Conditional effects test results – return equation
DB and DA are dummy variables. UB takes the value 1 in the 5 days before crossing a barrier from below; UA takes the value 1 in the 5 days after crossing a barrier from below; DB takes the value 1 in the 5 days before crossing a barrier from above; DA takes the value 1 in the 5 days after crossing a barrier from above. *,**,***Significant at the 10, 5 and 1 percent levels, respectively
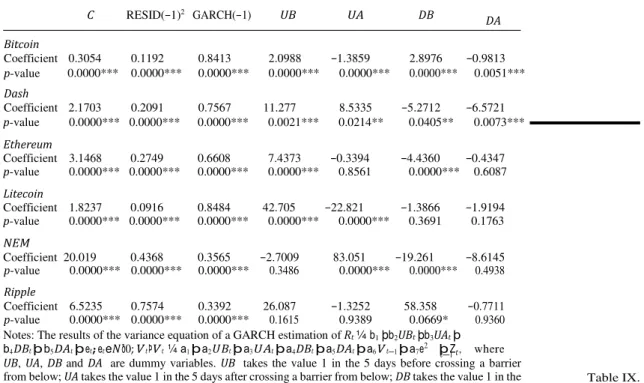
t—1 C RESID(−1)2 GARCH(−1) UB UA DB DA Bitcoin Coefficient 0.3054 0.1192 0.8413 2.0988 −1.3859 2.8976 −0.9813 p-value 0.0000*** 0.0000*** 0.0000*** 0.0000*** 0.0000*** 0.0000*** 0.0051*** Dash Coefficient 2.1703 0.2091 0.7567 11.277 8.5335 −5.2712 −6.5721 p-value 0.0000*** 0.0000*** 0.0000*** 0.0021*** 0.0214** 0.0405** 0.0073*** Ethereum Coefficient 3.1468 0.2749 0.6608 7.4373 −0.3394 −4.4360 −0.4347 p-value 0.0000*** 0.0000*** 0.0000*** 0.0000*** 0.8561 0.0000*** 0.6087 Litecoin Coefficient 1.8237 0.0916 0.8484 42.705 −22.821 −1.3866 −1.9194 p-value 0.0000*** 0.0000*** 0.0000*** 0.0000*** 0.0000*** 0.3691 0.1763 NEM Coefficient 20.019 0.4368 0.3565 −2.7009 83.051 −19.261 −8.6145 p-value Ripple 0.0000*** 0.0000*** 0.0000*** 0.3486 0.0000*** 0.0000*** 0.4938 Coefficient 6.5235 0.7574 0.3392 26.087 −1.3252 58.358 −0.7711 p-value 0.0000*** 0.0000*** 0.0000*** 0.1615 0.9389 0.0669* 0.9360
Notes: The results of the variance equation of a GARCH estimation of Rt ¼ b1 þb2UBt þb3UAt þ b4DBt þ b5DAt þ et ; et eN ð0; Vt ÞVt ¼ a1 þ a2U Bt þ a3U At þ a4DBt þ a5DAt þ a6Vt—1 þ a7e2 þ Zt , where UB, UA, DB and DA are dummy variables. UB takes the value 1 in the 5 days before crossing a barrier from below; UA takes the value 1 in the 5 days after crossing a barrier from below; DB takes the value 1 in the 5 days before crossing a barrier from above; DA takes the value 1 in the 5 days after crossing a barrier from above. Vt−1 refers to the moving average parameter and e2 stands for the GARCH parameter.
Table IX. Conditional effects test results – variance
*,**,***Significant at the 10, 5 and 1 percent levels, respectively t—1 equation
a barrier in a downward movement. The magnitude of returns is higher in the five-day periods after crossing a barrier for all assets and the crossing of a barrier in a downward movement promotes a sign change in the mean return of only two cryptocurrencies: Dash and Ripple.
Table IX shows the results of the variance equation. In the presence of psychological barriers, we should find positive variance indicators before crossing a barrier – meaning that the market is turbulent – and negative indicators after crossing a barrier – meaning that the market is calmer. Regarding upward movements, we find positive variance indicators before crossing a barrier for five cryptocurrencies and negative indicators after crossing a barrier for also five cryptocurrencies. As for downward movements, we find positive indicators before crossing barriers for two cryptocurrencies and negative indicators after crossing barriers for six cryptocurrencies. We observe that volatility tends to increase after crossing a barrier from below and decrease after crossing a barrier from above which, considering the results obtained for the mean return equation, is in line with the efficient market hypothesis and the reasoning that higher returns tend to compensate higher volatility levels. The GARCH term is positive and significant at a 1 percent level for every asset, indicating significant GARCH effects.
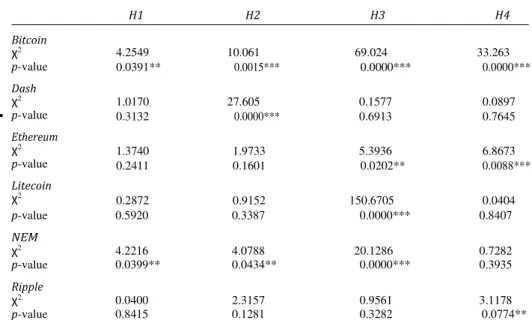
Finally, Table X exhibits the results of the Wald test to the hypotheses listed in Section 3.2.5. We find significant (at a 5 percent significance level) changes in the conditional mean returns after crossing a barrier in an upwards movement for two cryptocurrencies (Bitcoin and NEM), while for downwards movements, we observe that changes in the conditional mean returns are significant at 5 percent for three cryptocurrencies (Bitcoin, Dash and NEM). As for differences in the conditional variance, we observe significant results for four cryptocurrencies – Bitcoin, Ethereum, Litecoin and NEM – concerning upwards movements
Bitcoin χ2 p-value Dash χ2 p-value Ethereum χ2 p-value Litecoin χ2 H1 H2 H3 H4 4.2549 10.061 69.024 33.263 0.0391** 0.0015*** 0.0000*** 0.0000*** 1.0170 27.605 0.1577 0.0897 0.3132 0.0000*** 0.6913 0.7645 1.3740 1.9733 5.3936 6.8673 0.2411 0.1601 0.0202** 0.0088*** 0.2872 0.9152 150.6705 0.0404 Table X. Conditional effects test results p-value 0.5920 0.3387 0.0000*** 0.8407 NEM χ2 4.2216 4.0788 20.1286 0.7282 p-value 0.0399** 0.0434** 0.0000*** 0.3935 Ripple χ2 0.0400 2.3157 0.9561 3.1178 p-value 0.8415 0.1281 0.3282 0.0774**
Notes: The results of a Wald test to four hypotheses. H1: there is no significant difference in the conditional mean return before and after an upwards crossing of a barrier; H2: there is no significant difference in the conditional mean return before and after a downwards crossing of a barrier; H3: there is no significant difference in the conditional variance before and after an upwards crossing of a barrier; H4: there is no significant difference in the conditional variance before and after a downwards crossing of a barrier. *,**,***Significant at the 10, 5 and 1 percent levels, respectively
and regarding downwards movements we find significant differences for three cryptocurrencies, namely, Bitcoin, Ethereum and Ripple.
Summing up, the conditional effects test indicates that the magnitude of the mean returns is higher in the five-day period after crossing a barrier, both for upward and downward movements. Also, we observe that markets tend to be turbulent before crossing a barrier and calmer after that barrier is crossed, but results also show that volatility tends to stay aligned with returns, as predicted by the efficient markets hypothesis. Finally, analyzing the results of the Wald test, we observe significant signs of the existence of psychological barriers in all cryptocurrencies. Clearly, Bitcoin presents the stronger case for the existence of psychological barriers, as all four null hypotheses are rejected at a 5 percent significance level.
We are now in position to summarize the results of each test, reaching the global results shown in the last column of Table XI. The disagreement across tests in some of the
Uniformity test Barrier proximity test Barrier hump test Conditional effects test Psychological barriers?
Bitcoin Yes Yes Yes Yes Yes
Dash Yes Yes Yes Yes Yes
Ethereum Yes No No Yes No
Table XI. Litecoin Yes Yes Yes Yes Yes
Summary of results NEM Yes No No Yes No
cryptocurrencies stem from the different features of psychological barriers that were captured by the tests applied to our sample. For example, while uniformity tests only examine whether
M-values follow a uniform distribution, barrier proximity tests assess whether observations in
the vicinity of a potential barrier are relatively rarer than would be expected. Overall and considering the four tests we had conducted in this study, we can conclude that there are strong signs of psychological barriers in four of the cryptocurrencies under scrutiny: Bitcoin, Dash, Litecoin and Ripple. It is also noteworthy that the cryptocurrencies that present the least signs of psychological barriers are among the ones that exhibited the highest return and volatility (measured by the standard deviation of the returns).
5. Conclusion
In this paper, we conducted the first study on psychological barriers in the cryptocurrencies market.
We considered a sample of six of the most liquid cryptocurrencies. After analyzing the range of each asset’s quotes and defining all potential psychological barriers, we started by performing a uniformity test, observing that all assets rejected the null hypothesis, which claimed that the respective M-values followed a uniform distribution. Then, we conducted a barrier proximity test using several intervals to each of the previously defined potential barrier levels, finding signs of the existence of psychological barriers in four cryptocurrencies. The following test was a barrier hump test, which focused on the whole shape of the M-values distribution, assessing if they follow a uniform distribution or a hump-shape distribution – as should be the case in the presence of psychological barriers – and it confirmed the majority of the previous test’s results. Finally, we conducted a conditional effects test, in its three modalities: mean return equation, variance equation and hypotheses test. The mean return equation indicated that in all financial markets the magnitude of the mean returns tended to be higher in the five-day period after crossing a barrier, both for upward and downward movements; the variance equation led to the conclusion that markets were significantly more volatile before crossing a barrier; and, through the hypotheses test, we observed signs of the existence of psychological barriers in four cryptocurrencies.
Overall, we found evidence of the existence of psychological barriers in four of the cryptocurrencies under study: Bitcoin, Dash, Litecoin and Ripple. Among all the cryptocurrencies, Bitcoin – the quasi-monopolist leader of the cryptocurrencies market – is by far the one which presents stronger signs of psychological barriers.
The results of our study may potentially be used by investors to build more profitable strategies when in presence of psychological barriers. Moreover, our results seem difficult to reconcile with the efficient market paradigm, since one of the chief features of an efficient capital market is that prices should not exhibit any particular patterns (Fama, 1970).
Our results are also relevant to the debate about the prevalence of decision-making biases in different categories of investors. Given that the cryptocurrency market is essentially inhabited by unexperienced investors (Yermack, 2015; Kow, 2017), our results suggest that this category of investors is particularly susceptible to the decision-making biases usually associated with the formation of psychological price barriers.
Our study presents several limitations which may lead to future research on this topic: for instance, studies with broader samples, namely, a larger set of cryptocurrencies, could lead to stronger results; it could be fruitful to analyze the prevalence of psychological barriers in different time periods according to the price trend prevailing in the market at the time; it would be interesting to investigate the characteristics of cryptocurrencies (in terms of liquidity, volatility, transaction volume, etc.) that tend to lead to a higher prevalence of psychological barriers; and, finally, the finding of significant psychological barriers in some cryptocurrencies implies the need to address its practical implications, namely, the possibility to earn extraordinary profits exploiting that anomaly.
References
Aggarwal, R. and Lucey, B.M. (2007), “Psychological barriers in gold prices?”, Review of Financial Economics, Vol. 16 No. 2, pp. 217-230.
Bahng, S. (2003), “Do psychological barriers exist in the stock price indices? Evidence from Asia’s emerging markets”, International Area Studies Review, Vol. 6 No. 1, pp. 35-52.
Baig, A., Blau, B.M. and Sabah, N. (2019), “Price clustering and sentiment in Bitcoin”, Finance Research Letters, Vol. 29, pp. 111-116.
Barriviera, A.F. (2017), “The inefficiency of Bitcoin revisited; a dynamic approach”, Economics Letters, Vol. 161, pp. 1-4.
Bertola, G. and Caballero, R.J. (1992), “Target zones and realignments”, American Economic Review, Vol. 82 No. 3, pp. 520-536.
Brenner, G.A. and Brenner, R. (1982), “Memory and markets, or why are you paying $2.99 for a widget?”, Journal of Business, Vol. 55 No. 1, pp. 147-158.
Burke, S. (2001), “Barriers in US benchmark bonds”, Unpublished manuscript, Vancouver.
Cheah, E. and Fry, J. (2015), “Speculative bubbles in Bitcoin markets? An empirical investigation into the fundamental value of Bitcoin”, Economics Letters, Vol. 130, pp. 32-36.
Corbet, S., Lucey, B. and Yarovaya, L. (2018), “Datestamping the Bitcoin and Ethereum bubbles”, Finance Research Letters, Vol. 26, pp. 81-88.
Cyree, K.B., Domian, D.L., Louton, D.A. and Yobaccio, E.J. (1999), “Evidence of psychological barriers in the conditional moments of major world stock indices”, Review of Financial Economics, Vol. 8 No. 1, pp. 73-91.
De Ceuster, M.J.K., Dhaene, G. and Schatteman, T. (1998), “On the hypothesis of psychological barriers in stock markets and Benford’s law”, Journal of Empirical Finance, Vol. 5 No. 3, pp. 263-279. Donaldson, R.G. and Kim, H.Y. (1993), “Price barriers in the Dow Jones industrial average”, Journal of
Financial and Quantitative Analysis, Vol. 28 No. 3, pp. 313-330.
Dorfleitner, G. and Klein, C. (2009), “Psychological barriers in European stock markets: where are they?”, Global Finance Journal, Vol. 19 No. 3, pp. 268-285.
Dwyer, G.P. (2015), “The economics of Bitcoin and similar private currencies”, Journal of Financial Stability, Vol. 17, pp. 81-91.
Fama, E.F. (1970), “Efficient capital markets: a review of theory and empirical work”, Journal of Finance, Vol. 25 No. 2, pp. 383-417.
Folkertsma, C.K. (2002), “The euro and psychological prices: simulations of the worst-case scenario”, De Economist, Vol. 150 No. 1, pp. 19-40.
Fry, J. and Cheah, E. (2016), “Negative bubbles and shocks in cryptocurrency market”, International Review of Financial Analysis, Vol. 47, pp. 343-352.
Hirshleifer, D. (2001), “Investor psychology and asset pricing”, Journal of Finance, Vol. 56 No. 4, pp. 1533-1597.
Holdershaw, J., Gendall, P. and Garland, R. (1997), “The widespread use of odd pricing in the retail sector”, Marketing Bulletin-Department of Marketing Massey University, No. 8, pp. 53-58. Hu, B., McInish, T. and Miller, J. (2019), “Intraday price behavior of cryptocurrencies”, Finance Research
Letters, Vol. 28, pp. 337-342.
Kahn, C., Pennacchi, G. and Sopranzetti, B. (1999), “Bank deposit rate clustering: theory and empirical evidence”, Journal of Finance, Vol. 54 No. 6, pp. 2185-2214.
Koedijk, K.G. and Stork, P.A. (1994), “Should we care? Psychological barriers in stock markets”, Economics Letters, Vol. 44 No. 4, pp. 427-432.
Kow, Y.M. (2017), “Cryptocurrencies and their potential for large-crowd, cost-effective transactions in peer production”, First Monday, Vol. 22 No. 8.
Ley, E. and Varian, H.R. (1994), “Are there psychological barriers in the Dow-Jones index?”, Applied Financial Economics, Vol. 4 No. 3, pp. 217-224.
Lobão, J. and Fernandes, J. (2018), “Psychological barriers in single stock prices: evidence from three emerging markets”, Revista Brasileira de Gestão de Negócios, Vol. 20 No. 2, pp. 248-272. Mbanga, C.L. (2019), “The day-of-the-week pattern of price clustering in Bitcoin”, Applied Economic
Letters, Vol. 26 No. 10, pp. 807-811.
Mitchell, J. (2001), “Clustering and psychological barriers: the importance of numbers”, Journal of Futures Markets, Vol. 21 No. 5, pp. 395-428.
Philip, A., Chan, J. and Peiris, S. (2018), “A new look at cryptocurrencies”, Economics Letters, Vol. 163, pp. 6-9.
Schwartz, A.L., Van Ness, B.F. and Van Ness, R.A. (2004), “Clustering in the futures market: evidence from S&P 500 futures contracts”, Journal of Futures Markets, Vol. 24 No. 5, pp. 413-428. Shawn, L.K.J. and Kalaichelvan, M. (2012), “A critical evaluation of the significance of round numbers
in European equity markets in light of the predictions from Benford’s law”, International Research Journal of Finance and Economics, No. 95, pp. 196-210.
Simon, H.A. (1955), “A behavioral model of rational choice”, Quarterly Journal of Economics, Vol. 69 No. 1, pp. 99-118.
Sonnemans, J. (2006), “Price clustering and natural resistance points in the Dutch stock market: a natural experiment”, European Economic Review, Vol. 50 No. 8, pp. 1937-1950.
Tversky, A. and Kahneman, D. (1974), “Judgment under uncertainty: heuristics and biases”, Science, Vol. 185 No. 4157, pp. 1124-1131.
Urquhart, A. (2016), “The inefficiency of Bitcoin”, Economics Letters, Vol. 148, pp. 80-82. Urquhart, A. (2017), “Price clustering in Bitcoin”, Economics Letters, Vol. 159, pp. 145-148.
Westerhoff, F. (2003), “Anchoring and psychological barriers in foreign exchange markets”, Journal of Behavioral Finance, Vol. 4 No. 2, pp. 65-70.
Woodhouse, S.A., Singh, H., Bhattacharya, S. and Kumar, K. (2016), “Invisible walls: do psychological barriers really exist in stock index levels?”, North American Journal of Economics and Finance, Vol. 36, pp. 267-278.
Xin, L., Shenghong, L. and Chong, X. (2019), “Price clustering in Bitcoin market – an extension”, Finance Research Letters, forthcoming.
Yermack, D. (2015), “Is Bitcoin a real currency? An economic appraisal”, in Chuen, D.L.K. (Ed.), Handbook of Digital Currency, chapter 2, Academic Press, Cambridge, MA, pp. 31-43.