The active centers of adenylylsulfate reductase from
Desulfovibrio gigas
Characterization and spectroscopic studies
Jorge LAMPREIA', Isabel MOURA ', Miguel TEIXEIRA**', Harry D. PECK Jr3, Jean LEGALL', Boi H. HUYNH' and Jose J. G. MOURA'
'
Centro de Quimica Estruturdl, Universidade Nova de Lisboa, Lisboa, Portugal'
Department of Physics, Emory University, Atlanta, USA Department of Biochemistry, University of Georgia, Athens, USA (Received March 15/November 8, 1989) - EJB 890314In order to utilize sulfate as the terminal electron acceptor, sulfate-reducing bacteria are equipped with a complex enzymatic system in which adenylylsulfate (AdoPSO,) reductase plays one of the major roles, reducing AdoPS04 (the activated form of sulfate) to sulfite, with release of AMP. The enzyme has been purified to homogeneity from the anaerobic sulfate reducer Desulfovihrio gigas. The protein is composed of two non-identical subunits (70 kDa and 23 kDa) and is isolated in a multimeric form ( z 400 kDa). It is an iron-sulfur, flavin- containing protein, with one FAD moiety, eight iron atoms and a minimum molecular mass of 93 kDa.
Low-temperature EPR studies were performed to characterize its redox centers. In the native state, the enzyme showed an almost isotropic signal centered at g = 2.02 and only detectable below 20 K. This signal represented a minor species (0.10 - 0.25 spins/mol) and showed line broadening in the enzyme isolated from 57Fe-grown cells. Addition of sulfite had a minor effect on the EPR spectrum, but caused a major decrease in the visible region of the optical spectrum (around 392 nm). Further addition of AMP induced only a minor change in the visible spectrum whereas major changes were seen in the EPR spectrum; the appearance of a rhombic signal at g values 2.096, 1.940 and 1.890 (reduced Fe-S center I) observable below 30 K and a concomitant decrease in intensity of the g = 2.02 signal were detected. Effects of chemical reductants (ascorbate, H,/hydrogenase-reduced methyl viologen and dithionite) were also studied. A short time reduction with dithionite (15 s) or reduction with methyl viologen gave rise to the full reduction of center I (with slightly modified g values at 2.079, 1.939 and 1.897), and the complete disappearance of the g = 2.02 signal. Further reduction with dithionite produces a very complex EPR spectrum of a spin-spin-coupled nature (observable below 20 K), indicating the presence of at least two iron-sulfur centers, (centers I and 11).
Mossbauer studies on "Fe-enriched D. gigas Ado P S 0 4 reductase demonstrated unambiguously the presence of two 4Fe clusters. Center I1 has a redox potential
<
400 mV and exhibits spectroscopic properties that are characteristic of a ferredoxin-type [4Fe-4S] cluster. Center I exhibits spectra with atypical Mossbauer parameters in its reduced state and has a midpoint potential around 0 mV, which is distinct from that of a ferredoxin-type [4Fe-4S] cluster, suggesting a different structure and/or a distinct cluster-ligand environment.Inorganic sulfur usually enters biosynthetic pathways at the oxidation level of sulfate or sulfide. Plants, animals and microorganisms are able to incorporate sulfate into several organic compounds. Microorganisms and plants can reduce sulfate to the level of sulfide which is subsequently incorpo- rated into sulfur-containing amino acids and coenzymes [I]. This process is known as assimilatory sulfate reduction. How- ever, an important group of anaerobic bacteria, the sulfate- reducing bacteria, can utilize sulfate as a terminal electron acceptor in a respiratory-like process with concomitant ac- cumulation of large amounts of sulfide (dissimilatory sulfate reduction).
A key step in the sulfur cycle is the conversion of sulfate to sulfite. The process of sulfate reduction requires initial enzymatic activation of the sulfate molecule. Three major enzymes are involved in the dissimilatory reduction of sulfate :
Correspondence to J. J. G. Moura, Ccntro de Tecnologia Quimica e Biologia, rua de Quinta Grande 6 , apt. 127, P-2780 Oeiras, Portugal
Ahhrevution. AdoPSO,, adenylylsulfate.
Enzymes. ATP sulfurylase (EC 2.7.7.4); adenylylsulphate re- ductase (EC 1.8.99.2); bisulfite reductase (EC 13.99.1); hydrogenase (EC 1.2.2.1).
ATP sulfurylase [2], adenylylsulfate reductase [3] and bisulfite reductase
[4],
as shown schematically below:ATP
+
SO:-4
ATP sulfurylaseI
AdoPSO, reductase HSO,I
bisulfite reductase S2 ~ pyrophosphataseAdoPSO,
+
PPi P2PiIn the sulfate-reducing bacteria, AdoPS0, reductase is a major soluble cytoplasmic component. However, it was re- cently found that in Desuljbvibrio thermophilus, AdoPSO, reductase is clearly membrane associated [5], as in the case of the enzyme isolated from purple sulfur bacteria belonging to the Chromutiaceue species, where AdoPS04 reductase is associated with the chromatophores [6]. Tetrahemic cyto- chrome c3 (13 kDa), ferredoxin and flavodoxin stimulate the reduction of sulfate but werc not demonstrated conclusively to be donors ofelectrons to the reductase [7]. AdoPS04 reduc-
tase catalyses the reduction of adenylylsulfate to sulfite and AMP in the presence of reduced methyl viologen (H2 plus hydrogenase), but the reverse reaction can be accomplished in the presence of ferricyanide and 02/cytochrome c. Cytochromes cox and c,,d are the oxidised and reduced forms, respectively of cytochrome c.
AdoPSO,
+
2 methyl viologen--
AMP+
SO:-+
2 methyl viologenSO;-
+
AMP+
2 Fe(CN);--
AdoPSO,+
SO:-
+
AMP+
2 cytochrome cox-
AdoPSO,+
2 Fe(CN)g-
2 cytochrome C,,d A mechanism was proposed involving the formation of a sulfite adduct on the N5 position of the enzyme-bound flavin isoalloxazine ring similar to those reported for model com- pounds [S], glucose oxidase [9] and other flavoproteins [lo]. Recently described species of new genera of sulfate-reducing bacteria, Desulfobulbus propionicus, Desulfobacter postgatei, Desulfoccoccus multivorans and Desulfosarcina variahilis also contained AdoPSO, reductase in sufficient concentrations to account for dissimilatory sulfate reduction [Ill, as well as a new, extremely thermophilic sulfate-reducing archaebac- terium named VC-16 [12]. A comparative spectroscopic study of the active centers of AdoPS0, reductases, isolated from seven different Desulfovibrio species, clearly indicates that the enzyme is highly conserved in the anaerobic pathway of sulfate reduction (our unpublished results).
The AdoPSO, reductase has been partially purified from Desulfovibrio desulfuricans [ 131 and to an essentially homo- geneous state from Desuljovibrio vulgaris (Hildenborough) [3]. The D. vulgaris enzyme was reported to have been isolated in a dimeric form (monomeric unit of molecular mass 220 kDa) and to contain 1 FAD and 12 non-heme iron atoms/monomer- ic unit. Some physical and kinetic properties of the enzyme were reported, but no information has been obtained about the nature of the iron-sulfur clusters and their participation in the catalytic cycle.
The purpose of this paper is to describe the purification and characterization of AdoPS04 reductase from D. gigas with respect to its physiological properties, active site compo- sition, redox potentials and structure. The structural effects of natural and artificial substrates and reductants on the active centers are also considered. In order to achieve this aim, extensive EPR, Mossbauer and ultravioletjvisible spectro- scopic experiments were performed with the purified prep- aration.
MATERIALS AND METHODS Organism and medium
cell-free extracts were as previously described [14].
The growth of D . gigas (NCIB 9332) and preparation of
Analytical determinations and reagents
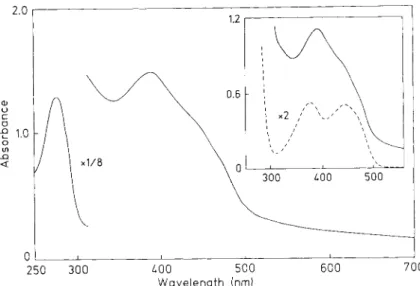
Flavin was determined using trichloroacetic acid as a protein-precipitating agent. A visible spectrum of a solution containing AdoPS0, reductase was recorded and 80% trichloroacetic acid was added to the enzyme. The precipitate was centrifuged and another spectrum was taken of the super- natant containing the flavin. The concentration of the flavin was then determined using the molar absorption coefficient
of 11.3 x l o 3 M - ~ ' . cm-' (Fig. 1). Iron was detemined by plasma emission in a Mark I1 Jarrell-Ash spectrometer model 965 Atom Comp. Protein was determined using the colori- metric method described by Lowry et al. [IS].
PAGE both with and without SDS were used to determine protein purity, subunity composition and molecular mass.
The molecular mass of the enzyme was also determined with a HPLC column of Sephddex TSK-G3000 S.W. from LKB (600 mm x 7.5 mm) using Pharmacia standards: ferritin (440 kDa), catalase (240 kDa), serum albumin (65 kDa), ovalbumin (45 kDa) and chymotrypsinogen (13.7 kDa). Phos- phate buffer (0.1 M PJ0.l M NaCl, pH 7.00) was used as the mobile phase.
All chemicals and reagents were of analytical grade and obtained commercially. AdoPSO,, AMP, ATP, UMP, GMP and CMP were all obtained from Sigma. Chromatographic supports [DEAE, DEAE-agarose (BioGel DEAE-SPW) Sephadex, hydroxylapatite], were from Whatman, Bio-Rad and Pharmacia.
Spectroscopic methods
Visible and ultraviolet spectra was recorded with a Shimadzu UV-240 split-beam spectrophotometer using I-cm quartz cells.
EPR measurements were made with a Bruker Er-200 tt spectrometer fitted with an Oxford Instruments ESR-9 con- tinuous flow helium cryostat and connected to an IBM-AT computer using a Data Translation DT-2801 board for acqui- sition of the experimental data.
Standard transmission Mossbauer measurements were made with a 50 mCi 57Co(Rh) source driven by a Doppler velocity transducer operating in a constant acceleration mode. The weak-field Mossbauer spectrometer was equipped with a Ranger VT-700 velocity transducer and a top-loading Janis 8DT Super Varitemp cryostat. The strong-field spectrometer was equipped with a top-loading Janis 12 CNDTjSC Super Varitemp cryostat complete with an American Magnetics 8-T superconducting magnet and a home-built Doppler velocity transducer. Absorber temperatures (1.5 K, or 1.5 - 250 K) were controlled by a Lake Shore 520 cryogenic temperature controller. The velocity scale was calibrated using room-tem- perature Mossbauer spectra of a metallic iron foil. The zero velocity was referred to the centroid of these spectra.
Preparation of samples
EPR samples were prepared (under argon when required) by the direct addition of AMP, sulfite, ascorbate, AdoPSO, and borohydride in quartz tubes of calibrated internal diame- ter. The dithionite solution for AdoPSO, reductase reduction was prepared by adding 1 g sodium dithionite to 50 ml degassed 0.2 M TrisjHC1 (pH 9.5). Methyl viologen was re- duced either with metallic zinc under argon or in the presence of traces of
D.
gigas hydrogenase under a H 2 atmosphere. Spin measurements were made against CuEDTA standards and calculated numerically with base line and Aasa and Vangard corrections [I 61.AdoPS0, reductase assay
Enzyme activity was determined using ferricyanide as elec- tron acceptor as previously described [3], in I-ml quartz cells. The reaction mixture contained 1.3 mM ferricyanide, 3 mM sodium sulfite in 5 mM EDTA, 3.3 mM AMP, 0.5 mM 2-
~-
250 300 LOO 500 600 700
Wavelength (nrn)
Fig. 1. Absorbance spectrum of D. gigas AdoPS04 reductase. Protein fraclion after HPLC purification step. Protein concentration 30 pM in 100 m M Tris/HCl, pH 7.6. (A) Spectrum of the protein solution for the trichloroacetic acid flavin extraction (50 p1 AdoPSO, stock solution (416 pM) plus 800 p1 100 pM Tris buffer, A 3 9 2 = 1.095. (B) Spectrum of flavin, extracted as described in Materials and Methods. 50 pl
AdoPS04 stock solution plus 800 pl Tris buffer plus 100 pl 80% trichloroacetic acid (A441 = 0.252)
mercaptoethanol in 100 mM Tris/HCl (pH 7.6) and the en- zyme. The reduction of ferricyanide was followed at 420 nm using the reaction mixture without enzyme as a blank.
Redox titrations
EPR redox titrations were carried out in an anaerobic cell slightly modified from the one designed by Dutton [17]. The sample was kept at 25 "C in a positively pressurised argon atmosphere which was purified by flushing it through two vessels containing an alkaline solution of sodium dithionite. The system was calibrated with quinhydrone and the pH controlled. The redox potential was measured directly in the cell utilizing saturated calomel and platinum electrodes. The redox potential was varied by adding aliquots of 0.1 M sodium dithionite with a gas-tight Hamilton syringe. The samples were then transferred to EPR tubes kept under argon and immediately frozen in liquid nitrogen. Dye mediators were added as described in [18]. The reaction mixture was buffered with 0.1 M Tris/HCl (pH 9).
Visible redox titrations were carried out by a similar anaer- obic procedure. The mediators were selected in order to minimize their interference with the AdoPS04 reductase, vis- ible absorption band measured during the redox titration at 392 nm.
RESULTS AND DISCUSSION
Puri#ication of AdoPSO, reductase f r o m D. gigas
The purification of the enzyme was devised in order to optimize the number of steps and minimize the time required to obtain the purified reductase. The purity of the enzyme was checked during the purification procedure by activity measurements and spectral characteristics ( A 2 8 0 / A 3 9 2 ) . 300 ml crude extract containing 9.2 g total protein was ap- plied to a Bio-Gel DEAE-agarose column (25 c m x 3 cm) equilibrated with 10 mM Tris/HCl, pH 7.6. The column was washed with 100 m130 mM Tris/HCl and a linear salt gradient (30-300 mM Tris/HCl, pH 7.6) was applied. AdoPS04 re- ductase was eluted between 0.15 M and 0.17 M. The enzyme
solution was dialyzed overnight against 10 mM Tris buffer (final volume 300 ml). This fraction was applied to another Bio-Gel DEAE-agarose column. The overall procedure was repeated and 190 ml AdoPS04 reductase was obtained which were dialyzed again. A final purification step in an HPLC system with a preparative DEAE TSK 5 PW column (21.5 c m x2.1 cm) from LKB was performed to obtain the pure reductase. The elution was carried out with a programmed salt gradient with concentrations of 10 - 250 mM Tris/HCl, pH 7.6. Due to its poor stability during storage, the enzyme was concentrated and frozen in small beads in liquid nitrogen. The enzyme was judged to be homogeneous by gel electrophoresis and a 10% yield was obtained. The specific activity was about 6 units (1 unit = 1 pmol AdoPSO, reacted . min-' . mg-'). This enzyme was used for spectro- scopic studies and kinetic measurements.
Stability
The purified enzyme is very unstable during storage and loses much of its activity after 30 days at -20°C. In liquid nitrogen, it aggregates and precipitates in less than six months and activity is not recoverable from the precipitate. Because of this problem, the AdoPS04 reductase was only purified when needed.
Activity studies
Using 3.3 mM sulfite and 3.3 mM AMP, K, values for sulfite (0.34 mM) and for AMP (0.16 mM) were determined by double-reciprocal kinetic analysis. These assays showed that the activity is more dependent on the sulfite concen- tration. In fact, some residual activity was retained for much lower concentrations of AMP than sulfite, according to the K,,, values.
The specific activities found for D . gigas AdoPSO, re- ductase were consistent with the specific activities found in our laboratory for other Desuljovibrio species and also paral- lels the previously reported values for the D . vulgaris enzyme [3]. Tests with Tris/malate at different pH values, under other-
wise constant conditions, showed an optimum pH of 7.4 and the usual bell-shaped curve was obtained.
The effect of the different nucleotides, ATP, UMP, CMP and GM P on the specific activity of AdoPSO, reductase with ferricyanide was studied using the activity towards AMP as 100%. All nucleotides were present at the same concentration (3.3 mM) in the enzymatic assay. The nucleotide specificity in the ferricyanide assay was as follows: AMP (100%), GMP (loo%), CMP (41%), UMP (36%) and ATP (0%).
Molecular m~ass, iron andflavin content
AdoPSO, reductase from D. gigus was isolated in a multimeric state of molecular mass z 400 kDa, as measured by retention times in HPLC gel filtration. SDSjPAGE indi- cated the presence of two different subunits of 70 kDa and 23 kDa, respectively. Several determinations of the prosthetic group ratio gave repeatedly 1 FAD/8 iron atoms (within 10Y0). A value of 7.8 0.8 iron atoms/93-kDa protein was obtained. Flavin was determined after extraction with 80%
trichloroacetic acid, as shown in Fig. 1 (insert). Further ex- traction with trichloroacetic acid did not release an additional flavin component. The molar absorption coefficient of the reductase at 392 nm was calculated to be 50000 M-’ . cm-’ with eight iron atoms. This value strongly supports the chemi- cal analysis, indicating the presence of one FAD and two (4Fe- 4S] clusters (see also below).
Spectroscopic and redox studies on the enzyme active centers Visible spectroscopy
The visible/ultraviolet spectrum of the oxidized form of purified D . gigas AdoPS04 reductase (Fig. 1) shows a broad maximum around 392 nm with shoulders at 445 nm and 475 nm and a protein absorption peak at 278 nm ( A 2 7 8 /
A 3 g 2 ) = 4.97). The overall spectrum indicated the presence
of iron-sulfur clusters as well as flavin. The general features of the spectrum were similar to those for the D. vulgaris enzyme reported by Bramlett and Peck [3] which has absorp- tion maxima at 372 nm and 278 nm.
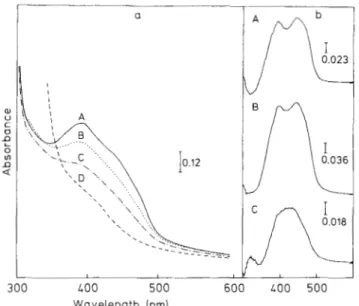
The addition of sulfite to the native enzyme (Fig. 2a, trace B) caused a decrease in absorbance between 500 nm and 340 nm then a slight increase in absorbance appeared around 320 nm, which is consistent with the formation of an adduct between the FAD and sulfite as previously described [19]. Further addition of AMP caused a minor bleaching of the spectrum, but AMP had no effect on the spectrum in the absence of sulfite (not shown). Addition of dithionite to the enzyme caused further bleaching in the overall spectrum. Dif- ference spectra were obtained in order to characterize the chromophores reacting with AMP, sulfite and dithionite (Fig. 2, right panel). A flavin-like spectrum (Fig. 2b, trace A) was obtained when the spectrum of the native enzyme was run against the sulfite-reacted enzyme, suggesting the formation of a flavin-sulfite adduct in the sulfite-reacted enzyme. Also a broad peak in the 400 - 450 nm region (Fig. 2 b, trace C) was found in the difference spectrum between the AMP/sulfite- reacted enzyme and the sulfite-reacted enzyme. This spectral change seems to be related to the reduction of the iron-sulfur centers of the enzyme, suggesting that AMP facilitates the reduction of these centers in the presence of sulfite [20, 211. E P R spectroscopy
The native protein. In the native state, AdoPSO4 reductase showed an almost isotropic signal centered around g = 2.02
a
300 LOO 500 600 LOO 500
Wavelength Inm)
Fig. 2. Effect of‘ suhstrutes and reductunts on the visible spectrum uf D. gigas AduPS04 reductase. (a) A, Native enzyme; B, after sulfite addition; C, B after AMP addition; D, C after dithionite addition. (b) Difference spectra; (A) native minus sulfite-reacted; (B) native minus sulfite/AMP-reacted ; (C) sulfite-reacted minus sulfite/AMP- reacted
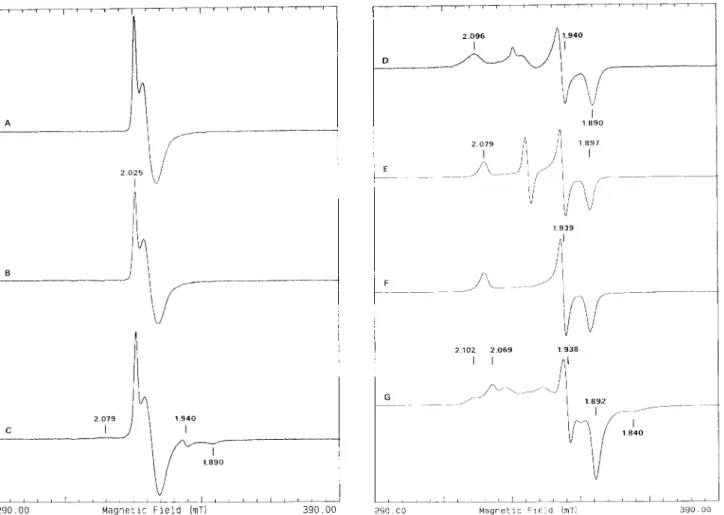
(Fig. 3A), detectable at temperatures below 35 K. This sig- nal was integrated for several preparations obtained from different batches and accounted for much less than 1 spin/8 Fe (0.10-0.25 spin/8 Fe). The addition of ferricyanide to the enzyme slightly modified the shape of the spectrum but did not significantly change its intensity. This was undoubtedly due to iron, confirmed by the observation of a 1.5-mT line broadening in the EPR spectrum of the enzyme isolated from cells grown in 57Fe-enriched medium (not shown). Also the metal plasma-emission analysis did not indicate the presence of other metals in the purified preparations. The spectral shape and temperature-dependence of this signal are consistent with those observed for [3Fe-4S] clusters [22]; however, the Mossbauer studies described below did not detect the presence of [3Fe-4S] clusters. Since this signal accounts for only % 0.15 spin/8 Fe, it may be at the limit of detection for Mossbauer measurements.
Addition qfnatural substrates. Reaction of the enzyme with AMP (Fig. 3 B) caused no change in the native EPR spectrum. Addition of sulfite to the native enzyme yielded a weak ‘g = 1.94’-type signal (Fig. 3C), indicating the partial reduction of the enzyme. The extent of the reduction depended on the preparation and may be related to the existence of AMP, intrinsically bound to the native enzyme [23]. Some prep- arations did not show alteration of the EPR features upon reaction with sulfite. The minor alterations observed in the EPR spectra upon reaction with sulfite were in contrast with the observations made by visible spectroscopy where the ad- dition of sulfite caused a major effect on the visible spectrum. This observation is consistent with the formation of a N5
adduct of FAD, which in the absence of AMP, does not generate electrons for the reduction of non-heme iron. How- ever, the addition of both AMP and sulfite (Fig. 3 D) drasti- cally changed the overall spectrum; the isotropic signal de- creased in intensity and a rhombic signal appeared with g values of 2.096 (line width 6.5 mT), 1.940 and 1.890, character- istic of a reduced iron-sulfur center (designated as center I). In this state, the intensity of the spectrum accounted for % 0.40 -
2 0 2 5 I I /
b
i
7 "74 2.096 1.940 D4'
Lv7/----
I i ago 1 9 3 9 In
2 1 0 2 2 0 6 9 1 9 3 8 I IFig. 3. X-bandEPR spectra ofD. gigas AdoPS04 reductase (g = 2 region) in the native andreactedstates. Experimental conditions: temperature, 8 K ; modulation amplitude, 1 mT; microwave power, 0.2 mW; scan width, 100 mT. Gain of spectra E - G : 3.2 x lo4. Spectrum D is increased by a factor of six. (A) Native enzyme; (B) AMP-reacted; (C) sulfite-reacted; (D) sulfite/AMP-reacted; (E) methyl-viologen-reduced; (F) dithionite-reduced (1 5 s); (G) dithionite-reduced (30 min)
0.52 spin/8 Fe. The intensity of this signal could be almost
doubled by further reduction with sodium dithionite; how- ever, the line width and g values of the EPR signal were not altered. The addition of AdoPS0, alone or AdoPSO, plus sulfite had no effect on the EPR features of the native enzyme spectrum.
The partially reduced AdoPS0, reductase. Addition of ascorbate to the native enzyme induced a rather minor change in the spectrum; it reduced a very small fraction of an iron- sulfur center, indicated by the appearance of a rhombic EPR signal, with g values of 2.079, 1.939 and 1.897 (not shown). The addition of HJhydrogenase-reduced methylviologen or sodium dithionite for a very short reduction time (15 s) gave rise to the full development of this signal, attributed to reduced center I (the g values are slightly different from those observed for the AMP sulfite-reduced center I) and the complete disap- pearance of the g = 2.02 signal (Fig. 3 E and F). Spin measure- ments of the fully developed reduced center I spectra of differ- ent preparations yielded a range of 0.75 -0.90 spin18 Fe. Even after treatment with borohydride or with reduced methyl- viologen in the presence of Zn or H,/hydrogenase, no ad- ditional signals were observed.
M
ossbauer results presented below, indicate that the methylviologen-reduced enzyme cor- responds to a half-reduced state; only one of the two [4Fe-4S] clusters was reduced. In addition to the EPR signals due to the reduced center I, a very short reduction with substoichiometric amounts of sodium dithionite yielded a weak, radical-typesignal in the g = 2.0 region (not shown). The signal is transi- ent, and may have originated from a semiquinone form gener- ated from FAD.
The fully reduced AdoPS0, wductase. The fully reduced state can only be obtained after an extensive reduction (> 15 min) with sodium dithionite (pH 9.0). The EPR spec- trum of the fully reduced state was complex (Fig. 3G) and reminiscent of systems containing interacting iron-sulfur centers [24]. As seen below, the Mossbauer spectroscopic stud- ies provided strong evidence for the existence of a second [4Fe- 4S] center (center 11) in magnetic interaction with center I. In order to determine whether the appearance of this complex signal was due to a complex formed by the enzyme, with products resulting from the oxidation of dithionite such as sulfite (a natural substrate for AdoPSO, reductase), sulfite was added to the samples reduced with methylviologen but only center I was reduced.
Integrations of the fully reduced spectrum indicated 1.5 -
1.7 spin/8 Fe. As described below (in EPR redox titrations), center 11 is not fully reduced even at the lowest potential achieved in the redox titration. It was necessary to buffer the enzyme solution at pH 9.0 to obtain approximately 90%
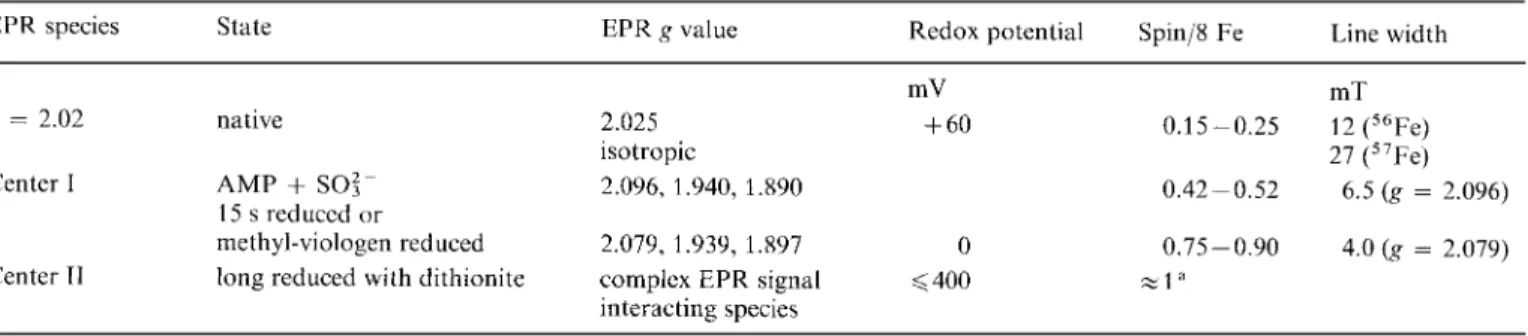
reduction (Mossbauer section). Table 1 is a comparison of data from the different EPR-active species observed.
In addition to the EPR signals detected in theg = 2 region, other signals of weaker intensities were also observed when the samples were scanned in a large magnetic field range.
Tablc 1. Comparison of the spectroscopic and redox data obtuined on the EPR-active species ohserved in D. gigas AdoP04 reductuse Line width
EPR species State EPR g value Redox potential Spin/X Fe
mV mT
g = 2.02 native 2.025
+
60 0.15-0.25 12 ("Fe)27 ("Fe) isotropic
Center I AMP
+
SO:- 2.096, 1.940, 1.890 0.42-0.52 6.5 ( g = 2.096)methyl-viologen reduced 2.079, 1.939, 1.897 0 0.75-0.90 4.0 ( g = 2.079) 15 s reduccd or
Center TI long reduced with dithionite complcx EPR signal
<
400 -1" interacting speciesa Under the conditions in which centers I and I1 are reduced, the EPR spcctrum accounts for up to 1.79 spin/8 Fc atoms. Mossbauer
studies of the same sample indicate 90% overall reduction
Native samples as well as AMP or sulfite-reacted samples showed minor contributions in the g = 4.3 region, mainly
due to the occurrence of high-spin iron (111) (Fig. 4A and B). However, the AMP/sulfite-reacted sample showed a promi- nent feature at g z 3.0 (Fig. 4C), and further reduced samples developed a new rhombic signal with g values at 4.425 and 4.063 (Fig. 4 D), more intense in the dithionite-reacted samples than in the methyl-viologen-reduced sample.
The temperature dependence of the EPR spectra was deter- mined using the samples containing reduced centers (not shown). The EPR signal due to reduced center I, generated with AMPjsulfite, showed a temperature-dependent line broadening at temperatures higher than 8 K which disap- peared around 30 K. In the partially reduced AdoPSO, re- ductase sample, the reduced-center-I signal could be observed at temperatures up to 45 K. In the so-called fully reduced state, the complex features of the EPR spectrum simplified at z 25 K and the simplified signal, due to center 1, remained observable up to 40 K. The anomalous temperature-depen- dent behavior of center I in the AMPisulfite-reacted sample suggested that interaction with the substrate drastically modi- fied its relaxation properties.
Power-dependence experiments were also carried out in the samples containing reduced centers I and 11. The EPR signals of the AMP-sulfite and the partially reduced samples are easier to saturate with microwave power than those of the fully reduced samples (Fig. 5).
EPR redox titrations
In order to estimate the midpoint redox potentials involved and to determine the effect of different reducing agents, redox titrations in the presence of dye mediators were carried out with different reductants, namely, dithionite, Zn-reduced methyl viologen and H2/hydrogenase-reduced methyl viologen. The results indicated that the redox process was independent of the reductants employed. Also, redox ti- trations carried out in our laboratory with AdoPS04 re- ductases isolated from different species of Desulfovibrio indi- cated that the enzymes are highly conserved in their active site composition and midpoint redox potential values (the comparison of AdoPSO, reductases from several Desuljo- vibrio species will be the subject of another publication. The midpoint redox potential, of the non-heme iron center respon- sible for the g = 2.02 EPR signal, was determined to be around f 6 0 mV. The value of the midpoint redox potential of center I is very positive, which is unusual for [4Fe-4S] clusters. Using different reductants, this value was determined
A 4 3 2 0 2 5 I 3 0 I h C 4 425 I 4 063 410 00 cl.000 M a g n e t i c F i e l d [ m i l
Fig. 4. X-band EPR spectra of D. gigas AdoPSOl reductuse (large scan width) in native and reacted samples. Experimental conditions as described for Fig. 3. Details are given in the g = 4 region. A , Native enzyme; B(i), sulfite-reacted; H(ii), the full spectrum indicating the relative EPR signal intensities. All the other spectra are incrcased by a factor of four; C, sulfite/AMP-reacted; D, dithionite-reduced (30 min)
The midpoint redox potential of center I1 of AdoPS04 reductase from
D.
gigas could only be estimated to be lower than -400 mV, since a fully reduced sample could not be prepared (see Mossbauer section). However, the redox poten- tial of center I1 from the AdoPS04 reductases isolated from D. desulfuricans (Berre eau) and Desulfbvibrio salexigens could be estimated to be around -450 mV (our unpublished re-sults). Preliminarv redox titrations monitored by visible spec- to be % 0 mV-(Fig. 6).
- 3 - 2 -1 0 1 2 3
log P (mW)
Fig. 5. Microwave power saturation curvesfor the E P R signals offully reduced (dithionitr-reacted) ( O ) , partially reduced with dithionite ( O ) , and AMP/sulfite-reacted (A) D. gigas AdoPS04 reductuse. The data were obtained at 8 K and were fitted using an equation of the form S = pl’Z/(l
+
P / P s o b’Z) where S is the relative signal intensity[38]. P5o ( 0 ) 65 PW; Pso (0) 58 WW; P5o (A) 56 PW
-250 -150 -50 0 50 150 250
R e d o x potential (mV)
Fig. 6. E P R redox titrutions of D. gigas AdoPS04 reductase. Exper- imental details are described under Materials and Methods. The EPR measurements were made at 8 K. Intensity measurements were made at g = 2.02 (isotropic signal; (0) and g = 2.079 (0). g = 1.939 ( A ) and g = 1.897 (0 ; center I). Different chemical reductants were used: zinc-reduced methyl viologen (A) and dithionite (B)
troscopy (not shown) indicate a major absorption decrease at very positive redox potential values (Eo z
+
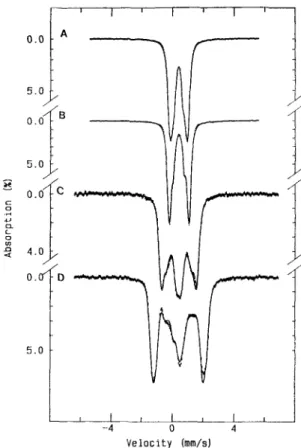
3 60 mV) attri- buted to the flavin contribution.0.0 - A 5.0 5.0 I I I I I I L -4 0 4 V e l o c i t y (rnm/s)
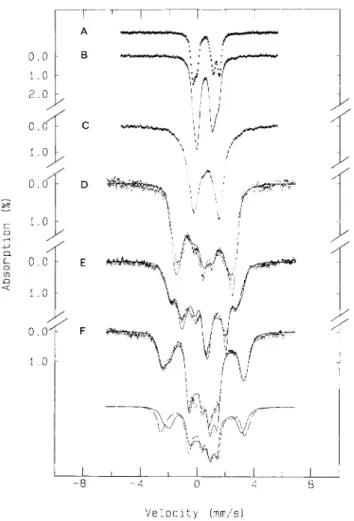
Fig. 7. Miisshauer spectra of nutive D. gigas AdoPS04 reductuse. The data were recorded at 100 K (A) and 4.2 K (B- D), in zero magnetic ficlds (A) and with parallel applied fields of 50 mT (B), 4.0 T (C) and 8.0 T (D). The solids lines in A and B are the result of a least-squares fitting with four doublets of equal intensity (see Table 2); the solid lines in C and D are the result of a simulation for diamagnetic species, using the values of Table 2
Mossbauer results
The native protein. Fig. 7 shows the Mossbauer spectra of the AdoPS04 reductase purified from
D.
gigas, recorded at100 K in the absence of a magnetic field (Fig. 7A), and at
4.2 K with magnetic fields of 50 mT (Fig. 7B), 4 T (Fig. 7C)
and 8 T (Fig. 7D) applied parallel to the y-beam. The low- temperature, weak-field spectrum is a broad quadrupole doublet with an apparent quadrupole splitting (AEQ) of 1.3 mmjs and an isomer shift (6) of 0.45 mmjs. Shoulders were observed at the inner part of the spectrum. The strong-field spectra showed magnetic splitting caused by effective fields equivalent to the applied fields, indicating that the iron atoms were in a diamagnetic environment. At higher temperatures, the values of dEQ are reduced (e.g. at 100 K the AEQ reduces
to 1.3 5 mmjs). The 4.2 K weak-field spectrum and the high-
temperatures, zero-field spectra were least-squares fitted with four quadrupole doublets of equal intensity and line width. The results are listed in Table 2. The temperature dependence and the values obtained for the parameters are very similar to those reported for a [4Fe-4SlZf [25] or a [6Fe-6SI3+ cluster 1261.
The parameters obtained from the least-squares fitting of the 4.2 K weak-field spectrum were used to simulate the strong-field spectra assuming diamagnetism for the iron sites. The solid lines in Fig. 7 C and D are the theoretical simulations which agree very well with the experimental data, indicating that the iron sites in the native AdoPS04 are indeed diamag- netic. These Mossbauer spectroscopic properties (i. e, the ob-
Table 2. Mijsshuuer purumeters of native D. gigas AdoPS04 reductuse
r
the line width; = ( V x x - VJ,&VZz6
r
rl Tempera- Dou- A E Q ture blet K mmjs 150 1 1.22 f 0.02 0.40 f 0.05 0.28 3 0.79 i 0.02 0.40 f 0.05 0.28 4 0.50 0.02 0.39 k 0.05 0.28 100 1 1.28 k 0.02 0.42 k 0.05 0.25 3 0.88 k 0.02 0.43 k 0.05 0.25 4 0.55 0.02 0.41 k 0.05 0.25 4.2 1 1.44 f 0.02 0.45 k 0.05 0.25 0.7 2 1.30 f 0.02 0.45 & 0.05 0.25 0.9 3 1.12 k 0.02 0.45 f 0.05 0.25 0.9 4 0.71 k 0.02 0.43 f 0.05 0.28 0.9 2 0.98 f 0.02 0.40 f 0.05 0.28 - 2 1.11 f 0.02 0.43 f 0.05 0.25 -served values of the parameters, the reduction of AEQ with increasing temperature, the diamagnetism and the overall pattern of the spectra) are all characteristic of a [4Fe-4S12+ cluster, demonstrating that the iron atoms in
D.
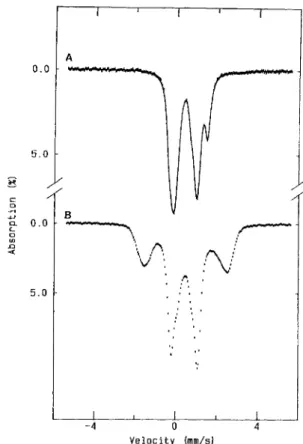
gigas AdoPSO, reductase are organized in the form of [4Fe-4S] clusters. Although the Mossbauer parameters (AE, and 8 ) are also similar to those of a [6Fe-6SI3+ cluster [26], the observed diamagnetism definitely excludes the presence of this cluster in AdoPSO, reductase since the [6Fe-6SI3+ center is paramag- netic (S = lj2).The partially reduced AdoPS04 reductase. The low-tem- perature (4.2 K) Mossbauer spectrum of a methyl-viologen- reduced sample (Fig. 8 B) clearly displays two subspectral components: a central doublet very similar to that of the native protein and a magnetic subspectrum extending from - 1.5 mmjs to
+
2.5 mmjs. Strong-field spectra further indi- cated that the central doublet originates from a diamagnetic species. Since only one EPR signal was observed for methyl- viologen-reduced AdoPS04 reductase (see EPR results), the magnetic component is inevitably attributed to the reduced Fe-S center I. At high temperatures (e.g. 100 K), the electronic relaxation of a Fe-S center is generally fast in comparison with the 57Fe nuclear precession and the high-temperature Mossbauer spectra (Fig. 8A) show only quadrupole doublets. In addition to the central doublet, which is similar to that of the native protein, an absorption peak and a shoulder were observed at 1.5 mmjs and -0.5 mm/s, respectively, which must have arisen from the reduced Fe-S center I. In order to estimate the relative percentage absorbance for the two subspectral components, the following data manoeuver was performed. The diamagnetic component was approximated by the spectrum of the native enzyme and its percentage ab- sorbance was roughly estimated from the low-temperature weak-field spectrum. The percentage thus obtained was used to remove the diamagnetic component from the high-tempera- ture spectrum, and the resulting spectrum showed two well- resolved quadrupole doublets (Fig. 9 A), indicating that there are two non-equivalent iron sites for the reduced Fe-S center I. This result was not surprising since [4Fe-4S]+ clusters gener- ally exhibited two non-equivalent pairs of iron sites [27]. We then refined our estimate by removing variable amounts of the diamagnetic components from the high-temperature spectra and least-squares fitted the resulting spectra. The cor- rect percentage was judged to be the one which yielded a0.0 5.0
-
-
N , C ‘ 0 4J .n n 0.0 n 0 w 4 5.0 I I Ir-
A I I I I I - 4 0 4 V e l o c i t y (mm/slFig. 8. Mcssbuuer spectra o j methyl-vialogen-reduced D. gigas AdoPS04 reductase. (A) Spectrum at 100 K in zero applied magnetic field. The solid line is the result of a least-squares fitting (see Tables 2 and 3). (B) Spectrum at 4.2 K recorded in the presence of a parallel applied field of SO mT
spectrum consisting of two equal-intensity doublets. The final results were 48
i-
2 % absorbance for the diamagnetic component, and 52 & 2% for the magnetic component, in-dicating that the methyl-viologen-reduced AdoPS04 re- ductase contained one oxidized diamagnetic cluster, and one reduced magnetic cluster, a finding that is in good agreement with the EPR data. From the above analysis, we realized that the spectra of the oxidized Fe-S center 11 could be approxi- mated by those of the native enzyme. The spectra of the reduced Fe-S center I, therefore, could be prepared from the raw data of the partially reduced enzyme by removing the contributions of the Fe-S center I1 using the spectra of the native protein recorded under the same experimental con- ditions. Fig. 9 shows some of the prepared spectra for the reduced Fe-S center I. The high-temperature data (Fig. 9A), were least-squares fitted with two quadrupole doublets. The results are listed in Table 3. At low temperatures (e. g. 4.2 K), two resolved magnetic spectral components, corresponding to the two non-equivalent iron sites, are clearly observable. The overall magnetic splitting of one of the components is seen to increase with the applied field, while the splitting of the other decreases, a phenomenon that is commonly observed for iron sites in a spin-coupled cluster. These low-temperature spectra were analyzed in detail with the following S = 112 spin Hamiltonian :
r
7
I-' 0.01
I
0 . f 1.0Ir,
d 1;-1
iLLLLI
-8 -4 0 4 8 ' J e l o c i t y (rrm/s)Fig. 9. Prepared Mossbauer spectra qf methyl-viologen-reduced D. gigas AdoPS04 reductase, obtained by subtraction of48% @'the corre- sponding nutive spectra. Temperature: 100 K and 4.2 K (B-E). The data at 4.2 K were recorded in the presence of applied magnetic fields, parallel (B, D, E) and transverse (C) to the gamma radiation, of 50 mT (B, C) 4.0 T (D) and 8.0 T (E). The solid line in A is the result of a least squares fitting, with two doublets of equal intensities. The solid lines in B- E are theoretical simulations using the parameters in Table 3. The two components are shown separately for the R.0 T spectrum: component 1 (- - - -) and component 2 (--)
Both non-equivalent iron sites were assumed to share the same tensor of the coupled center, as measured by EPF, but have different magnetic hyperfin: coupling tensors, A , and electrical field gradient tensors, V. The set of hyperfine par- ameters, which yields theoretical spectra (solid lines in Fig. 9) which best resemble the experiments, is listed in Table 3. In general, the theoretical simulations agree very well with the experimental spectra, except at the central region where a large percentage of the absorbance has been removed from the raw data. This slight discrepancy may reflect the imperfec- tion of our attempt to approximate the contribution of the oxidized Fe-S center I1 by the spectra of the native protein.
From the above analysis, we have demonstrated that the reduced Fe-S center I exhibits spectroscopic properties typical of a [4Fe-4S]+ cluster. The cluster consists of two non- equivalent iron sites and each site represents two iron atoms. One site has a positive internal field at the_ Fe nucleus and is ferrous-like (large AEQ and anisotropic A tensor) while the other site has negative internal field a_nd is more ferric-like (smaller AE, and relatively isotropic A tensor). Overall, the parameters obtained for the reduced Fe-S center I resemble those of a regular [4Fe-4S] + cluster, but specifically, the values
of the AEQ and 6 of the ferrous-like iron site are unusually large in comparison with the corresponding values found for other [4Fe-4S]+ clusters. The reported ranges of values for the AEQ and 6 of the ferrous-like iron site in [4Fe-4SIC clusters are 1.5- 1.9 mmjs and 0.53-0.58 mmjs, respectively [25,
27 - 301. Since the midpoint redox potential of this Fe-S center
1 is approximately 350 mV more positive than that of a regular ferredoxin-like [4Fe-4S] cluster, and substitution of a ligand other than sulfur is known to affect the redox potential of Fe-S clusters [31, 321, it is tempting to speculate that this Fe-S center I may have atom(s) other than sulfur as its ligand(s) and that this difference in the ligand environment is reflected in the observed large A E, and 6 for the ferrous-like iron site in the reduced center I .
The A MP/sulfi'le-reactedsamples. For the Mossbauer mea- surements, a sample of the 57Fe-enriched D. gigas enzyme was prepared by incubation with AMP and sulfite for 15 min. The low-temperature (4.2 K) spectra of this sample, obtained in various strenghts of applied magnetic fields (not shown), revealed the presence of two spectral components: one, dia-
Table 3. Mossbauer parameters of reduced D. gigas AdoPS04 reductase
Center I was measured in the methyl-viologen-reduced sample and center I1 in the fully reduced sample.
r ,
the line width; q , ( V x x - V,,,)/VZzCenter Tempera- Site AEQ 6
ture K mmjs T - I 150 1 1.69 f 0.04 0.56 f 0.04 0.31 2 1.04 f 0.04 0.47 f 0.04 0.29 100 1 1.90 0.04 0.59 k 0.04 0.31 2 1 . 1 8 5 0 . 0 4 0.51 f 0.04 0.36 70 1 2.00 f 0.04 0.60 k 0.04 0.34 2 1.26 f 0.04 0.51 & 0.04 0.43 - - 4.2 1 2.20 & 0.04 0.63 f 0.04 0.40 0.7 18.0 f 1.0 12.5 f 1.0 35.0 f 1.0 2 1.30 f 0.04 0.54 & 0.04 0.35 0.7 -24.0 & 1.0 -23.5
+
2.0 -19.0 f 1.0 - - I1 130 1 1.33 i 0.04 0.53 0.04 0.35 2 0.79 f 0.04 0.50 0.04 0.35 100 1 1.35 k 0.04 0.57 f 0.04 0.36 2 0.85 f 0.04 0.50 0.04 0.36 - - 55.0 I 1.0 60.0 k I .0 4.2 1 1.50 k 0.04 0.60 _+ 0.04 0.35 0.5 18.0*
1 .0 2 1.1OfO.04 0.55 f 0.04 0.35 0.5 -21.5 5 1.0 -25.0 f 1.0 -20.0 f 1.00 . 0
1.0 2 . 0 3 . 0I
I
- - - - I 1 I,
I -4 0 4' i ' e l o c i t y
(rnT,'s)Fig. 30. Mossbauer spectra of D. gigas AdoPS04 reductase recorded at 100 K in the absence of an external magnetic field. (A) Spectrum of a AMP/sulfite-reacted sample. (B) Prepared spectra of center I in the methyl-viologen-reduced sample, scaled to 40% of spectrum A
magnetic, similar to the native protein spectrum, and another, paramagnetic and resembling the spectrum of the methyl- viologen-reduced center I. The contribution of the paramag- netic component was estimated to be about 40% of the total Fe absorption, indicating that approximately 80% of center I
was reduced in the AMPjsulfite-reacted sample. Fig. 10 shows the 100 K Mossbauer spectrum of the AMPjsulfite-reacted sample. When this spectrum is compared with that of the methyl-viologen-reduced enzyme (Fig. 8 A), it becomes obvi- ous that the quadrupole splitting of the ferrous-like iron site of the reduced center I has been decreased. For comparison, the prepared spectrum of the methyl-viologen-reduced center
I (Fig. 9A), normalized to 40% of the total Fe absorption, is also plotted in Fig. 10. A least-squares fitting of the 100 K
spectrum of the AMPjsulfite-reacted sample yielded a dEQ value of 1.75 0.04 mmjs for the ferrous-like iron site, ap- proximately 0.15 mmjs smaller than the value of 1.90 mmjs obtained for that of the methyl-viologen-reduced center I.
Consequently, both EPR and Mossbauer measurements indi- cated that the addition of AMP and sulfite induces a reduced center I that is spectroscopically distinguishable from the same center reduced by chemicals, such as methyl-viologen or dithionite.
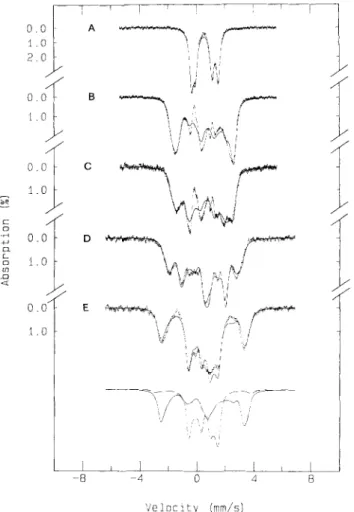
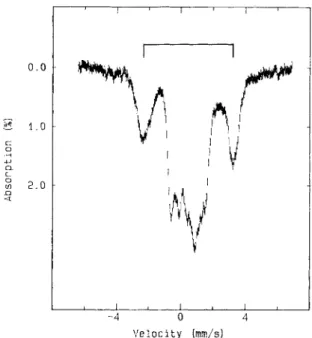
The fully reduced AdoPS04 reductase. Fig. 11 shows the Mossbauer spectrum of the fully reduced AdoPS04 reductase recorded at 4.2 K in a parallel field of 8 T. The spectral component of the ferrous-like iron site of the reduced [4Fe- 4S] clusters (indicated by the bracket) is well resolved from the rest of the spectrum and provides an accurate measure of the degree of reduction. It was found that 92 f 3% of the total iron absorbance originated from reduced Fe-S clusters. In other words, approximately 85% of the Fe-S center I1 in the fully reduced sample are in the [4Fe-4S]+ state. (Center I is assumed to be completely reduced in this sample.) To study the reduced center 11 in further detail, the 8% contribution of the oxidized cluster was removed from the raw data, and the resulting spectra are shown in Fig. 12. Again, the spectra of the native enzyme were used to approximate those of the oxidized cluster. Two interesting observations can be made from the spectra shown in Fig. 12. First, the two reduced Fe-S centers are weakly spin-coupled. Even though the reduced centers are magnetic, at 4.2 K and in the absence of a magnetic field, they exhibit spectra of a quadrupole-splitting nature, indicating spin-spin interaction between the two centers
0 . 0
-
ae
1 . 0 L 0 .?. I J L n::
2.0 n Q I I II
'
Ii y
I I I -4 0 3 V e l o c i t y (mrn/s)Fig. 11. Mri'ssbauer spectrum of the,fully reduced D. gigas AdoPS04 reductase prepared by subtraction of 8% of the native spectrum. The spectrum was recorded at 4.2 K in the presence of a parallel applied field of 8.0 T
(Fig. 12C). This spin-spin interaction, however, is relatively weak since the interaction is readily broken by an applied field of 1.0 T resulting in magnetic spectrum (Fig. 12D). A similar type of spin-spin interaction has also been observed for the two [4Fe-4S] + clusters in Clostridium pasteurianum 8Fe ferredoxin
[29]. Second, the reduced Fe-S center 11 is spectroscopically
distinguishable from the reduced Fe-S center I. When the high-temperature spectrum of the fully reduced enzyme (Fig. 12B) is compared with the corresponding spectrum of the reduced Fe-S center I (Fig. 9A), it becomes apparent that the ferrous-like iron site of the reduced Fe-S center I1 exhibits a quadrupole splitting significantly smaller than that of the ferrous-like iron site in the reduced Fe-S center I. (For com- parison, the spectrum shown in Fig. 9 A is plotted on top of Fig. 12B). The difference between the two reduced Fe-S centers in AdoPS04 reductase can also be seen in the strong-
! O O O - I 1.0 O ’ O T 1 0 I I I
,
I I I I -8 - 4 0-
V e l o c i t y (mrn/s)Fig. 12. Mtjssbauer spectra of fully reduced D. gigas AdoPS04 re- ductase. (B - F) Spectra prepared by subtraction of 8 % of the corre- sponding native spectra. (A) Prepared spectrum of center I in the methyl-viologen-reduced sample. Temperature: 100 K (A, B) and 4.2 K (C-F). A - C were recorded in the absence of an external magnetic field. D -F were recorded with parallel applied magnetic fields of 1 .O T (D), 4.0 T (E) and 8.0 T (F). The solid line in spectrum B is the result of a least-squares fitting, assuming four doublets of approximately the same intensity. The solid lines in D-F are the result of spectral simulation of the components of centers I and I1 using the parameters in Table 3. The simulated 8-T spectra of center I (dashed line) and center I1 (solid line) are shown below the exper- imental spectra
field spectra. The difference is subtle but, nonetheless, detect- able. The overall splitting of the spectrum of the reduced Fe-
S center I (Fig. 9E) is larger than that of the spectrum shown in Fig. 1 2 F which contains contributions from both reduced centers.
To analyze the data shown in Fig. 12 in further detail, we assumed that 54% of the absorptions originate from Fe-S center 1 and 46% from center 11. Similar to the reduced center
I, two non-equivalent pairs of equivalent iron atoms were assumed for the reduced center 11. The high-temperature spec- trum (Fig. 12B) was least-squares fitted with four quadrupole doublets (two doublets for each center). Two of the doublets had parameters similar to those of center I and the other two were attributed to center
TI.
The solid line in Fig. 32B is the result of the least-squares fit and parameters obtained are listed in Table 3. To analyze the low-temperature strong-field spectra, we first removed the contributions of center 1 using the spectra discussed in the previous section and simulated the resulting spectra with the spin Hamiltonian of Eqn (1). Theresults are listed in Table 3. Due to limited resolution between the spectra of the two reduced centers, the parameters obtained were reported with large estimated uncertainties.
General discussion
The present study of D. gigas AdoPS04 reductase is the first detailed structural analysis of the iron-sulfur centers of the enzyme, and of the use of the substrates (AMP, sulfite and AdoPS04, and reducing agents) in order to detect possible relevant intermediates. In this paper, we have presented exten- sive spectroscopic data which demonstrate that D . gigas AdoPS0, reductase contains 1 flavin/8 iron atoms, and that the iron atoms are arranged as two [4Fe-4S] clusters, as shown by EPR and Mossbauer measurements.
The Fe-S center I is clearly a [4Fe-4S] cluster. It is EPR- silent in the oxidized reductase but is EPR-active in its reduced form and exhibits resonances at g values of 2.079, 1.939 and 1.897. Mossbauer spectroscopy revealed that the reduced Fe-S center I contains two non-equivalent iron sites (each represent- ing two iron atoms): one ferrous-like and one ferric-like. The ferrous-like site shows unusually large d E Q and 6 values, suggesting a different structural arrangement around this center. This appears also to be the case with Desulfovibrio ufl-icanus ferredoxin 111 which contains only seven cysteine residues, a [4Fe-4S] cluster and a [3Fe-4S] cluster. The trinuclear center can readily be converted into a [4Fe-4S] center, which exhibits very unusual magnetic properties, in- dicating the existence of a non-cysteinyl ligand, probably a carboxylate 1331. Center I of AdoPS04 reductase has a rather positive midpoint redox potential (= 0 mV) and to our knowl- edge, similar values have only been indicated for [4Fe-4S] clusters present in D . vulgaris Fe hydrogenase [34] and trimethylamine dehydrogenase (Stankovich, M. T., personal communication). Center I1 was identified as a typical [4Fe- 4S] center as described by its Mossbauer parameters and midpoint redox potential value. EPR and Mossbauer data clearly indicate that this center is weakly spin-coupled to center I in its reduced state.
The spectral changes induced in the visible electronic spectra upon addition of sulfite (bleaching of the flavin ab- sorbance and increase of absorbance around 320 nm) indicate the formation of an adduct with the enzyme-bound flavin as observed for other flavoproteins, such as glucose oxidase, D- or L-amino-acid oxidases, oxynitrilase, lactate oxidase, glycol- ate oxidase and D. vulgaris AdoPSO, reductase [lo, 20, 231. The reduced FAD is produced from the sulfite adduct in the presence of AMP with the concomitant formation of AdoPSO,. The amount of semiquinone in an EPR-detectable form observed under different conditions is very weak or undetectable. This is not the case with AdoPSO, reductase from Tlziobacillus thioparus where a red semiquinone is obtained [35], but may be due to inactive enzyme.
The properties of AMP/sulfite-reduced state were very informative. Under these conditions, the EPR signals of re- duced center I developed partially, with notable alterations of relaxation behavior, as well as line width and g values when compared with the dithionite partially reduced state. Mossbauer analysis of the AMP/sulfite-reduced state also revealed spectral alterations in comparison with the spectrum of chemically reduced center I. These observations suggest a selective interaction between center I and AMP that may be envisaged as a necessary step in order to facilitate the release of the sulfite adduct, in the form of the AdoPS04 compound. Also, the relative proximity of redox potential values of center
I and the FAD may indicate a fine tuning to facilitate intra- molecular electron transfer between these two centers. In ad- dition to the dominant spectral features described, weak EPR signals observed in the AMP/sulfite-reacted and reduced- dithionite-reacted samples represent new spectroscopic fea- tures. These signals are reminiscent of EPR signals observed by Stevenson et al. [36] in trimethylamine dehydrogenase, an iron-sulfur-flavin-containing protein. In this case, the two- electron-reduced enzyme was shown to produce EPR signals at around g = 2 and g = 4 and these signals were assigned to a spin-spin interaction between the FMN group and the iron-sulfur center of the enzyme. Alternatively, these observed signals may be due to the higher spin states of reduced [4Fe- 4S] clusters, arising from conformational alterations as seen in Azotohacter vinelundii nitrogenase [30, 371. The origin of the EPR signals observed in
D.
gigas AdoPSO, reductase in the g = 4 region is not yet understood, but the conditions necessary for maximal development of these signals, as well as of the z 3.0 signal observed in the AMP/sulfite-reduced sample, are under study.The center associated with the g = 2.02 signal has charac- teristics resembling a [3Fe-4S] center. No metal besides iron was detected by plasma emission analysis and the 57Fe EPR spectrum showed conclusively its origin from iron. Its low EPR spin measurements and the fact that it is not detected by Mossbauer spectroscopy suggest that the [3Fe-4S] center may be an artifact due to sample manipulation.
AdoPSO, reductase is an interesting example of an iron- sulfur-containing flavoprotein where both flavin and one Fe-S center (center 1) are directly perturbed by the action of reac- tants. The role of the other Fe-S center (center 11) is still not fully clarified.
We thank the staff of the University of Georgia Fermentation Plant for growing the bacterial cells, Dr Adrian Maghcr for prelimi- nary analysis of the Mossbauer data, D r Daulat Patil for helping with redox titrations, Dr Guy Fauque for helpful discussion, Dr Bruce MacNamara for writing the programs to plot the EPR data, and Paulo Fialho and Fernando Matos for helping in interfacing the EPR spectrometer with an IBM-AT. This work was supported by Junta Nacional de InvestigaGCo Cientifica e Technolbgica and Instituto
Nacional de InvestigaCZo Cientifca (J. J. G. M.), National Science Foundation (DMB 8614290) (J. L.), the National Institute of Health (GM 032187 and D K 01 135) (B. H. H.) and under contract DEA 504- 79 ER 10499 from U . S. Department of Energy (H. D. P.).
REFERENCES
I . Postgate, J. R. (1984) in The sulphate-reducing bacteria, (2nd edn), 2. Akagi, J. M . & Campbell, L. L. (1962) J . Bacteriol B84, 1194- 3. Bramlett, R. N . & Peck, H. D. Jr (1975) J . B i d . Chem. 250, 4. Lee, J. P., LeGall, J. & Peck, H. D. Jr (1973) J . Bacleriol 115,
529 - 542.
5. Kremer, D. R., Veenhuis, M., Fauque, G., Peck, H. D. Jr., LeGall, J., Lampreia, J., Moura, J. J. G. & Hansen, T. A. (1988) Arch. Microbiol. 150, 296-301.
6. Triiper, H. G. & Fisher, V. (1982) Philos. Trans. R. Soc. Lond. B Biol. Sci. 298, 529 - 542.
7. Peck, H. D. Jr. & LeGall, J. (1982) Philos. Trans. R. Soc. Lond. B B i d . Sci. 298, 443 - 466.
Cambridge University Press, Cambridge. 1201.
2979 - 2986.
8. Muller, F. & Massey, V. (1969) J . B i d Chem. 244, 4007-4016. 9. Swoboda, B. E. P. & Massey, V. (1966) J . Biol. Chem. 241, 3409. 10. Massey, V., Muller, F., Feldberg, R., Schuman, M., Sullivan, P. A., Howell, L. G., Mayhew. S. G., Mathews, R. G . & Foust, G. P. (1969) J . Biol. Chem. 244, 3999-4006.
11. Stille, W. & Truper, 1%. G . (1984) Arch. Microbiol. 137, 145- 150. 12. Speich, N. &Triiper, H. G. (1988) J . Gen. Microbiol. 134, 1419-
13. Ishimoto, M. & Fujimolo, D. (1961) J . Biachem. (Tokyo) SO, 14. LeGall, J., Mazza, G. & Dragoni, N . (1965) Biochim. Biophvs. IS. Lowry, 0. H., Rosebrough, N . J., Fan, A. L. & Randall, R. J. 16. Aasa, R. & Vangard, T. (1975) J . Magn. Reson. 13, 548-560. 17. Dutton, P. L. (1971) Biochim. Biophys. Acta 226, 63-80. 18. Moura, I., Xavier, A. V., Cammack, R., Bruschi, M. & LeGall,
J. (1978) Biochim. Biophys. Acta 533, 156- 162.
19. Michaelis, G . B., Davidson, J. T. & Peck, H. D. Jr (1 970) Biochem. Biophys. Res. Commun. 39, 321 - 328.
20. Michaelis, G. B., Davidson, J. T. &Peck, H. D. Jr (1970) in Third
international symposium on ,/Zavins and ,flawproteins (Kamin, N., ed.) pp. 555 - 560, University Park Press, Baltimore. 21. Peck, II. D. Jr & Bramlett, R. N. (1982) in Seventh international
symposium onJluvins undflavoproteins (Massey, V. & Williams, G., eds) pp. 551 - 558, University Park Press, Tokyo. 22. Huynh, B. H., Moura, J. J. G., Moura, I., Kent, T. A . , LeGall,
J., Xavier, A. V. & Miinck, E. (1980) J . B i d . Chem. 255,3242- 3244.
23. Bramlett, R. N. (1975) PhD. Thesis, University of Georgia, Athens, USA.
24. Cammack, R., Dickinson, D. 1'. E. & Johnson, C. E. (1977) in Iron-sulfurproteins, (Lorenberg, W., ed.) vol. 3, pp. 283 - 330, Academic Press, New York.
25. Debrunner, P. G., Munck, E., Que, L. & Schulz, C. E. (1977) in Iron-sulfur proteins (Lovenberg, W., ed.) vol. 3, pp. 381 -417, Academic Press. New York.
26. Kanatzidis, M. G., Hagcn, W. R., Dunham, W. R., Lcster, R . K. & Coucouvanis, D . (1985) J . A m . Chem. Soc. 107, 953- 961.
27. Middlcton, P., Dickson, D. P. E., Johnson, C. E. & Rush, J. D. (1978) Eur. J . Biochem. 88, 135-141.
28. Christner, J. A., Janick, P. A., Siegel, L. M. & Munck, E. (1983) J . B i d . Chem. 258, 11 157 - 11 164.
29. Moulis, J. M., Auric, P., Gaillard, J. & Meyer, J. (1984) J . Biol. Chem. 259, 11396-11402.
30. Lindahl, P. A,, Day, E. P., Kent, T. A,, Orme-Johnson, W. & Munck,E.(1985)J. Biol. Chem.260, 11160-11173.
31. Johnson, K. W. & Holm, R. H. (1978) J . Am. Chem. Soc. 100, 32. Tesler, J., Hoffman, B. H., LoBrutto, R., Ohnishi, T., Tsai, A.-
L., Simpkin, D. & Palmer, G. (1987) FEBS Lett. 214, 117- 1425. 299 - 304. Acta Y9, 385-387. (1951) J . B i d . Chem. 193, 265-275. 5338 - 5344. I L I .
33. Thomson, A. J., George, S. J., Armstrong, A. & Hatchikian, C. (1988) in Proceedings of the X I I I international conference on magnetic resonance in biological systems, Madison, Wisconsin, USA.
34. Patil, D., Mourd, J. J. G., He, S. H.. Teixeira, M., Pickrill, B. C., Dervartanian, D. V., Pcck, H. D. Jr., LeGall, J. & Huynh, €3.
H. (1988) J . B i d . Chcm. 263. 18732-18738.
35. Adachi, K. & Suzuki, I. (1977) Can. J . Biochem. 55, 91 -98. 36. Stevenson, R. C., Dunham, W. R., Sands, R. H., Singcr, T. P. &
Beinert, H. (1986) Biochim. Biophys. Acta 869, 81 -88. 37. Hagen, W. R., Wassink, H., Eady, R . R., Smith, B. E. & Haaker,
H. (1987) Eur. J . Biochem. 169,457-465.
38. Rupp, H., Rao, K. K., Hall, D. 0. & Cammack, R. (1978)