The impact of Sustainable
Packaging in the Purchase
Intent of consumers.
Rita Antunes Guerra
152117067
Dissertation written under the supervision of
Prof. Paulo Romeiro
Dissertation submitted in partial fulfilment of requirements for the MSc in
Management with Specialization in Strategic Marketing at the Universidade
ABSTRACT
Title: “The Impact of Sustainable Packaging in the Purchase Intent of Consumers.” Author: Rita Marçal Antunes Mafra Guerra
Key Words: Sustainable; Packaging; Purchase Intent; Consumers; Perceived Value;
Willingness to Pay
Nowadays the Sustainable Packaging theme is very trendy. The impact of the pollution, global warming and other circumstances led people to get more concerned about their habits and their effect on the planet. Regulations have increased and companies need to stay tuned and meet consumers’ expectations and wants.
The aim of this dissertation is to understand the impact of the Packaging Stimulus (Sustainable vs Normal packaging) on the Purchase Intent of the consumers. The conceptual model includes two mediators – Perceived Value and WTP - that may affect the dependent variable.
In depth interviews and an online survey were run, which allowed collecting both qualitative and quantitative data. 182 valid responses were gathered in the online survey. The results showed that the Packaging Stimulus does not have a direct significant impact on the Purchase Intent of consumers. The same happened that the overall model, with two mediators. However, if the model would be using only one mediator - WTP – there is a significant impact on the dependent variable. Moreover, Sustainable Packaging was defined as a package that can be reused and recycled. These conclusions have managerial impact, as the Sustainable Packaging theme is very relevant nowadays, and companies could use this information to make strategic decisions, such as whether to offer the consumer the option to buy a Sustainable option.
SUMÁRIO
Título: O impacto das embalangens sustentáveis na intenção de compra dos consumidores. Autor: Rita Marçal Antunes Mafra Guerra
Palavras-Chave: Sustentável; Embalagens; Intenção de compra; Consumidor; Valor
percpetível; predisposição de compra.
Hoje em dia o tema das embalagens sustentáveis é relevante. O impacto na poluição, no aquecimento global e noutros acontecimentos levou as pessoas a ficarem alerta em relação aos seus hábitos e os respectivos efeitos no planeta. A legislação das embalagens tem aumentado e as organizações precisam de prestar atenção e respeitar os desejos dos consumidores.
O objectivo desta tese é perceber o impacto das embalagens sustentáveis na intenção de compra dos consumidores. O modelo conceptual inclui dois mediadores – valor atribuído e predisposição para pagar – que podem afectar a variável dependente.
Foram feitas entrevistas e um questionário online, que levaram a tirar conclusões qualitativas e quantitativas. 182 respostas foram alcançadas no questionário. Os resultados mostram que o estímulo da embalagem (e a embalagem sustentável) não tem um efeito directo na intenção de compra. O mesmo acontece com o modelo geral, com dois mediadores. No entanto, se o modelo usar um mediador – predisposição de compra – há um impacto significativo na variável dependente. A embalagem sustentável foi definida como embalagens que podem ser reutilizadas e recicladas. Estas conclusões têm impacto na gestão das empresas dado que as embalagens sustentáveis são um tema muito relevante hoje em dia. Assim, as empresas poderiam usar esta informação para tomarem decisões estratégicas, como por exemplo se devem dar a opção das embalagens sustentáveis aos consumidores.
ACKNOWLEDGEMENTS
In the first place I would like to express my gratitude to my family and friends, who always supported and encouraged me to give my best. A special thank you to Ana Guerra and Rui Aguiar for being patient and positive during the whole dissertation process.
In the second place I would like to thank my dissertation advisor, Paulo Romeiro for sharing knowledge, discussing and encouraging producing a good master dissertation. Paulo’s support and advice were essential.
Finally I would like to express a big thank you to Ana Veloso for all the advice, support and availability. Ana’s help was extremely important to deliver the dissertation on time and with the necessary topics.
TABLE OF CONTENTS
ABSTRACT ... II SUMÁRIO ... III ACKNOWLEDGEMENTS ... IV TABLE OF CONTENTS ... V TABLE OF FIGURES ... VII TABLE OF TABLES ... VIII TABLE OF APPENDICES ... IX GLOSSARY ... X CHAPTER 1: INTRODUCTION ... 1 1.1 BACKGROUND ... 1 1.2 PROBLEM STATEMENT ... 2 1.3 RELEVANCE ... 3 1.4 RESEARCH METHODS ... 3 1.5 DISSERTATION OUTLINE ... 4
CHAPTER 2: LITERATURE REVIEW AND CONCEPTUAL FRAMEWORK ... 4
2.1 SUSTAINABLE PACKAGING ... 4 2.2 PURCHASE INTENT ... 6 2.3 PERCEIVED VALUE ... 7 2.4 WTP ... 9 CHAPTER 3: METHODOLOGY ... 10 3.1 RESEARCH APPROACH ... 10
3.2 PRIMARY DATA AND DATA COLLECTION ... 11
CHAPTER 4: RESULTS AND DISCUSSION ... 16
4.1 RESULTS ... 16
4.2 DISCUSSION ... 33
CHAPTER 5: CONCLUSIONS AND LIMITATIONS ... 35
5.1 MAIN FINDINGS & CONCLUSIONS ... 35
5.2 MANAGERIAL / ACADEMIC IMPLICATIONS ... 37
REFERENCE LIST ... I APPENDICES ... VII
TABLE OF FIGURES
Figure 1: Conceptual Model……….page 10 Figure 2: Sustainable Packaging in the online survey………..page 12 Figure 3: Normal Packaging in the online survey………page 12 Figure 4: H1 Results………page 20 Figure 5: H2 Results………page 22 Figure 6: H3 Results………page 23 Figure 7: H4 Results………page 26 Figure 8: H5 Results………page 27 Figure 9: H6 Results………page 29 Figure 10: Process Results………..page 30 Figure 11: Better conceptual model………page 31
TABLE OF TABLES
Table 1: NEP Model Statements……….page 13 Table 2: Constructs……….page 15 Table 3: Cronbach’s Alpha before aggregation……….… page 18 Table 4: Cronbach’s Alpha after aggregation……… page 18 Table 5: Sustainable definition characteristics before Factor Analysis…….… page 32 Table 6: Sustainable definition characteristics after Factor Analysis………… page 33
TABLE OF APPENDICES
Appendix 1: In depth interviews……….page VII Appendix 2: Online Survey………page VII Appendix 3: Demographics results………..…page IX Appendix 4: Cronbach’ Alpha………page XII Appendix 5: Quantitative Analysis………...…page XVI H1……….….page XVI H2……….page XVII H3………..page XIX H4………page XX H5……….…...page XXIII H6………..…….page XXIV Appendix 6: Mediation Effect………..page XXVII Appendix 7: Factor Analysis………..………page XXIX
GLOSSARY WTP – Willingness to Pay NP – Normal Packaging SP – Sustainable Packaging RH – Research Hypothesis PI – Purchase Intent PV – Perceived Value
CHAPTER 1: INTRODUCTION 1.1 Background
Consumers care more and more about the environment and they want to actively participate towards a goal: keep it safe (Hartmann Group, 2017). Their behaviour has been changing to more environmental friendly choices, which includes actions such as choosing green brands and products, and accept new types of options like recycled goods (Mobley et al., 1995 and Tsen et al., 2006). So the new purchasing patterns created a new segment of consumers, the green consumers (do Paço & Raposo, 2009). In the 90’s, environmental concerns started to have a big role in society behaviour in general, but also in people purchasing decisions (Prothero, 1996; Menon et al., 1999). Nowadays the social pressure also has a position in this change (Alsmadi, 2008; Finisterra do Paço, A, et al., 2009). Sustainability is about whether the current generation is able to manage resources to guarantee that future generations have access to the same bundle of supplies and reserves that are available today (Kotler, 2011). The access to information has been increasing, which makes people more aware and more educated regarding this topic. Actually, some studies say that people who have higher education levels and easy access to information are expected to care more about the environment and act accordingly (do Paço & Raposo, 2009). Presently many countries have imposed laws and restrictions regarding the consumption of sustainable products (Essoussi & Linton, 2010). Due to global warming, natural disasters and all recent events, people are becoming more conscious of this issue. Human kind does not face only one challenge, but many environmental problems, such as the climate change, an increase of desertification, air and water pollution, lack of fresh water, or depletion of natural resources (Scott, Walter Georgio, 2005). Many companies are presently working on solutions to be part of this purpose, by producing sustainable products (Borin, Cerf, & Krishnan, 2010), and they must change their marketing strategies accordingly if they want to achieve sustainability (Kotler, 2011). Although consumers show concerns about the environment, their consumer behaviour sometimes does not match the initial attitudes (Essoussi & Linton, 2010). When going to a point of purchase the consumer is faced with a lot of options. So brands started to play more competitive, and one of the strategies used to convince consumers to buy one product is through packaging (Ranjbarian, 2009). The packaging has several characteristics and all of them positively contribute to the brand experience and the purchase decision (Hussain, Ibrahim, & Noreen, 2015). Procter & Gamble for example, has been investing in SP goods – “P&G’s 20 leadership brands including Always, Ariel, Dawn, Fairy, Febreze, Head & Shoulders, Pantene, Pampers, and Tide will enable and inspire responsible consumption
through packaging that is 100% recyclable or reusable, launching more sustainable innovations, and building trust through transparency and sharing our safety science.”
This thesis is covering the topic SP, which nowadays is a relevant theme.
1.2 Problem Statement
The main purpose of this dissertation is to comprehend how SP influences the PI of the consumer. This relationship is mediated by two variables, PV and WTP (WTP), which may impact the PI. In order to reach the objective of this study the following Research Questions were settled:
RQ1: What is Sustainable Packaging definition?
RQ2: What is the impact of Sustainable Packaging in the Purchase Intent of the consumer? RQ3: What is the Perceived Value of consumers about Sustainable Packaging?
RQ4: What is the influence of Perceived Value in the WTP of consumers? RQ5: What is the main driver of Purchase Intent among the three variables?
According to the literature and following the objective of this study the subsequent Hypothesis were framed:
H1: Sustainable Packaging will have a higher impact on Purchase Intent, than Non-Sustainable;
H2: Perceived Value will positively impact Purchase Intent of consumers;
H3: Sustainable Packaging will have a higher impact on Perceived Value, than Non-Sustainable;
H4: Perceived Value will positively impact WTP;
H5: Sustainable Packaging will create a higher WTP, than Non-Sustainable; H6: WTP positively affects Purchase Intent of consumers;
1.3 Relevance
This study aims to create value for both academic and managerial areas. Regarding the former, this is a topic that still has gaps in terms of research, especially regarding packaging. There are academic papers about sustainability and green products, but they are more related to the product ingredients. Packaging can be deeper investigated and defined in terms of sustainability, and how it may impact the consumer choice. In the managerial area this topic is crucial, as many companies are investing in as an instrument to achieve loyalty and competitive advantage in the market. So having information about how consumers react to a sustainable package product in terms of PI creates value to managers by helping them to make strategic decisions.
Thus the final conclusions will contain valuable information about how affects consumers’ intention and how PV and WTP may have an impact on the final PI.
1.4 Research methods
In order to have good and valuable responses to the Research Questions raised, detailed and rich information should be collected and analysed. Secondary data was important to have a strong theoretical background and base to further find valuable data and final conclusions. Primary data was gathered through two methods: five in depth interviews for qualitative data, and an online survey for both qualitative and quantitative data. In depth interviews were done before the online survey. The qualitative base was very helpful to build the online questionnaire, for example to choose the right questions, or the structure of the survey. In this method respondents talked freely about topic and it was possible to understand the reasoning and of each person. In depth interviews allowed to gather a group of characteristics that might define SP. This shows again that, besides the gaps of the literature, the concept SP is not clearly defined and it is not consistent. It also allowed clarifying incomplete answers. This method has some limitations, such as the potential misinterpretation of the results, the ambiguity from the interviewer and the results that are not representative of the population. To overcome some of these limitations it was used the online survey. This technique enables to capture a big amount of information, such as demographics, attitudes and decisions. It allows measuring the relationship between stimulus and actions. However sometimes respondents seek prestige which leads to bias responses. In the online survey in order to overcome this limitation the answers were all anonymous to make respondents feel more confortable and answer with sincerity. It may also happen that people are not aware of the topic and the answers are not accurate. As previously mentioned the subject of the dissertation
is SP that is a hot theme nowadays, and people get information about it all the time. So the limitation of uniformed responses bias may not have a big weight in the case of this study. In online questionnaires the researcher does not have any chance to clarify the answers. This weakness may lose relevance by choosing the right questions. Finally, online surveys do not represent the population. Given the scope of this dissertation this is clearly a limitation. 182 people filled in the questionnaire. The number of respondents was influenced by the timing restrictions. As an online survey, it was possible to get information of people from different countries. This method was useful to get quantitative data.
Using both qualitative and quantitative data brings more value to the research, as it allows making better and more informed conclusions and have a stronger interpretation of the results.
1.5 Dissertation outline
Following the Introduction this dissertation has the subsequent plan. The second section is the Literature Review where the concepts SP, PV, WTP and PI are defined and described. The third chapter is about the Methodology that explains how the research is answering the RH, it clarifies more in detail how secondary data was gathered, how it was used to build primary data, and finally how statistical tests were important to reach final conclusions. Results is the forth section and it is divided into two sub-sections: Results and Discussion. In the first one all the outcomes of the research are described, while in the second sub-section the results are interpreted to check if they respond to the main objective of this thesis. It is in this chapter where the validity of the RHs are tested. Finally the last section is Conclusions and Limitations, where final inference, restrictions and advices are identified.
CHAPTER 2: LITERATURE REVIEW AND CONCEPTUAL FRAMEWORK
This chapter will explain the theoretical base of this thesis that will help answering all Research Questions and validate each Hypothesis. It is divided in four paragraphs, one for each variable or mediator. So the first is about the independent variable Sustainable vs Normal, the second explains the dependent variable PI, and the third and forth are about PV and WTP respectively.
2.1 Sustainable Packaging
2.1.1 Packaging
as many times the customer do not think about the options available until the moment of the purchase (Silayoi & Speece, 2007). Actually, 73% of the consumer choices are made in the store (Connolly and Davidson, 1996). If a packaging of a product is able to attract the consumer in store, it will help him/her in the buying decision (Silayoi & Speece, 2007). The way packaging communicates depends on the consumer, as they evaluate and interpret packaging in different ways. In a package consumers can find visual elements and informational elements. Visual elements are the illustrations, size and shape. Informational elements consist on the product information and the material about the packaging technologies (Silayoi & Speece, 2007). It is considered a packaging attribute anything that is relevant to the consumer choice and at the same time can be manipulated by the brand (Murphy et al. 2000). The main attributes are: colour, graphics, shape, product information and image. Many companies do not know how strong is packaging as a marketing tool. It is a very cost effective strategy and it reaches many more consumers than normal advertising (Twedi, 1968). If a package message is high quality, the product will be perceived as so. The same works on the other way around, so the product will be perceived to have low quality if the package communicated that message (Underwood et al., 2001; Silayoi and Speece, 2004). It may happen that if the quality perception of the consumer is bad, even though the product actually has high quality, the customer will hesitate in the purchase decision (Parmar & Amin, 2014). Positive perceptions can be achieved by manipulating some characteristics (Silayoi & Speece, 2007). So overall the packaging of a product is the major mechanism for a brand to be competitive in the market (Parmar & Amin, 2014). Besides the marketing role, packaging also has a logistical position – protect the content (Silayoi & Speece, 2007). The thesis will focus more on the marketing role - the power that packaging has in the consumer choice. 2.1.2 Sustainable Packaging
In order to reach sustainability companies must change their Marketing Mix strategy. Considering one of 4 P’s – Product - Kotler suggests that companies need to rethink the packaging to be biodegradable (Kotler, 2011). Some literature defines products as green when manufactured through green technology or when not causing bad environmental consequences (Cellulases, Applications, & Processing, 2012). Others say that green consumption refers to products that are beneficial to the environment, or recyclable (Journal & Marketing, 2016). Sustainable has many designations, depending on the authors. It is compared with Green, for example, which is often used regarding the product itself. So a Green product must be cultivated at home, not be frozen, be organic, and not wrapped
(Tanner & Kast, 2003). Organic is another word that is commonly used. This type of products aim to increase the fertility of the soils, avoid the usage of pesticides, avoid pollution, and increase their quality (Bourn & Prescott, 2002). To narrow the scope and get to the real objective of this research, SP needs to be clearly defined. However, any research so far was able to describe exactly this concept. Procter and Gamble launched in Portugal two products that are fully produced with recycled plastic. These are Fairy and h&s. The company said that it was the time to act against the excess of plastic. Procter & Gamble defines SP as packages that are produced with 100% recycled plastic or paper. The company also explains that to pass the message that a product has a Sustainable Package, the manufacturer can use various ways. One of them is the colours of the packaging, usually green or pink. The second is through wording, for example “Palmolive’s Pure”. Additional labels can also be useful, for instance “Design for the Environment” (Lin & Chang, 2012). Consumers often do not know the difference between the different “sustainable” claims and its respective goals (Baker, Thompson, Engelken, & Huntley, 2004). To reach the purpose of this research the independent variable concept needs a deeper investigation. Due to the lack of definition this research will try to describe SP, based on the information that results from the in depth interviews and the online questionnaire sample.
2.2 Purchase Intent
PI can be defined as the conscious strategy of a consumer to buy a certain brand (Spears & Singh, 2004). This topic is recent and the buying process of sustainable products has a lot to be studied (Taylor, 2000). The fact that companies engage in this cause makes them sell the recycled products and actually make a profit (Lund 1982). Although consumers show concerns about the environment, their behaviour sometimes does not match the initial attitudes (Essoussi & Linton, 2010). The way SP can influence the consumer in the purchase decision is defended in different ways by distinct authors. Some defend that environmental attributes on packaging have no impact on the consumer decision (Roper and Parker, 2006). On the other hand, some support that environmental friendly packaging products are relevant and have an impact on customer choice (Silayoi & Speece, 2007). The stronger the relationship between the consumer and the environment, the higher is the probability that the former will buy environmental friendly products (Schuhwerk and Lefkokk-Hagius, 1995). A study from Nielsen says that the majority of consumers were expressing their ideas concerning the environment through their purchasing behaviour (Marketing, 1992). So it is not strange that people who care more about the environment actually purchase more green
products (Schlegelmilch, Bohlen, & Diamantopoulos, 1996). Currently people make a purchase decision based on their needs and at the same time try to minimize the impact on the environment (GFK, 2007; Torgler et al., 2008). However, as mentioned before, some research suggest that the expressed environmental attitudes are not consistent with the actual purchase behaviour (Barber, Kuo, Bishop, & Goodman, 2012). Other studies defend that people that have the intention to buy a product have higher purchasing rates than customers that show a lower PI (Brown, 2003). The PI also depends on the product, which means that the consumer may be or not willing to resign some elements for a more environmental friendly choice (Bazoche et al., 2008).
H1: Sustainable Packaging will have a higher impact on Purchase Intent, than Non-Sustainable;
The design of the packaging is one characteristic that brings more satisfaction to the buyer (Iran Manesh, 2008). So the PI of the consumer is influenced by how he perceived the product value. If it is positive then it will affect the PI (James, 2002). The PI leads to a purchase behaviour (Follows and Jobber, 2000).
H2: Perceived Value will positively impact Purchase Intent of consumers;
After having an ecological performance people increases their perception as consumers that engage in environmental behavior, so being environmental friendly consumers. This has an impact on their next purchase decisions. (Cornelissen, Pandelaere, Warlop, & Dewitte, 2008).
2.3 Perceived Value
PV is a multipart variable that depends on price, quality, benefits and sacrifice, and these sub parts can be intrinsic or extrinsic. The significance of this variable is calculated based on some trade-offs (Bolton and Drew, 1991; Holbrook, 1994). Some demographic characteristics may influence PV (Bolton and Drew, 1991). The value that the consumer gives to a product is built based on a reference point that reflects the customer expectations (Sinha & DeSarbo, 1998). The risk of the recycled product is more extra criteria for its evaluation, which combined with the respective price will impact the likelihood of the purchase (Essoussi & Linton, 2010). The way the message of the product is framed is also important for the PV of
consumers. Research defends that if the packaging is highlighting positive aspects of the product, the higher the value attributed to the product. If the information focus on how small negative aspects of the product are, the PV will be lower. So the framing of the message has a big importance in the way consumers perceive the value of the products (Yang, Vosgerau, & Loewenstein, 2013).
Consumers have been using social responsible criteria when buying goods. They have been choosing the ones that do not hurt the environment, which are the products that are less toxic or made with reusable and recycled materials (Lamb et al., 1994). Regarding recycled products, some consumers perceive these to be low quality (Reid, 1990). The compensatory inference strategy explains in this case that products that have greater “greenness” may have lower effectiveness in relation to regular products (Lin & Chang, 2012).
H3: Sustainable Packaging will have a higher impact on PV, than Non-Sustainable;
In fact, if the product will be perceived to have lower value due to the fact that it is recycled, than the WTP will be negatively affected, as the consumer attributes a high level of risk (Essoussi & Linton, 2010). Thus, the fourth hypotheses is the following:
H4: Perceived Value will positively impact WTP;
Besides highlighting the positive consequences of products with SP, it is also important to communicate that these will not lose convenience just because it has an environmental friendly pack. So brands have a critical role explaining to consumers the benefits of SP, and at the same time fulfil customers’ needs. One way to do this is by using values, which are desirable goals that guide peoples’ lives. Companies may promote SP by aligning its consequences with values orientation (Barber et al., 2012). Consumers may or not believe that their actions will have an impact in the environment. So the perception that each person has about his effect on the nature will affect the WTP for Sustainable Products (Banerjee and McKeage, 1994). Perceived Behavioural Control is the extent to which a person believes that his action will have an impact on the effective preservation of the environment. Consumers that have a higher PBC consequently have a more environmental friendly behaviour (de Pelsmacker et al., 2002). By increasing the available information about environmental issue, people become more aware and will change their attitudes and buying behaviour (Barber et al., 2012).
2.4 WTP
When going shopping consumers evaluate options and start to discriminate the several possibilities based on the products characteristics, especially when the difference in price is huge. So in order to be more competitive, companies need to look for customers that think and buy beyond the price tag (Bertini, Wathieu, & Iyengar, 2010). However, when faced with many options, consumers tend to make the purchase decision more based on price than when only few possibilities are in the decision basket. This happens, as price is easier to compare than the product quality (Hsee, 1996; Nowlis and Simonson, 1997). The framing of the message on the product does not only have an impact on the PV, but also on the WTP. The label on the packaging can influence radically how much a consumer is willing to spend to buy a certain product. If the package has positive information, the WTP increases. While if the message on the package is related to how a product avoids negative aspects the WTP is smaller (Yang et al., 2013).
In order to evaluate the WTP for recycled products, it is important to understand the type of the good, its usage, and the changes in consumer behaviour relative to that product. Nowadays some consumers are willing to pay a premium for sustainable products (Tsen et al., 2006), and they usually do it because they believe they will get more quality (Essoussi & Linton, 2010). Companies should create different options on price depending on the level of environmentally friendliness. Consumers who are more environmentally involved will be willing to pay more for sustainable products (Kotler, 2011).
H5: Sustainable Packaging will create a higher WTP, than Non-Sustainable;
The consumer’s assessment of the product is moderated by the category and the respective price. The WTP is impacted by the risk associated with each product. This means that the difference of the cost that the consumer faces between a sustainable and a normal package will impact the WTP, and consequently the actual PI. When this difference reaches a certain value, the likelihood of purchasing a product with a SP may change (Essoussi & Linton, 2010). Some studies show that regarding gender, there is no evidence about any difference in terms of WTP. The whole segment represents the group in which brands should focus their marketing efforts (Laroche et al. 2001). This dissertation will be able to bring value to this discussion regarding SP products. WTP can be defined as the maximum amount of money that a consumer is willing to pay for a product or service (Didier and Lucie, 2008; Franke and Schreier, 2008; Voelckner, 2006; Wertenbroch and Skiera, 2002). Although SP can influence
WTP, these environmental friendly products do not have any benefit to the consumer despite the fact that people feel good when their actions have a direct impact on the planet. The trick is to offer products that fulfil client needs, and have competitive prices. This way, companies will be able to create value for both the consumer and the brand (Barber et al., 2012).
H6: WTP positively affects Purchase Intent of consumers;
CHAPTER 3: METHODOLOGY
The methodology chapter was important to get together the secondary and primary data in order to achieve conclusions that afterwards will validate the Hypothesis presented in the Research Proposal section. For further understanding it is important to have in mind that the variable Package Stimulus includes both Sustainable and Normal Packaging populations.
3.1 Research Approach
As mentioned before, this research has two sources: secondary and primary data.
Secondary data consists in all the concepts presented in the Literature Review chapter and other sources used for this dissertation, such as the theory to build the body of the thesis and the Internet search regarding the topic. The literature chapter covers the four variables of the conceptual model of this dissertation and insights related to each one.
Primary data consists of both qualitative and quantitative “facts” that were gathered especially for this dissertation. Regarding only qualitative data collected, five in depth interviews were run. This method was useful to have insights on the definition for SP, and also to build the questionnaire. Afterwards, for the quantitative data an online survey was taken. This method is very cost effective comparing to other strategies, and allows get-together a big number of
responses to further have a complete analysis. The tool used to build the survey was Qualtrics, provided by Católica. The analysis of the data was done in SPSS.
3.2 Primary Data and Data Collection
The in depth interviews were run with five people. This method was not only effective to gather interesting qualitative data that is helpful to build the online survey, but also to get some insights regarding the SP definition. The literature was not able to get to a specific definition for this concept, as previous researches were related to the product itself and used names such as “green” and “organic”. This way, the first Research Question of the dissertation is regarding how SP must be defined. The interviewees were Portuguese and they were between 18 and 56 years old. All of them use to do shopping groceries, even if they are not the responsible for household shopping. A small guide was created with some questions regarding demographics, lifestyle, environmental awareness and attitude, and SP characteristics. Each interview took around 15 minutes. From the five in depth interviews it was possible to get several characteristics that interviewees believe make a packaging sustainable. The group of features was assessed in the online survey and these were: have recycling symbol, not made of plastic, package with brown color, can be reused, be biodegradable, can be recycled, with at least 30% made of recycled materials, fully produced with recycled materials, small package size and with no unnecessary extra features. Some of these characteristics go in the same direction as the Procter & Gamble new SP products definition. In depth interviews have strength and weaknesses. For this dissertation purpose the technique was chosen because it is not expensive and it enables to gather a lot of information from interviewees, as they have space to elaborate their answers. However, it is a very time consuming strategy.
For the purpose of this research survey was used because it allows to reach a big number people as the majority has access to Internet, it is not very time consuming and it is cost effective. The survey was sent via email and social media platforms, such as Facebook and Whatsapp. Any person who is over 18 years old, who has Internet access and able to fill in the Qualtrics survey could be part of the sample target. Besides these any other restrictions existed. Qualtrics was the tool used for the quantitative data gather. Due to time limitations it was possible to collect 182 valid responses. This number is still above he minimum required to proceed with the analysis.
The two techniques for primary data were chosen because they fit in the timing restrictions to gather all the necessary data, and they are both cost effective.
Figure 2 Sustainable Packaging in the online survey
Figure 3 Normal Packaging in the online survey
3.3 Measurement / Indicators
In order to test the conceptual model of this dissertation, the shopping environment might have been created. However it was not possible due to logistics and timings, so the respondents have a picture of the product to base their responses on. The product category chosen was washing detergent with a plastic packaging. This choice was based on the fact that the idea for this thesis came from the example of Procter & Gamble innovative products – Fairy Ocean Plastic. From previous research it is known that plastic is identified as the least environmental friendly material for packaging recently (Brouwers, 2018).
Before answering questions related to the variables of this research, it is important to understand what the respondents environmental attitudes are, the characteristics that a sustainable package must have, and to which extent respondents agree with the definition of sustainable package used in this research. The first question is regarding the environmental attitude. Although this variable does not make part of the conceptual model of this research, it is important to understand if the respondents are environmental aware and friendly or not, as it may influence the answers to the following questions. If this variable turns to be irrelevant,
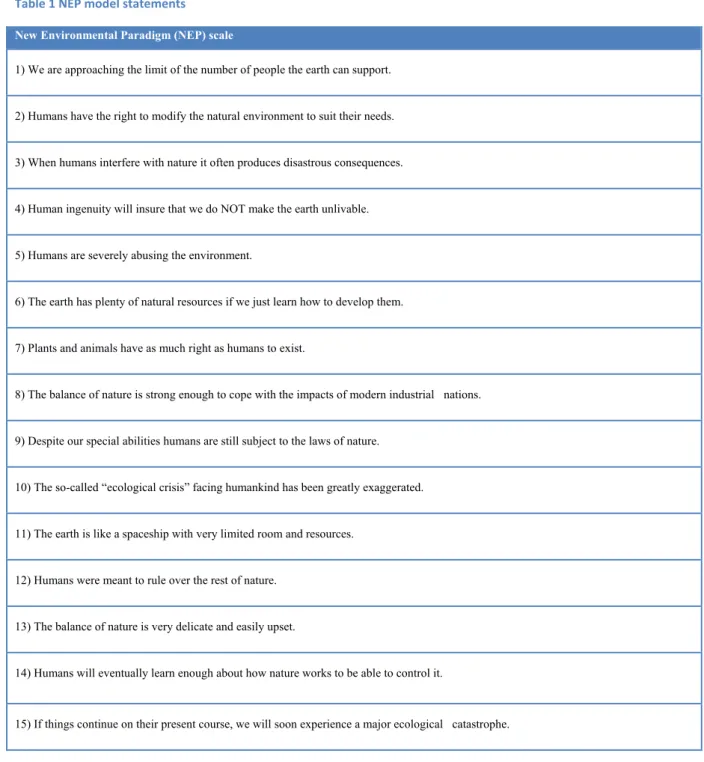
then it will not be taken into account for the conclusions. Environmental attitude was measure based on a model developed by Dunlap et al. (2000) called New Environmental Paradigm (NEP). A 7 point Likert scale is used to measure 15 statements related to the environment. This model gives a valid image of the attitude of the respondents towards the environment. In the table below you can find the statements of the NEP model. Note that the 15 phrases may have positive and negative nature.
Table 1 NEP model statements
New Environmental Paradigm (NEP) scale
1) We are approaching the limit of the number of people the earth can support.
2) Humans have the right to modify the natural environment to suit their needs.
3) When humans interfere with nature it often produces disastrous consequences.
4) Human ingenuity will insure that we do NOT make the earth unlivable.
5) Humans are severely abusing the environment.
6) The earth has plenty of natural resources if we just learn how to develop them.
7) Plants and animals have as much right as humans to exist.
8) The balance of nature is strong enough to cope with the impacts of modern industrial nations.
9) Despite our special abilities humans are still subject to the laws of nature.
10) The so-called “ecological crisis” facing humankind has been greatly exaggerated.
11) The earth is like a spaceship with very limited room and resources.
12) Humans were meant to rule over the rest of nature.
13) The balance of nature is very delicate and easily upset.
14) Humans will eventually learn enough about how nature works to be able to control it.
The second question is related to the characteristics of SP. For this one the results of the in depth interviews were used. All the characteristics that were by the interviewees were selected to the list used in the online questionnaire. The respondents were asked to order the characteristics based on their opinion from the one that best defines until the one that least defines SP. The characteristics gathered in the in depth interviews were: recycling symbol, not made of plastic, brown color, can be reused, biodegradable (“type of degradation involving biological activity” (Waber, Mann, & Merola, 1985)), can be recycled, made fully of recycled materials, made with at least 30% of recycled materials, small package size (without any extra unnecessary space), and without any extra unnecessary features on the package. Finally in the third question, a definition of SP was given based on the Procter&Gamble new product launches. From a 7 point Likert scale the respondents had to decide their level of agreement from “I strongly disagree” to “I strongly agree”. The two questions explained above were randomly ordered to avoid respondents to be influenced. To study the PI variable, a model used by Spears & Singh (2004) was chosen. According to the authors PI can be measured by a 7 point semantic differential scale with 5 items (“I definitely do not buy it” – “I definitely buy it”; “I definitely do not intend to buy it” – “I definitely intend to buy it”; “I have very low purchase interest” – “I have very high purchase interest”; “I never intend to buy it” – “I definitely intend buy it”; “I probably do not buy it” – “I probably buy it”).
PV is a complex variable. As explained in the Literature Review it is a mix of quality, price, benefits and sacrifice. Bao (2011) perceived quality construct was used to directly measure PV, using a 7 point semantic differential scale with 4 items (“of very bad quality” – “of very good quality”; “an inferior product” – “a superior product”; “not at all reliable” – “very reliable”; “of low quality” – “of high quality”).
Finally regarding WTP, different authors measured this variable in the past using distinct methods. The one chosen for this research was a direct question of the maximum value that respondents are willing to pay for the product shown. This method was used by Van Doorn & Verhoef (2011).
Finally some questions regarding demographics were asked in order to have information about the respondents. These included gender, age, residence, occupation, household number, and household monthly net income.
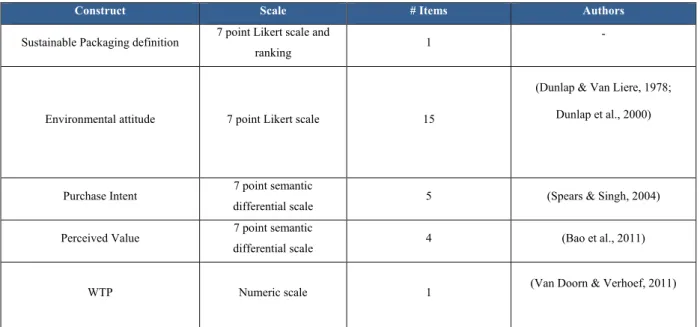
Table 2 Constructs
Construct Scale # Items Authors
Sustainable Packaging definition 7 point Likert scale and
ranking 1
-
Environmental attitude 7 point Likert scale 15
(Dunlap & Van Liere, 1978; Dunlap et al., 2000)
Purchase Intent 7 point semantic
differential scale 5 (Spears & Singh, 2004) Perceived Value 7 point semantic
differential scale 4 (Bao et al., 2011)
WTP Numeric scale 1 (Van Doorn & Verhoef, 2011)
3.4. Data Analysis
SPPS program was used to analyze the quantitative data gathered in the online survey. Statistical tests were run.
The first analysis was on the sample. Descriptive statistics were used to describe de population that responded to the survey, mainly demographic information.
In the second place in order to validate the RH and respond to the Research Questions statistical tests such as, Independent Sample T Tests and Linear Regressions were run.
In order to check the different influence that NP and SP stimulus may have on PI, PV and WTP Independent Sample T Tests were used. This statistical test allows comparing the means of two independent groups, which in this case were the one that got the NP stimulus, and the one that was exposed to the SP stimulus. Respondents were presented to only one of these scenarios, and responded accordingly to the questions. For this statistical purpose the ANOVA could have been chosen as well. However Independent Sample T-test is specifically to two independent groups only, which was the case.
In order to study the relationship of variables such as PV and WTP, PV and PI, WTP and PI, regression analysis were done. This statistical analysis enables not only to understand if there is a relationship but the nature of the relationship as well
Finally, in order to assess the overall impact of the mediators in the model the add-on to SPSS Process was used. The conceptual model of this dissertation is model 6, meaning two mediators.
CHAPTER 4: RESULTS AND DISCUSSION 4.1 Results
It is in this chapter where quantitative and qualitative data are analyzed. The RH mentioned in the Literature Review section are tested and Research Questions are responded in the end. 4.1.1 Sample Characterization
The sample for this analysis is composed by 182 valid responses. As explained half got the NP and the other half SP stimulus. The questions asked to one group were exactly the same for the other group, only the stimulus varied.
The majority was female – 114 - while male – 68. More than 50% of the population was between 21 and 30 years old. The majority of respondents currently reside in Portugal – 89,6% - while nearly all from the remaining percentage belongs to European countries such as Belgium, Denmark, Germany, Hungary, Netherlands, Poland, Romania, Spain, Switzerland and UK, and there was one respondent from Chile. Regarding the occupation 52,7% of the population was employed and 31,5% is studying. 10% was working and studying at the same time. Concerning the number of people in the household three was the most common answer (32,1%), followed by four (22,3%) and two (14,1%). The large percentage of the population has a household monthly net income between 2,000€ and 2,999€ (21,2%). The second most common answer was 1,000€ to 1,999€ with 16,3%, followed by 3,000€ to 3,999€ with 15,2% of the population. These ranges are higher compared to the average income level in Portugal in 2018 - 887,€ (Correio da Manhã). Regarding the frequency people go for groceries shopping the results show that 29,3% goes more than once a week, 40% go once a week, 15,8% go once every two weeks, 11,4% once a month and around 2% never go. Finally 57,6% are responsible for the groceries shop in the household, while the rest is not. If these two questions are combined, it is possible to see that the respondents who are responsible for the household groceries shopping are the ones that go more often to shop – once a week (44 respondents) or more often (47). In the same way, the percentage of the population who are not responsible for the household groceries shopping go less often, for example once a month (19), once every two weeks (29). From those who are not responsible only 7 go more than once a week.
4.1.2 Measure Reliability
In order to evaluate the construct reliability of the sample Cronbach’s Alpha tests were run for PI, PV and Environmental Attitude. As there were two different groups of respondents the Cronbach’s Alpha test was done for SP group, for NP group and for the global sample for each of the three constructs mentioned above.
Regarding PI all Cronbach’s Alpha values were above 0,9 that means that the reliability of these was excellent (George, D. and Mallery, P. ,2003). NP with 0,962, SP with 0,975 and global PI 0,962. The Cronbach’s Alpha would not increase in case one of the items would be excluded.
PV Cronbach’s Alpha values were also good and excellent (George, D. and Mallery, P. ,2003). NP value was 0,896, SP was 0,955 and global PV was 0,937. In case the item “not at all reliable – very reliable” was excluded the Cronbach’s Alpha values for the three groups (NP, SP and Global) would increase to 0,94, 0,961 and 0,954. The improvement on reliability would not be significant, and due to the fact that it was already good and excellent the number of items were not changed.
Regarding Environmental Attitude the Cronbach’s Alpha values were Acceptable for NP (0,792) and good for SP (0,824) and Global (0,810). However if some items were excluded the reliability would increase. In the case of NP the items to exclude were: “Humans have the right to modify the natural environment to suit their needs”, “Humans ingenuity will insure that we do not make earth unlivable”, “The earth has plenty of natural resources if we just learn how to develop them”, “Humans will eventually learn enough about how nature works to be able to control it” and “The earth is like a spaceship with very limited room and resources”. The Cronbach’s Alpha increased to 0,808, which was a good reliability (George, D. and Mallery, P. ,2003). The same happened with SP, but by excluding fewer items that were “We are approaching the limit of the number of people the earth can support”, “Despite our special abilities humans are still subject to the laws of nature” and “The balance of nature is very delicate and easily upset”. The reliability increased from 0,824 to 0,839, which was not a significant improvement. Thus the exclusion was not considered essential. The global that includes all responses (from Normal and Sustainable Packaging) would not increase in case some items were excluded.
Table 3 Cronbach's Alpha before aggregation
Before aggregation
Purchase Intent Number of Items Cronbach’s Alpha
Normal Packaging 5 0,962
Sustainable Packaging 5 0,975
Global 5 0,970
Perceived Value Number of Items Cronbach’s Alpha
Normal Packaging 4 0,896
Sustainable Packaging 4 0,955
Global 4 0,937
Environmental Attitude Number of Items Cronbach’s Alpha
Normal Packaging 15 0,792
Sustainable Packaging 15 0,824
Global 15 0,810
Table 4 Cronbach's Alpha after aggregation
After aggregation
Purchase Intent Number of Items Cronbach’s Alpha
Normal Packaging 5 0,962
Sustainable Packaging 5 0,975
Global 5 0,970
Perceived Value Number of Items Cronbach’s Alpha
Normal Packaging 4 0,896
Sustainable Packaging 4 0,955
Global 4 0,937
Environmental Attitude Number of Items Cronbach’s Alpha
Normal Packaging 10 0,808
Sustainable Packaging 15 0,824
Global 15 0,810
4.1.3 Results from Hypothesis Tests
4.1.3.1 Hypothesis 1: Sustainable Packaging will have a higher impact on Purchase Intent, than Non-Sustainable.
a) Independent Sample T-test: Difference on impact between Sustainable and Non-Sustainable Packaging on Purchase Intent.
The first RH says that Sustainable Packaging has a higher impact on the PI of consumers than the NP. An Independent Sample T-test was run so that the different impacts of SP and NP on PI of consumers could be analysed.
The homogeneity of variances is not validated, as p-value is 0,026, meaning that the important line was “Equal variances not assumed”. Regarding the normal distribution the Shapiro Wilk test was used because the sample is relatively small, and it was rejected (p-value is 0,003) meaning that there is no normal distribution. However by looking to the histogram the PI can be considered normally distributed.
This way in the Independent Sample Test table, by looking to the line “Equal variances not assumed”, for a significance value of 5% the p-value is 0,399 meaning that NP and SP do not have a statistically different impact on PI. Therefore the Hypothesis 1 is not validated.
b) Linear Regression: Impact of Packaging Stimulus on Purchase Intent.
𝐻0: 𝛽 = 0
In order to check the relationship between the Packaging Stimulus variable on the PI of the consumer a regression analysis was run.
The assumptions for the linear regression were checked. The Durbin-Watson is 2,059 meaning that there is independence of observations. The variables are approximately normally distributed (normal p-p plot), and there is homoscedastic (scatter plot). The residual errors of regressions are approximately normally distributed (histogram). Finally there is no multicollinearity (Tolerance=1).
The mean of PI is 4,1011, which within the range 0 to 7 is neither too high nor too low. The correlation between the two variables is positive but very low (𝜌 = 0,063). Moreover, the R square value is 0,004, meaning that only 0,4% of the PI variance is explained by the model, which is very small. By interpreting the ANOVA table it is possible to determine that the model does not significantly predict the PI, because p-value is 0,399. The coefficients table shows that for a confidence level of 95%, the Packaging Stimulus variable does not statistically impact the PI of consumers (p-value is 0,399). Therefore it is fair to conclude that Packaging Stimulus does not significantly affect the consumers PIion.
As an overall deduction Packaging Stimulus is not important in the PI of the consumer and the possibility of being sustainable does not affect the level of PIion. Consequently Packaging Stimulus variable is irrelevant for PI.
4.1.3.2 Hypothesis 2: Perceived Value will positively impact Purchase Intent of consumers.
a) Linear Regression: Impact of Perceived Value on Purchase Intent of consumers.
𝐻0: 𝛽 = 0
To study the impact of PV on PI of consumers a regression analysis was run. Both variables are metric.
The assumptions for the linear regression were checked. The Durbin-Watson is 2,124 meaning that there is independence of observations. The variables are approximately normally distributed (normal p-p plot), and there is homoscedastic (scatter plot). The residual errors of regressions are approximately normally distributed (histogram). Finally there is no multicollinearity (Tolerance=1).
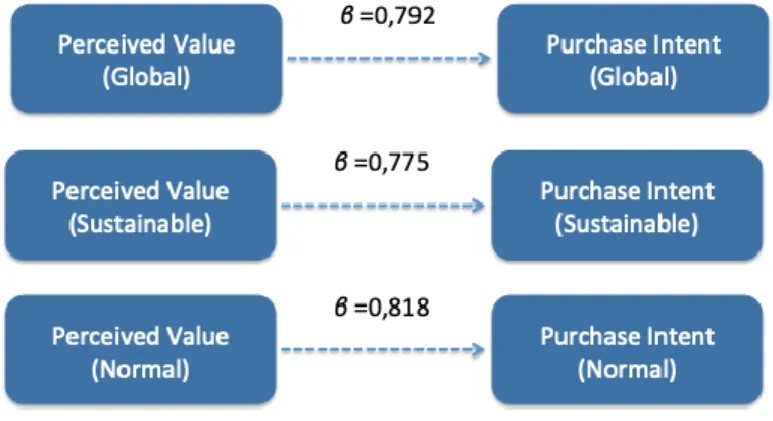
By looking to the mean of both PI and PV it is possible to see that in a range from 0 to7 the values are not very high or very low. This means that respondents’ level of agreements is similar for both variables. The correlation between PV and PI is positive and high (𝜌 = 0,735), meaning that the value perceived by the consumer increases his/her PI. The R-square value is 0,540, which is close to 60% (minimum acceptable for pure science studies). So this model explains 54% of the PI variance. By looking to the ANOVA table it is possible to see that this model significantly predicts the PI of consumers (p-value is 0), and at a significance level of 5% the PV has a statistically significant impact on the PI of consumers (p-value is 0). Unstandardized Beta is 0,792 meaning that by increasing 1 unit of PV the PI will increase 0,792 units.
Therefore Hypothesis 2 is validated and PV has a positive impact on the PI of consumers.
b) Linear Regression: Impact of Sustainable Packaging Perceived Value in the Purchase Intent of consumers.
𝐻0: 𝛽 = 0
It would be interesting to understand of the relationship of PV and PI maintains in case respondents only are analysed. For this a regression analysis was done taking into consideration the respondents who had the SP stimulus.
The assumptions for the linear regression were checked. The Durbin-Watson is 1,875 meaning that there is independence of observations. The variables are approximately normally distributed (normal p-p plot), and there is homoscedastic (scatter plot). The residual errors of regressions are approximately normally distributed (histogram). Finally there is no multicollinearity (Tolerance=1).
The mean of PI had a small increase (from 4.1011 to 4.1890) and it is a similar scenario for the PV (from 4.1580 to 1.2500). This means that the SP respondents on average have a higher level of agreement compared to the global standard. Regarding the correlation, both variables continue to be positively and highly correlated (𝜌 = 0,755), just a little bit higher in this case. In regards to the R-square the value had a small increase compared to the global analysis (57,1%) so this model explains almost 60% of the PI variance. Looking to the ANOVA table the p-value is 0 meaning that this model significantly explains the PI of consumers that got the SP stimulus. For a significant level of 5% PV of SP has a significant impact in the PI of consumers (p-value is 0). By looking to the Unstandardized Beta (0,776) it is possible to conclude that for the SP respondents by increasing one unit of PV their PI will increase 0,776 units. This rate is a little bit smaller than the global model.
Therefore when analysing the SP group the correlation between PV and PI is higher than the global model, but the impact of the independent variable on PI is slightly smaller.
c) Linear Regression: Impact of Normal Packaging Perceived Value on Purchase Intent of consumers.
𝐻0: 𝛽 = 0
In the same way the SP group was analysed, the NP group was taken into consideration for the investigation.
The assumptions for the linear regression were checked. The Durbin-Watson is 2,547 meaning that there may be some negative autocorrelation. The variables are approximately normally distributed (normal p-p plot), and the scatter plot shows homoscedastic data. The residual errors of regressions are approximately normally distributed (histogram). Finally there is no multicollinearity (Tolerance=1).
Looking to the PI and PV means these are slightly lower than the global averages and than the sustainable group. The correlation is also smaller (𝜌 = 0,703) compared to both analyses done previously, although remains positive and high. Regarding the R-square value (0,495) the model explains less of the PI variance than the global and SP models. Although this percentage is farer from the 60% it is almost 50%. Regarding the ANOVA table for a significance level of 5% the model significantly explains that PI of consumers (p-value is 0). By looking to the Coefficients it is possible to conclude that with a 95% level of confidence the PV of NP impact the PI of consumers (p-value is 0). The Unstandardized Beta value is 0,818 meaning that by increasing the PV the PI for the NP group will increase 0,818 units, which is higher compared to the impact for global and SP group.
Therefore although the correlation between variables is lower than the global and SP group, the impact of PV on the PI of consumers is higher. Overall this means that for the SP the relationship between PV and the PI is greater than for the NP, but the impact is lower.
4.1.3.3 Hypothesis 3: Sustainable Packaging will have a higher impact on Perceived Value, than Non-Sustainable.
a) Independent Sample T-test: Difference of the impact of Sustainable and Normal Packaging on Perceived Value.
To validate the different impact between the Sustainable Packaging and NP on the PV an Independent Sample T-test was run, because Sustainable and Normal were two independent groups.
𝐻0: 𝜇 𝑁𝑜𝑟𝑚𝑎𝑙 𝑃𝑎𝑐𝑘𝑎𝑔𝑖𝑛𝑔 = 𝜇 𝑆𝑢𝑠𝑡𝑎𝑖𝑛𝑎𝑏𝑙𝑒 𝑃𝑎𝑐𝑘𝑎𝑔𝑖𝑛𝑔
The homogeneity of variances was not validated, thus the line used for the analysis was “Equal variances not assumed”. Regarding the normal distribution the Shapiro - Wilk test null hypothesis was rejected, however the histogram shows a normal tendency for the PV variable. By looking to the means of PV it is possible to see that NP has a lower value than Sustainable Packaging. This means that the PV of NP products is lower than the PV of products with SP. As the homogeneity of variances is not valid (p-value is 0,004), by looking to the line “Equal variances not assumed” the p-value is 0,342 meaning that NP does not have a statistically different effect on PV. Therefore RH 3 is not valid.
b) Linear Regression: Impact of Package Stimulus variable on Perceived Value.
𝐻0: 𝛽 = 0
After concluding that Normal Package does not have a different impact on PV than Sustainable Package, it is important to understand if the Package Stimulus variable affects the PV. Consequently a Regression Analysis was done for the global sample.
The assumptions for the linear regression were checked. The Durbin-Watson is 1,922 meaning that there is independence of observations. The variables are approximately normally distributed (normal p-p plot), and there is homoscedastic (scatter plot). The residual errors of regressions are approximately normally distributed (histogram). Finally there is no multicollinearity (Tolerance=1).
The correlation between the two variables is positive and very weak (𝜌 = 0,071). Moreover the R-square value is 0,005 meaning that only 0,5% of the PV variance is explained by the model, which is an extremely low fraction. The ANOVA table shows that for a significance level of 5% this model does not significantly explain the PV (p-value is 0,342). In the same way from the Coefficients table it is feasible to conclude that Packaging Stimulus does not affect the PV (p-value is 0,342).
4.1.3.4 Hypothesis 4: Perceived Value will positively impact WTP. a) Linear Regression: Impact of Perceived Value on WTP.
𝐻0: 𝛽 = 0
Another relationship showed in the concept model is the one between PV and WTP. Both are metric variables and a Regression Analysis was run to study their association.
The Durbin-Watson is 1,917 meaning that there is independence of observations. The variables are approximately normally distributed (normal p-p plot), and the data is homoscedastic (scatter plot). The residual errors of regressions are approximately normally distributed (histogram). Finally there is no multicollinearity (Tolerance=1).
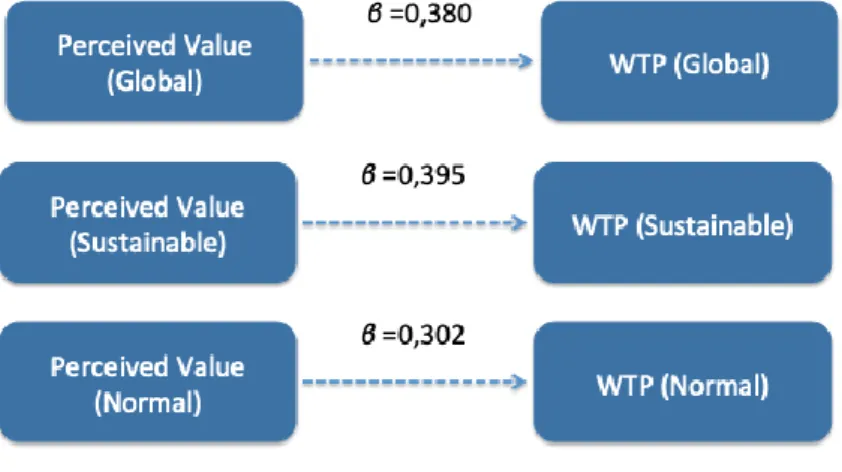
The correlation between the two variables is positive but it is not considered high (𝜌 = 0,372). The same happens with the R-square value (0,138) that means that the model only explains 13,8% of the WTP variance. The ANOVA table shows that the model significantly predicts the WTP of consumers (p-value is 0) for a 5% significance value. Looking to the coefficients table the p-value is also 0 meaning that PV impacts the WTP for a 95% confidence level. The Unstandardized Beta value is 0,380 meaning that by increasing one unit of PV the WTP will increase 0,380. To sum up the RH 4 is valid and PV has a positive impact on WTP.
b) Linear Regression: Impact of Perceived Value of Sustainable Packaging on WTP.
𝐻0: 𝛽 = 0
It would be interesting to know how Perceived Value impacts WTP in case the packaging is sustainable. This way a Linear Regression test was taken only with the Sustainable Packaging group.
The assumptions for the linear regression were checked. The Durbin-Watson is 1,950 meaning that there is independence of observations. The variables are approximately normally distributed (normal p-p plot), and the data is homoscedastic (scatter plot). The residual errors of regressions are approximately normally distributed (histogram). Finally there is no multicollinearity (Tolerance=1).
Starting by comparing the mean of the WTP variable it is possible to see that the group with SP stimulus is willing to pay a high price for the product than the average value for the global sample (Sustainable WTP is 2,6813 and Global WTP is 2,3132). By looking to the mean of the PV the result is the same (Sustainable PV is 4,2500 and Global PV is 4,1580). In this case the correlation between the variable is higher compared to the global sample (𝜌𝑠𝑢𝑠𝑡𝑎𝑖𝑛𝑎𝑏𝑙𝑒 = 0,386 𝑎𝑛𝑑 𝜌𝑔𝑙𝑜𝑏𝑎𝑙 = 0,372) but it is still considered low. The same reasoning applied to the R-square that is 0,149, meaning only 14,9% of the WTP variance is explained by the model, which is very low. The ANOVA table shows that this model significantly predicts the WTP of the consumers (p-value is 0). Furthermore for a 95% confidence level it is fair to conclude that PV significantly impacts WTP (p-value is 0) and by increasing one unit of PV the WTP for the Sustainable Packaging group increases by 0,395 units (Unstandardized Beta is 0,395).
Comparing to the global sample, the impact is still positive and a little higher.
c) Linear Regression: Impact of Perceived Value of Normal Packaging on the WTP.
𝐻0: 𝛽 = 0
Applying the same exercise for the NP group, a Liner Regression analysis was run to check the relationship between the PV and the WTP.
The assumptions for the linear regression were checked. The Durbin-Watson is 2,033 meaning that there is independence of observations. The variables are approximately normally distributed (normal p-p plot), and there is homoscedastic (scatter plot). The residual errors of regressions are approximately normally distributed (histogram). Finally there is no multicollinearity (Tolerance=1).
Comparing the means of the WTP it is possible to see that the value for NP (1,9451) is smaller than the global sample and the Sustainable Packaging group. The correlation for the NP group is the lowest from the three groups (𝜌 = 0,331). The same happens for WTP variance explained by the model (R-square is 0,109), which is very low. By looking to the ANOVA table it is fair to conclude that the model significantly predicts the WTP (p-value is 0,001). For a significance level of 5% the p-value is 0,001 as well meaning that PV significantly impacts the WTP of consumers for the NP group. In this case the
Unstandardized Beta value is 0,302 meaning that by increasing the PV by one unit the WTP will increase 0,302 units.
Therefore comparing the three groups, PV impacts the WTP, where the one with the biggest correlation and the biggest increase is the Sustainable group.
4.1.3.5 Hypothesis 5: Sustainable Packaging will create a higher WTP, than Non-Sustainable.
a) Independent Sample T-test: Difference of the impact of Sustainable and Normal Packaging on WTP.
In order to analyse the different impact the SP and NP have on WTP an Independent Sample T-test was run, as Sustainable and Normal are two independent groups.
𝐻0: 𝜇 𝑁𝑜𝑟𝑚𝑎𝑙 𝑃𝑎𝑐𝑘𝑎𝑔𝑖𝑛𝑔 = 𝜇 𝑆𝑢𝑠𝑡𝑎𝑖𝑛𝑎𝑏𝑙𝑒 𝑃𝑎𝑐𝑘𝑎𝑔𝑖𝑛𝑔
The assumptions for this statistical test were checked. As it happened with the other independent sample t-tests the Leven’s test was rejected, meaning that for the analysis the line used was “Equal variances not assumed”. Regarding the normal distribution the Shapiro-Wilk test was also rejected. However it is possible to see in the histogram that there is a normal distribution.
By looking to the means of the WTP for both groups it is possible to see that the SP group is willing to pay a higher value (2,6813) than the NP group (1,9451). The Levene’s test is
rejected (value is 0,009) so by looking to the line “Equal variances not assumed” the p-value is 0 meaning that SP statistically differently affects WTP than NP. Taking into account that the mean of WTP for SP is higher than the WTP for NP the RH 5 is validated.
b) Linear Regression: Impact of Packaging stimulus variable on WTP.
𝐻0: 𝛽 = 0
After checking the SP has a higher impact on WTP than NP it would be interesting to know how Packaging stimulus variable relates to the WTP. For this a Linear Regression analysis was done.
The assumptions for the linear regression were checked. The Durbin-Watson is 1,840 meaning that there is independence of observations. The variables are approximately normally distributed (normal p-p plot), and there is homoscedastic (scatter plot). The residual errors of regressions are approximately normally distributed (histogram). Finally there is no multicollinearity (Tolerance=1).
The correlations table shows that Packaging Stimulus and WTP are positively correlated but the value is very small (𝜌 = 0,277). Another value that is very low is the R-square (0,077) meaning that the WTP variance explained by this model is only 7%. Looking to the ANOVA table it is possible to see that this model significantly predicts the WTP of consumers (p-value is 0). For a 95% of confidence level the p-value is 0 meaning that the Packaging Stimulus variable significantly impacts the WTP of consumers, and by changing from Normal to the WTP increases by 0,736 units.
4.1.3.6 Hypothesis 6: WTP positively affects Purchase Intent of consumers. a) Linear Regression: Impact of WTP on Purchase Intent of consumers.
𝐻0: 𝛽 = 0
Finally the last RH analyses the relationship between WTP and PI. Both are metric variables and a Linear Regression was done for the global sample.
The assumptions for the linear regression were checked. The Durbin-Watson is 2,052 meaning that there is independence of observations. The variables are approximately normally distributed (normal p-p plot), and there is no homoscedastic as the scatter plot shows a cone format. The residual errors of regressions are approximately normally distributed (histogram). Finally there is no multicollinearity (Tolerance=1).
Looking to the correlations table it is possible to see that these variables are positively and poorly correlated (𝜌 = 0,393). In this case the R-square is 0,154 meaning that the model only explains 15,4% of the PI variance, which is very low. For a significance level of 5% the ANOVA table shows that the model significantly predicts the PI of the consumers (p-value is 0). In this case WTP significantly affects the PI (p-value is 0) and by increasing one unit of WTP the PI of consumers increases by 0,414.
Therefore the RH 6 is validated and WTP positively affects the PI.
b) Linear Regression: Impact of WTP of Sustainable Packaging on Purchase Intent of consumers.
𝐻0: 𝛽 = 0
Making the same exercise as in the other hypothesis a Linear Regression analysis was done for the Sustainable group only.
The assumptions for the linear regression were checked. The Durbin-Watson is 1,817 meaning that there is independence of observations. The variables are approximately normally distributed (normal p-p plot), and there is not homoscedastic data because the scatter plot had the format of a cone. The residual errors of regressions are approximately normally distributed (histogram). Finally there is no multicollinearity (Tolerance=1).
For the Sustainable group WTP is positively and mid correlated with PI. The correlation value is higher than the global one (𝜌 = 0,427). The same happens with the R-square (0,182) that shows that in this case the model only explains 18,2% of the PI variance. Although it is higher than the global value it is still very low. In the ANOVA table the p-value is 0 meaning that the model significantly predicts the PI of consumers. For the SP group the WTP significantly impacts the PI of consumers, and by increasing one unit of WTP the PI will increase by 0,429