UNIVERSIDADE DE LISBOA FACULDADE DE CIÊNCIAS DEPARTAMENTO DE INFORMÁTICA
VISUALIZATION OF SPATIO-TEMPORAL INFORMATION FOR
PERSONAL PERFORMANCE ANALYSIS IN GAMES
Pedro Miguel Almeida Vieira
Mestrado em Engenharia Informática Especialização em Sistemas de Informação
Dissertação orientada por: Prof. Dra. Ana Paula Pereira Afonso e
Mestre Tiago José Lopes Gonçalves
Agradecimentos
Quero começar por agradecer aos meus orientadores Prof. Doutora Ana Paula Pereira Afonso e Mestre Tiago José Lopes Gonçalves por me terem apoiado e acompanhado ao longo deste ano. Quero também agradecer à Prof. Doutora Maria Beatriz Carmo pela sua disponibilidade para me acompanhar ao longo desta jornada. O bom ambiente e boa disposição com que se trabalhou, assim como a motivação dada contribuíram para que se concretizasse este projeto de uma forma mais fácil. Quero especialmente agradecer ao Tiago Gonçalves por toda a paciência e apoio que levou a melhorar a qualidade deste projeto.
Deixo um grande agradecimento à minha família (mãe e avós) por me terem apoiado ao longo de todo este tempo, e por terem acreditado em mim desde sempre. Sem todos os esforços e sacrifícios que fizeram certamente nunca conseguiria ter chegado tão longe.
Deixo também um agradecimento especial à minha namorada, Mariana, por todo o apoio, todo o amor, amizade e motivação dada ao longo de todo este tempo. Obrigado por estares aqui ao meu lado, por toda a paciência que tiveste e por teres acreditado sempre em mim.
Quero agradecer ao meu amigo Nuno pela companhia, distração e motivação. Quero também agradecer aos amigos que conheci na faculdade, o Tiago, o Bruno e o Luz pelo apoio e pelos momentos de distração que foram importantes para recarregar energias. Sem vocês esta experiência teria sido mais penosa e certamente menos interessante. Quero também agradecer aos meus amigos de longa data, Pedro e Alexandre, e todos os membros da Bronca na Gala pelos bons momentos partilhados convosco. Espero poder continuar a partilhar a minha vida com todos vocês.
A todos os voluntários que participaram nas entrevistas preliminares e no estudo realizado por disponibilizarem o vosso tempo e partilharem o vosso conhecimento do
League of Legends comigo. Toda a vossa ajuda foi crucial para que este projeto se
pudesse concretizar e, quem sabe possa continuar a andar para a frente.
Quero finalmente agradecer aos meus restantes amigos, membros de família e todos aquelas que, de alguma forma, contribuíram para a minha evolução pessoal e profissional.
i
Resumo
Nos últimos anos, o fenómeno do e-sports (desportos eletrónicos) tem vindo a crescer. Consequentemente, o interesse em videojogos online também aumentou drasticamente. Hoje em dia, os grupos que demonstram interesse nesta área vão muito para além dos jogadores. Em contextos profissionais, existem analistas e treinadores que são responsáveis por guiar e aconselhar equipas de jogadores que competem em torneios e ligas oficiais com prémios monetários. Por outro lado, em contextos casuais, é cada vez mais comum existirem indivíduos que assistem a partidas de jogos online como uma fonte de entretenimento. Estes indivíduos encaixam-se num novo grupo emergente chamado de espetadores. Existem hoje em dia plataformas como a Twitch ou o YouTube Gaming, dedicadas exclusivamente à cultura dos videojogos, onde os indivíduos pertencentes a este grupo podem observar jogadores a transmitir a sua experiência de jogo.
Um dos géneros de jogos mais populares, e com maior audiência no mundo do
e-sports é o MOBA (Multiplayer Online Battle Arena), também conhecido como ARTS
(Action Real-Time Strategy). Este tipo de jogos é caracterizado por ser jogado por duas equipas, tipicamente com cinco elementos cada, que lançam ataques coordenados na base da equipa adversária com o objetivo de a destruir. As partidas deste tipo de jogo podem durar uma quantidade de tempo ilimitada, sendo que, tipicamente, não ultrapassam os 30 a 40 minutos. Cada um dos jogadores pode escolher uma personagem, de um conjunto com várias dezenas de possibilidades, que o irá representar durante uma partida. Estas personagens possuem um conjunto único de habilidades que podem ser utilizadas para interagir com os outros jogadores e com os elementos do ambiente virtual.
Tal como em desportos tradicionais, durante uma partida deste tipo de jogos, existem vários eventos que são de interesse para jogadores, espetadores, treinadores e analistas. Existem eventos que são comuns entre estes dois contextos, tais como, a posição de um jogador num determinado instante, ou o caminho que este fez do ponto A até ao ponto B. No entanto, existem também eventos que são mais específicos dos jogos virtuais, tais como, a posição onde um jogador morreu ou a destruição de certas estruturas defensivas. De qualquer modo, estes eventos podem ser analisados de modo a tentar extrair padrões de comportamento e estratégias de jogo que são utilizadas.
ii
A grande diferença entre estes contextos, é que com a evolução tecnológica, tem-se tornado cada vez mais fácil e comum a instrumentação do código fonte dos videojogos com técnicas de telemetria para recolher dados sobre estes eventos. Por sua vez, isto faz com que, à medida que o tempo passa, sejam gerados grandes volumes de dados que podem ser utilizados para análise. Para poder utilizar estes dados para análise de um modo mais eficaz e eficiente, é necessário explorar diversas técnicas de visualização, sejam elas existentes ou novas, de modo a perceber quais é que são mais adequadas para aplicar ao tipo de dados disponíveis no contexto da análise de videojogos.
Estudos anteriores relevam que, apesar das diversas técnicas de visualização que podem ser aplicadas, especialmente no âmbito da análise de dados espácio-temporais, tanto a indústria dos videojogos, como as plataformas dedicadas às comunidades de jogo, praticamente não tiram partido do uso das mesmas. Contudo, tanto a comunidade cientifica como as equipas de desenvolvimento de videojogos, têm começado a utilizar algumas destas técnicas, o que demonstra interesse em incorporá-las no contexto da análise de videojogos. A grande maioria das técnicas aplicadas neste âmbito consiste em vários tipos de gráficos e tabelas que são utilizados para demonstrar estatísticas e dados temáticos. Algumas plataformas tiram partido das componentes espaciais dos dados, para utilizar diversas técnicas baseadas em mapas, tais como heatmaps e mapas de coropletas. No entanto, apesar de algumas destas técnicas utilizarem a componente temporal ou a componente espacial dos dados, é difícil encontrar exemplos da utilização de técnicas de visualização no contexto da análise de videojogos que utilizem ambas as componentes em simultâneo.
Tendo isto em conta, o foco deste trabalho consiste em tirar partido da vasta popularidade dos videojogos, combinada com a grande quantidade de dados telemétricos que estão disponíveis, com o objetivo de estudar o uso de diversas técnicas de visualização aplicadas no contexto da análise do desempenho de jogadores utilizando tanto as componentes espácio-temporais dos dados, assim como as componentes temáticas. Nesse sentido, durante este trabalho, foi desenvolvido o protótipo VisuaLeague, que incorpora diversas técnicas de visualização, em particular mapas animados, que permite aos utilizadores analisarem o desempenho de jogadores em partidas de League of Legends. A escolha deste jogo em particular como caso de estudo, deve-se ao facto de ser um dos mais populares jogos do género MOBA e, consequentemente, existir uma grande quantidade de dados disponíveis relativos a partidas do mesmo. Devido à sua popularidade, é também fácil encontrar indivíduos interessados em colaborar nas decisões que envolvem o processo de desenvolvimento.
A solução desenvolvida foca-se maioritariamente na utilização de técnicas de visualização que permitam observar dados que incorporem componentes que evoluam
iii
ao longo do tempo. Em particular, neste protótipo é utilizada a técnica de mapas animados para visualizar as posições e as trajetórias de até dois jogadores de equipas adversárias. É também possível, através desta técnica, visualizar os vários eventos que decorrem durante uma partida, tais como a destruição de estruturas defensivas ou a mortes dos jogadores. Esta técnica é complementada por um conjunto de gráficos, tabelas e outras visualizações que, apesar de não incorporarem a componente espacial dos dados, permitem visualizar a evolução ao longo do tempo de diversas métricas temáticas que são tipicamente utilizadas noutras plataformas dedicadas à analise do desempenho de jogadores de League of Legends.
Posteriormente, foi realizado um estudo com o objetivo de avaliar as técnicas utilizadas, assim como para perceber qual o papel que os dados espácio-temporais têm na análise do desempenho dos jogadores, quando feita por outros jogadores. Os resultados mostram que as técnicas utilizadas, nomeadamente o mapa animado, são adequadas tanto para transmitir a informação espácio-temporal associada ao movimento dos jogadores e aos eventos que decorrem durante uma partida, assim como a informação temática que lhes está associada. Os resultados mostram ainda que a utilização de técnicas não estáticas, ou seja, que evoluam ao longo do tempo, é uma mais valia, pois permite a extração de padrões de jogo e estratégias utilizadas, o qual não é possível com as técnicas tipicamente utilizadas neste contexto. Para além disso, os resultados apontam para a elevada importância da informação espácio-temporal para análise do desempenho dos jogadores, sendo que estas permitem uma análise mais detalhada.
Apesar do trabalho desenvolvido ser uma boa base para novos trabalhos na área, os resultados obtidos apontam para a necessidade de melhorar a solução criada. Deste modo, como trabalho futuro, o primeiro caminho a tomar será resolver o problema de sobreposição dos eventos no mapa animado, de modo a garantir que este fator não perturbe a análise efetuada pelos utilizadores. Posteriormente, será também interessante incorporar múltiplos jogadores em simultâneo (mais do que dois), quer na visualização do mapa, quer nas restantes visualizações. É também necessário abordar os problemas mencionados na utilização do slider que controla o mapa animado, de forma a adaptar de melhor forma a técnica às necessidades dos vários utilizadores. Finalmente, é importante explorar outras formas de gerar as trajetórias dos jogadores que aumentem a precisão das mesmas tendo em conta a informação disponível. Se possível, na ausência da disponibilização de mais informação, seria ideal desenvolver mecanismos que permitissem obter dados que possam ser incorporados no mapa animado de forma a melhorar a análise disponibilizada pelo mesmo.
iv
Palavras-chave: interação pessoa-máquina, dados espácios temporais, técnicas de
vi
Abstract
In recent years, the phenomenon of e-sports has been a growing trend. Consequently, the interest in online video games from both players and spectators has significantly increased, as watching other individuals play has become one of the main sources of entertainment for these groups.
One of the most popular genres in e-sports is the MOBA (Multiplayer Online Battle Arena). Much like in traditional sports, during a match there are various types of events that are of interest for players, spectators, coaches and analysts. These events can range from a player’s position at a given time or the path they took from point A to point B, to more specific game events, such as, the position of a player’s death or the destruction of certain defensive structures.
With the evolution of technology, it has become easier and more common to instrument video game code with telemetry techniques to record these events, which in turn, leads to large volumes of data that can be collected over time. To more effectively and efficiently analyze this data, it is necessary to explore existing and new visualization techniques to understand which are better suited to use in the context of video game analysis.
Previous research reveals that, despite the many different visualization techniques that can be applied, especially to spatio-temporal data, the video game industry barely takes advantage of most of them. However, developers and researchers alike, have started to use some of these techniques, which shows interest in applying them in the context of video game analytics.
The focus of this work consists on taking advantage of the popularity of these video games, combined with the large amount of telemetry data available, to study the use of several visualization techniques, applied in the context of player performance analysis using spatio-temporal and thematic data. For this purpose, the VisuaLeague prototype was developed, which incorporates some visualization techniques, namely animated maps, to allow users to analyze player performance in League of Legends matches. Posteriorly, a study was conducted, aimed at evaluating the techniques used, as well as the role of spatio-temporal data in player performance analysis. The results support the adequacy of using the animated map technique to convey information to users in this context. Moreover, they also point out towards a high degree of importance regarding the spatio-temporal components of the data for player performance analysis.
vii
Keywords: human-computer interaction, spatio-temporal data, visualization techniques,
ix
Contents
Chapter 1 Introduction ... 1 1.1 Motivation ... 1 1.2 Goals ... 2 1.3 Contributions ... 3 1.4 Document Organization ... 3Chapter 2 Related Work ... 5
2.1 Gameplay Data Analysis ... 7
2.1.1 Telemetry in Video Games ... 7
2.1.2 Nature of Video Game Telemetry Data ... 9
2.2 Visualization Techniques in Video Games ... 14
2.2.1 Classification of Visualization Techniques ... 14
2.2.2 Current Directions and Common Techniques ... 17
2.2.3 Comparative Approaches ... 27
2.3 Discussion ... 29
Chapter 3 VisuaLeague ... 31
3.1 League of Legends and Telemetry Data ... 31
3.1.1 Game Description ... 31
3.1.2 League of Legends Telemetry Data... 35
3.2 Analysis of Existing Applications ... 38
3.3 VisuaLeague Prototype... 43
3.3.1 Technologies and Development Process ... 44
3.3.2 Prototype Description ... 45 3.4 Summary ... 52 Chapter 4 Evaluation ... 53 4.1 Informal Interviews ... 53 4.2 User Study ... 54 4.2.1 Participants ... 55
x
4.2.2 Tasks ... 57
4.2.3 Methodology and Apparatus ... 59
4.2.4 Results ... 61
4.2.5 Discussion ... 75
Chapter 5 Conclusions and Future Work ... 79
5.1 Conclusions ... 79
5.2 Future Work ... 80
Glossary ... 82
Appendix A - Questionnaire ... 84
Appendix B – Classification Codes ... 91
xii
List of Figures
Figure 1 – Health and mana bars ... 5
Figure 2 – League of Legends Match History ... 6
Figure 3 – Point-and-click game ... 9
Figure 4 – Game with a complex 3D environment ... 10
Figure 5 - Trajectories for the map "The Edge" ... 12
Figure 6 - Movement of three categories of players ... 13
Figure 7 - Routes taken by avatars ... 14
Figure 8 - Health and ammo bars ... 15
Figure 9 - League of Legends replay system ... 16
Figure 10 - Graph in the post-game lobby of a LoL match ... 18
Figure 11 - League of Legends overhead map of Summoner’s Rift ... 18
Figure 12 - World of Warcraft map ... 19
Figure 13 - Choropleth map with life expectancy for all countries ... 20
Figure 14 - Choropleth map from the game SimCity ... 20
Figure 15 – 2015 LoL World Championship heatmap example ... 21
Figure 16 - CS: GO heatmap example ... 22
Figure 17 - STC of the VisLoL application ... 23
Figure 18 - Spatial animated map that shows change in perspective ... 24
Figure 19 - Temporal animated League of Legends map ... 25
Figure 20 - Overlay analysis ... 27
Figure 21 - Example of a small multiples map visualization ... 28
Figure 22 - Three basic approaches for comparative visualization ... 29
Figure 23 - Example of gameplay in LoL ... 32
Figure 24 - League of Legends map ... 33
Figure 25 - Fog of War example ... 35
Figure 26 - OP.GG's summary of data regarding player performance ... 38
xiii
Figure 28 – Performance data for most frequently played champions ... 40
Figure 29 - LoLKing's radar chart for champion performance analysis ... 40
Figure 30 - LoLKing's player performance chart ... 41
Figure 31 - Champion performance analysis ... 41
Figure 32 - Match History static maps ... 42
Figure 33 – Replay system ... 43
Figure 34 - Overview of the prototype ... 44
Figure 35 – Search page ... 46
Figure 36 - Nodes of the graph ... 47
Figure 37 - Player, structure and global objective representation ... 48
Figure 38 - Event representation using three icons ... 48
Figure 39 - Event representation using two icons ... 49
Figure 40 - Animation controls (zoom of Figure 34 ii)) ... 49
Figure 41 – Gold graph interaction ... 51
Figure 42 - Distribution of participant's ranking ... 55
Figure 43 - Distribution of participant’s preference of role ... 56
Figure 44 - Distribution of participant's experience (in years) ... 56
Figure 45 - Distribution of completion time ... 62
Figure 46 - Distribution of number of actions ... 63
Figure 47 - Distribution of animation speed ... 64
Figure 48 - Distribution of relative play time ... 65
Figure 49 - Averages of the grade attributed on the final questionnaire ... 66
Figure 50 - Top five most frequently used codes in justifications ... 68
Figure 51 - Results of the Spearman's Rank-Order Correlation ... 71
Figure 52 - Distribution of experience for each group ... 72
Figure 53 - Percentage of participants who suggested each design option ... 73
xv
List of Tables
Table 1 - Summary fields ... 36
Table 2 - Event information... 37
Table 3 - Player information ... 37
Table 4 - Event types and extra data fields ... 37
Table 5 - Task order example ... 60
Table 6 - Wilcoxon SRT results for the task completion time ... 62
Table 7 - Wilcoxon SRT results for the number of actions ... 63
Table 8 - Wilcoxon SRT results for animation speed ... 64
Table 9 - Concordance ratios of classifications ... 66
Table 10 - Top role criteria ... 68
Table 11 - Jungle role criteria ... 69
Table 12 - Mid role criteria... 69
Table 13 - ADC role criteria ... 69
Table 14 - Support role criteria ... 70
1
Chapter 1
Introduction
1.1 Motivation
In recent years, the phenomenon of e-sports has been an increasingly growing trend [1, 2]. Not only the amount of people playing the game has increased substantially but, in response to that, well established companies have started to take more interest in investing in this area [3]. In turn, this lead companies, such as Riot Games1 and ESL2,
to create professional leagues that feature tournaments with monetary prizes. These initiatives also provide the opportunity for players to pursue professional careers with a stable source of income. Well-known companies, such as Samsung, even have their own fully sponsored team3. Some of these players even get the chance to pursue a career
related to gaming after they retire from professional play [4]. There are also amateur leagues, such as the one provided by ESL, that any player can join for a chance to win prizes. These leagues can also serve as a starting point for casual players to become professionals, as teams are always interested in recruiting new talents.
With this growth in popularity, not only the number of players has risen but, new groups have emerged that take interest in video games: analysts, coaches and spectators. All these groups have different reasons why they take interest in video games and, as such, they all have different needs when it comes to interacting with video game data.
Similarly to traditional sports, in e-sports there are a great number of spatio-temporal events that are interesting to analyze. These events can range from the position of players at a certain time, or the path they take from point A to point B, to more specific game events like the location of a player’s death or the items bought during a match. The main difference between traditional sports and e-sports is how easy it is to
1 http://www.lolesports.com/en_US/ 2 https://www.eslgaming.com/
2
use telemetry techniques to record data for further analysis [5, 6]. Consequently, this generates a large volume of data that can be used to analyze the performance of players. Nowadays, this analysis is of great importance in both professional and personal contexts. For example, analysts and coaches want to study this data to understand how their team and the opposing teams are playing, in order to identify limitations and create new and improved strategies. On the other hand, players and spectators want to know how their friends and favorite professional players are performing compared to their peers. In addition, these games usually classify their players based on their expected skill. As such, personal improvement is also an important goal for most players, even more casual ones, as they strive to improve their ranking. Professional team owners are interested in player analysis as well, to scout for new members and improve their rosters. From a developer point of view this data can also be of great interest. By analyzing this data, developers can assess their games in respect to game design decisions and their effect on the player base [5–7]. This can help balance out gameplay and aid in keeping the companies much closer to their customers, allowing them to provide a semi-constant stream of new content for players, which in turn makes these more loyal to the game, leading to increased revenues. Although these groups may approach video games differently, evaluating player performance seems to be a common denominator.
With the large amount of data collected via telemetry techniques, it may prove difficult to perform a productive analysis to extract relevant conclusions and patterns. Therefore, it is of extreme importance to understand which visualization techniques are most adequate to apply to the type of information that is being extracted, especially when it comes to spatio-temporal data [5], since not every approach can provide the levels of insight that individuals are seeking. It is then necessary to study which visualization techniques are better qualified to be used with the available data, while at the same time meeting the needs of the groups mentioned earlier, particularly focusing on players.
1.2 Goals
The main goal of this project is to take advantage of the ever-growing telemetry data collected from video games, giving special attention to the spatio-temporal components of this data, to explore visualization techniques that assist players, coaches and analysts on the task of evaluating player performance. The data used to explore these techniques will be from matches of the game League of Legends (LoL) provided through the Riot Games API. This choice is justified by the immense popularity of the game which leads to large quantities of data being constantly generated for analysis. Regular updates to
3
the game contribute to shifts in gameplay and decision making, which also makes frequent analysis yield new and interesting results.
The objective of this approach is to get a better understanding of which visualization techniques are more suited to handle this type of data, while at the same time creating a tool for player performance analysis, that meets the needs of players, and that can easily be adapted to other games of the same genre. This work will also study the importance of the spatio-temporal components of the data when analyzing player performance.
1.3 Contributions
The main contributions of this work can be summarized as following:
• The study and discussion of previous research focused on different types of analysis and visualization techniques, applied in the context of video games, and how these subjects influence the current state of video game analytics, in particular, the analysis of player performance and behavior.
• A prototype, named VisuaLeague, that uses multiple visualization techniques, with a focus on animated maps, to allow users to visualize spatio-temporal and thematic data with the purpose of analyzing player performance.
• A user study that focuses on evaluating the adequacy of the visualization techniques implemented, as well as the importance of spatio-temporal data in the context of player performance analysis.
• An article describing the work developed during this thesis and its objectives for the conference - Encontro Português de Computação Gráfica e Interação (EPCGI) 2017: Pedro Vieira, Tiago Gonçalves, Ana Paula Afonso, Maria Beatriz Carmo. Animated Maps for Analysis of Personal Performance in Games.
1.4 Document Organization
The remainder of this document is organized as follows:
Chapter 2 provides a review and detailed analysis of the relevant existing work in the
literature. In particular, this chapter focuses on the analysis of gameplay data. It describes the current state of telemetry in video games, followed by a presentation of the nature of the data collected through these methods and some of the analysis that can be performed. After that, it focuses on describing the current visualization techniques and approaches employed in the context of video games.
Chapter 3 presents a description of the game League of Legends, as well as a detailed
4
API. After that, it presents an analysis of existing applications directed at analyzing player performance. Lastly, it describes the application developed during this work, VisuaLeague, by presenting the technologies used, as well as the development process. This chapter finishes with a description of all the features of the application.
Chapter 4 presents the evaluation process used to analyze VisuaLeague. More
specifically, it describes the informal interviews conducted and presents the user study that evaluates the visualization techniques developed, and the importance of the spatio-temporal components of the data in the analysis of the performance of players.
Chapter 5 finalizes this document by describing the main conclusions drawn from this
work, presenting also the most promising and challenging research opportunities for future work.
5
Chapter 2
Related Work
Visualization techniques have always been an integral part of video games. They can be observed across all game genres [5, 6, 8, 9], either explicitly implemented in the game itself, much like the well-known health bar (Figure 1), or outside the game environment in more traditional ways, such as plots or maps, as can be seen in various game community dedicated platforms (Figure 2). One important area in which these visualization techniques are applied is the analysis of player behavior and decision making [6, 10, 11]. Behavior can be considered as a successive sequence of actions within a specific context. Understanding the behavior of players, and more importantly the reasons that lead to the actions performed, can be of interest when analyzing game related data. The use of techniques that can incorporate the movement of the players over time, as well as the virtual world that surrounds them, and the interactions with other players, are of special interest when the analysis is focused on player performance and behavior.
Figure 1 – Health and mana bars1
In recent years, the advances in technology have made telemetry techniques more accessible for the collection of gameplay data from any video game [2, 7]. Consequently, this abundance of data, combined with the increased popularity of video games, fostered the interest of players and other individuals to analyze it. Therefore, it is necessary to provide methods that facilitate and improve this analysis, by means of adequate visualization techniques.
6
By itself, an analysis focused on the spatio-temporal components of the data already supports complex types of analyses tasks, such as the study of the players' trajectories, which can, for instance, help understand where and how often a player visited a certain location. However, when combined with thematic data, this analysis can be further expanded, as it can provide additional insights that can help justify the reasons for certain decisions made by players.
Figure 2 – League of Legends Match History1
This chapter outlines the most relevant research done regarding these techniques, especially in the context of video games. The first section covers topics related to game data collected via telemetry. The second section addresses the current directions and
7
common visualization techniques applied in the field of video games, as well as a design framework that can be used to classify any specific visualization technique.
2.1 Gameplay Data Analysis
Gameplay data can be extremely heterogeneous and, thus it can be analyzed using several distinct methods [6, 13, 14]. Gathering this data is an important step in the process of creating visualization techniques. Before the beginning of the design process, the data to be visualized must be carefully analyzed, in order to understand which techniques should be applied. It is also important to take into consideration the target audience so that these techniques can be adjusted to meet their requirements.
2.1.1 Telemetry in Video Games
Telemetry can be defined as the use of various instruments and sensors to remotely collect real-time measurements [6]. With the technological advances over the recent years, the practice of instrumenting the source code of video games with telemetry techniques to obtain gameplay data has become increasingly more common [5, 6]. This opens new possibilities for the assessment of games through the continuous and unobtrusive monitoring of in-game behavior [7].
With the growing popularity of online video games, the number of people interested in the analysis of telemetry data has also increased. On one hand, the developers of a game are interested in how the players are interacting with their game and how they can adapt it to enhance player experience and increase revenues [5–7]. On the other hand, players are increasingly more interested in being a part of gaming communities for competitive multiplayer games, that use statistics and visualizations to allow users to compare their performance with each other, improve their skills and share gameplay experiences [6]. There is also a relatively recent group that has emerged with interest in this data, the spectators. Although this group is mainly constituted of players, its main interests may diverge. Some of them can simply be interested in improving their own gameplay, by learning through the observation of the actions and strategies that professional or other higher ranked players perform, while others are interested in observing other individuals’ gameplay as a recreational activity to pass the time (as one would by watching TV). Be it for learning or leisure, their main activity as spectators is to watch other people play video games: either players sharing their gameplay via platforms, such as Twitch1 or YouTube Gaming2, or live streamed international
professional tournaments [11].
1 https://www.twitch.tv/ 2 https://gaming.youtube.com/
8
Two types of information can usually be collected from gaming sessions: system and player-derived telemetry data [13]. System-derived telemetry is typically used to monitor game systems and to perform network balancing, to improve player experience [13]. Developers are the main group interested in this type of data. Player-derived telemetry is the focus of this work and is typically used by a wide range of individuals. This data contains information about gameplay and the actions taken by the participants of a game.
Depending on the genre, different types of information may be collected: a First-Person Shooter (FPS) game may record information about the weapons used by a player, while a Multiplayer Online Battle Arena (MOBA) game may record information related to the amount of in-game currency a player collected over time. The genre and content of the game dictates what information is present in the recorded telemetry data [6, 15, 16], hence different games will most likely have very distinct data sets. However, some data is generally recorded across most genres, such as the position over time of the in-game representations of the players (commonly known as avatars) or the location of a player’s death.
Among the most interesting and relevant aspects of player-derived telemetry data, most notably in spatio-temporal data, is the ability to evaluate not only the end results of a game or match, but also visualize all of the intermediate states that players experienced [7]. This allows for adoption of innovative approaches using visualization techniques to analyze player experience, performance and struggles.
However, it is also important to note that, when possible, telemetry data should be accompanied by qualitative data to get a better understanding of a player’s experience, since quantitative data may not provide insight into questions such as “is it being fun?” [5]. Furthermore, this qualitative data can help researchers and developers understand what metrics are more important to users, in order to direct visualization techniques at those components of the data to improve the analysis process.
Although most companies still developed their in-house system to precisely meet their requirements, some generic dedicated systems targeted at recording telemetry data have been developed [13, 14, 16]. Either way, these systems must remain as unobtrusive as possible to not disrupt gameplay and thus player experience. It is also important to note that they should be as efficient as possible from a network use standpoint to prevent game lag and disruption. Consequently, developers should aim at implementing telemetry techniques that meet all these requirements, while at the same time recording as much relevant data as possible for analysis.
9
2.1.2 Nature of Video Game Telemetry Data
The complexity of modern video games translates directly into a complex data set that can be extracted from them. This data is usually divided in two categories: spatial data, such as location of a player, and non-spatial data, such as health and in-game currency [13]. This distinction is important as it further emphasizes the importance that movement and position have in games and their analysis. A distinction can also be made in regards to how often a metric is recorded: frequently or event-triggered [5, 7]. A good example of frequently recorded metrics is player position, while collecting an item or killing another player can be considered as an event-triggered metric. Continuously recording spatio-temporal data can be very important as it can provide high detail on player behavior analysis, e.g., create a highly accurate representation of player movement. However, the type of information recorded via telemetry must be carefully selected so it does not result in too much unused data, preventing this way the use of extra resources (network and storage) that could be better applied elsewhere.
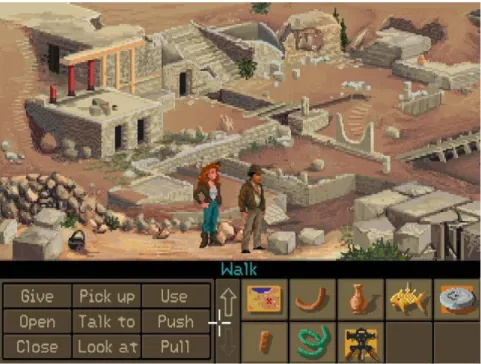
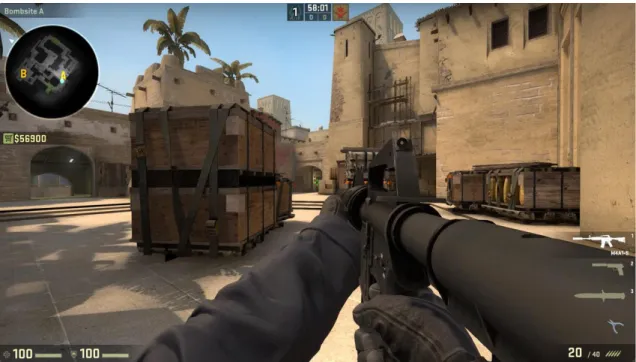
Most, if not all, digital games involve some sort of spatial operation, i.e., some type of movement across a platform or virtual world. These can range from simple point-and-click vector mechanics (Figure 3) to more advanced navigation in 2D/3D environments (Figure 4) [13]; therefore, this dimension is often the target for analysis and evaluation. Since all gameplay occurs over time it is also common to integrate this dimension into the analysis, at least when moving past simple aggregations and visualizations of telemetry data [13].
Figure 3 – Point-and-click game: Indiana Jones and the Fate of Atlantis 1
10
Figure 4 – Game with a complex 3D environment: Counter--Strike: Global Offensive 1
Based on the spatio-temporal data collected, it is possible to answers four types of questions when a player acts: what is happening?; where is it happening?; when is it happening?; and to whom is it happening? [13]. Although these questions can, often, be answered through the analysis of the players’ spatio-temporal locations, they can also benefit from the inclusion of thematic data related to the game, in general, and those locations and events, in particular [13]. For instance, a player might have died in a specific place at a specific point in time, but it might also be of interest to record what killed him, to perform a deeper analysis of the situation and allow for the creation of strategies that can overcome his difficulties.
This spatio-temporal data can be used to perform various types of analysis, such as trajectory analysis [9]. A trajectory consists in the description of the evolution of a moving object’s spatial properties over a period of time [15, 17], for example the navigation of a player through a game level. The analysis of these trajectories consists in the study of the path that a moving object follows through space as a function of time. Nevertheless, it is important to notice that the analysis of any given trajectory can be performed in various ways. For instance, it is possible that the focus of the analysis is the position of the player(s) when certain events happen, as a means of analyzing his/her contribution to that event. On the other hand, it is also possible to focus instead on the sequence of actions performed by the player(s), to extract behavior patterns in certain zones of the map during a specific period [18] .
11
Although they are applied in different contexts, the analysis of the trajectories of players in the virtual world is not completely different from the analysis of the trajectories of humans in the real world [18, 19]. Similarly to a real-world scenario, where monuments can be considered points of interest, in the context of video games, defensive structures or the various jungle monsters can be considered as such as well. A parallelism can also be made between events in the real-world, such as a taxi driver dropping a passenger, or a football player scoring a goal, and events in the virtual environment, such as a character’s death or the destruction of defensive structures. On both analysis, the study of the trajectories of individuals has the potential to extract behavior patterns that are useful to adapt certain paradigms to the requirements of users. Therefore, the results obtained in studies conducted with this data can (and should) be taken into consideration in the context of analyzing video games.
As an example of studies conducted in real-world environments, J. Gudmundsson and T. Wolle [10] created a tool aimed at analyzing the performance of football players. This tool analyzes the trajectories of players to identify the most common movement patterns of a single player or several players, and to analyze those players’ passing ability. Furthermore, it can identify correlations between clusters of trajectories to allow analysts, for instance, to study how units in the team move together, for example, the defensive line, or the left winger and the left defender [10]. P. Coulton et al. [11] also developed a prototype capable of using trajectory analysis to study the behavior of players in a pervasive location-based game inspired by the traditional Pac-Man. The authors were able to use the developed tool to identify different patterns among players filling different roles in the game.
The typical uses of trajectory analysis in the context of video games are illegal bot program detection, group behavior examination and the study of player tactics [13]. It can also help developers understand if players are adapting according to design changes, as well as guide players by allowing them to understand if they are taking optimal paths to achieve the intended goals. Displaying many individual paths can however result in overlapping and visual clutter which, in turn, may hinder the analysis. Therefore it is important to apply appropriate aggregation techniques to facilitate the investigative process [5]. Usually, when analyzing spatio-temporal trajectories, other information, such as health, ammo and interactions with other players, is also displayed alongside the spatio-temporal trajectories to improve this analysis. In Figure 5 we can observe an application of trajectory analysis for illegal bot detection [20]. As the figure suggests, there is a visible difference between the behavior of bot programs ((b), (c) and (d)) and the behavior of human agents ((a)). The former has a tendency to be more predictable and repetitive depending on the purpose of the bot program, whereas the
12
former is more erratic and dispersed, which is comparable to the natural movement of humans.
Figure 5 - Trajectories for the map "The Edge", from the popular FPS game Quake 2, for players belonging to the following categories: (a) human, (b) CR Bot, (c) Eraser Bot, and (d) ICE Bot [20]
The analysis of trajectories, particularly in game environments, has established types of patterns which are indicative of specific trajectory behaviors like tracks, flocks and leadership patterns [13]. A track describes a player having a constant movement in line within a certain area, e.g., a set of players moving on a straight line within a certain area. A flock describes a set of players moving as a unit, in such a way that all the members are within a certain spatial range at each point in time (similarly to a flock of birds). In a leadership pattern, at some point in time, players might join the movement of a leading player. This analysis, when combined with other game thematic data, is capable of revealing the reasons behind these movements patterns. In other words, it allows analysts to study where players travelled to, how they travelled and why they traveled that way.
A relevant example of the aforementioned fact consisted in the study conducted by J. Miller and J. Crowcroft, where data from the game World of Warcraft (WoW) relative to the trajectories taken by avatars in the Arathi Basin battleground was used to analyze player behavior [21]. During this study, spatio-temporal movement data was combined with activity patterns to detect specific strategies within a game. This activity recognition technique can also help detect uncounterable strategies to balance gameplay. The results showed that players who participated in that battleground tend to belong to one of three groups based on their movement patterns and in-game purpose, as exemplified in Figure 6.
13
Figure 6 - Movement of three categories of players in the Arathi Basin battleground: Guard (yellow), Wanderer (grey) and Patroller (green) [21]
Behavioral analytics is an area of research that can take advantage of spatio-temporal data. This category represents a mixture of methods focused on the overall goal of delivering models to describe a set of actions in a certain context [13, 17]. The majority of methods that fall under this category of analysis describe the behavior of game entities in an isolated view, however, most of the relevant actions a player takes are strongly dependent on the behavior of other players and consequently it must also be considered. Drachen et al. [8] utilized telemetry data collected from the MOBA Defense of the Ancients 2 (DotA 2), a game often compared with League of Legends, to characterize relationships between player behavior and ranking in MOBA games. The complexity of this game genre allows for a diverse set of approaches that can be taken towards the recorded data. In this case, the spatio-temporal data analyzed suggests that the behavior of teams is highly related to team skill, e.g., the closer to the professional tier players are, the more likely it is that they focus on staying as a grouped unit to conquer map objectives, while the lower a player is the more he/she values solo play.
K. Samperi et al. also analyzed player behavior by studying how often players respected real life social norms in virtual environments [22]. By analyzing the paths that player avatars used in the Second Life game environment (Figure 7), they noticed that despite there being no downside to stepping on the virtual grass, players avoided doing so, which suggests that personal conventions are unintentionally carried from the real world into virtual environments.
14
Figure 7 - Routes taken by avatars in 2010 on the Hyde Park region of the Second Life game map [22]
In behavior analysis, it is also important to go beyond spatial data, by adding a temporal component, as it can give additional relevant information, e.g., two players can perform the same set of actions in the exact same places but with different speeds, which can be interpreted as two different behaviors (one player being more careless than the other for example).
2.2 Visualization Techniques in Video Games
Visualization techniques have been used in the video game industry for a long time [6]. There exists a diversified number of ways in which these techniques can be used, but not every case takes full advantage of some techniques, or even applies them in the best way possible [6, 21, 23]. Understanding which techniques better fit certain types of data or user is an integral part of developing a good product. This means that before applying these techniques to analyze data, it is crucial to analyze the techniques themselves.
The use of visualization techniques is a common approach both inside and outside the context of video games. This work focuses on the techniques applied in the context of video games. Nevertheless, some of the research done in other areas is taken into consideration since, even though some of the issues may be unique to the context of video games, other challenges may be similar, or even perhaps, the same in other areas dealing with data analysis. Therefore, these contexts must also be explored to further understand how techniques in other areas can be adopted for the analysis of gameplay data.
2.2.1 Classification of Visualization Techniques
Most video games have been using simple representations, such as health bars and overhead maps for a long time. The type of game, and consequently, the type of data
15
collected from the game determines what type of visualization technique must be employed [6]. Other factors, such as the target audience, play an important role in deciding which representations to use: if it is primarily targeted at the gamer community, these visualizations will fall under the topic of casual information visualization. On the other side of the spectrum, if the target audience is the development team, other visualization techniques may be more adequate [6].
Bowman et al. [6] defines a design space of visualization for games. This taxonomy focuses on components that are specific to both games and visualization technologies, hence, other issues, such as data type, utility and visual maps, are not considered. This framework consists of five main categories that can be used to classify any visualization technique found in computer games.
Primary Purpose
This category captures the purpose that made the visualization be created. It can take one of five possible values: Status, Training, Progression, Communication and Debugging and Balancing [6]. Status visualizations transmit important information to the player (typically continuously and in real time). Examples of this type are health bars and ammo counters (Figure 8).
Figure 8 - Health and ammo bars (left and righ) on the popular shooter Overwatch 1
Training visualizations are devised to help players improve their gameplay. This is typically done using replay theaters (Figure 9), where players can watch their own gameplay and identify mistakes, or using visual overlays that can help, for instance, to identify optimal pathing deviation in racing games. Sometimes players are faced with different directions that can be taken to advance in a game and, it is increasingly more common to use visualization techniques to display these options. These representations fall into the category of Progression. Some examples are technology or class trees, present in many RPGs (Role Playing Games), or supply and demand bars in the game SimCity2. As mentioned before, in the recent years, it has become increasingly more
popular to spectate other people’s gameplay as a means of entertainment. Visualization
1 https://playoverwatch.com/en-us/ 2 http://www.simcity.com/
16
techniques that fall into the Communication section are often used in these scenarios. Finally, Debugging/Balancing techniques are also employed by companies to help detect flaws and to balance gameplay for all types of players.
Figure 9 - League of Legends replay system 1
Target Audience
This category represents who is the target audience of the visualization technique: Players, Developers or Observers [6]. The majority visualizations are targeted at Players, as they are the biggest group that interacts with video games. Optimal performance is not always the main purpose of these visualizations and they are often integrated in the game itself. Developers use techniques to analyze telemetry data for debugging, balancing and playtesting. The last group, the Observers, have slightly different needs than the Players and approaches such as highlight reels or animated maps are commonly used to meet their demands.
Temporal Usage
The temporal usage captures the timing aspect of a visualization’s use. Most commonly there is continuous techniques. Traditional cases of this type of visualizations are healthbars and its variations, for example, ammo, power or mana bars, which are characterized by being constantly updated to provide live feedback, and are usually always visible by being integrated in a heads-up display. On the other hand, intermittent techniques are usually hidden and only come up upon being called due to their size or distracting qualities. Retrospective representations are used outside the game in a postmortem fashion, and allow the users to study their performance. Finally, there is
17
Prospective representations that are designed to help the user make predictions about the future. A good example are color-coding techniques on the names of monsters in massively multiplayer online role-playing games to inform the user of the chances of success when battling the enemy.
Visual Complexity
The visual complexity classification captures the level of visual sophistication of a visualization technique, which can be Basic, Intermediate or Advanced. Basic representations are very simple and do not need an advanced degree of visual literacy from the user to understand them. The Intermediate techniques go a little further in complexity and use more advanced mappings that go beyond the standard. Some examples are statistical data graphics and in-game sprites for guidance. Lastly, Advanced techniques require advanced visual language and are more complex. Examples include choropleth maps and diplomacy maps.
Immersion/Integration
It is also important to capture whether the visualization is part of the game application or not and its immersion factor in the game. Visualizations implemented inside the game itself that go hand in hand with the game’s atmosphere can be categorized as Immersive/Integrated. Informative/Integrated representations are also implemented inside the game but provide additional information about the game state that the player’s character would otherwise have no access to inside the game world. Some visual representations can be Immersive/Separate which can allow for interaction with the game world from the outside world. Good examples of this are chat applications that allow players to participate in in-game item auctions using their smartphones. Finally, Informative/Separate techniques are very commonly deployed via the use of APIs to create applications that take advantage of in-game data to display information using various visualization techniques.
2.2.2 Current Directions and Common Techniques
As V. Zammitto mentioned [16], the gaming industry has still yet to grasp everything that visualization techniques can bring to game development and player experience. Certain techniques only work for specific game genres and others can be used across multiple ones. Some are yet to be explored and employed in the context of video games. The current directions, as well as common visualization techniques being applied in spatial game analytics and visualization are outlined below.
Some of the most common visualization techniques employed in the video game industry today can vary from simple graphs and charts (Figure 10), to more complex 2D and 3D maps (Figure 11).
18
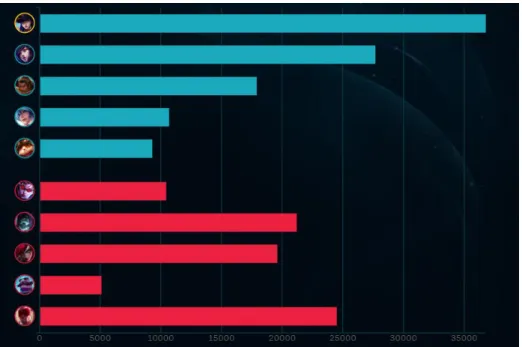
Figure 10 - Graph in the post-game lobby of a LoL match with the total damage dealt by each player1
Because of their simplicity and effectiveness, when applied correctly, graphs, tables and diagrams are some of the most frequently used techniques in the context of video games [5]. Nevertheless, these techniques do not normally allow for spatial analysis, such as trajectory analysis, whereby, visualization techniques that combine the use of a map with the available information, offer a much richer context that a non-spatial analysis will not provide, therefore enhancing the analysis [13].
Figure 11 - League of Legends overhead map of Summoner’s Rift2
One of the simplest approaches to represent data in a map consists in the use of points and/or lines over a geographic area to construct a static map, where each point
1 https://www.leagueoflegends.com 2 http://imgur.com/mAYo45a
19
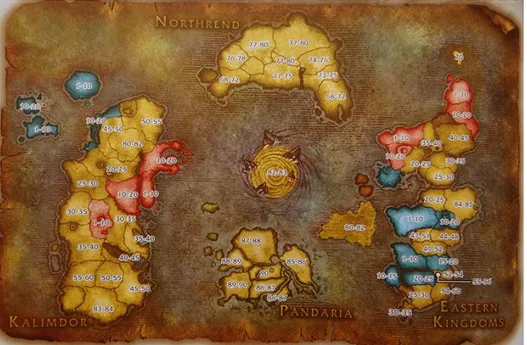
symbolizes a visited location [18]. Other events or information can also be represented using various techniques that may involve the use of different symbols and colors (Figure 12) to easily convey meaning [5, 7, 23]. Some visual properties like color cycling or path thickness can also improve these visualizations by highlighting the temporal component of movement [5]. Choosing the right visual properties to use may be challenging, since some of them are more adequate to represent certain types of data than others, e.g., color hue is typically better suited to represent different categories, while color value is commonly used to transmit the meaning of order [24].
Figure 12 - World of Warcraft map with information about the distribution of enemies1
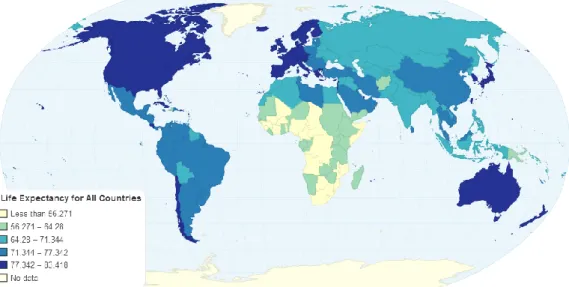
Choropleth maps are another example of a simple approach in which areas of the map are shaded or patterned in proportion to the measurement of the statistical variable being displayed [6]. This technique is widely used in real world applications, for instance, to demonstrate the distribution of life expectancy (Figure 13) for all the countries. In the context of video games, this technique has been used inside the game environment in genres such as CMS (Construction and Management Simulation) and LS (Life Simulation). In these genres, players must have access to the distribution of certain statistical variables, along the virtual playing field, to be able to make decisions that impact their gameplay positively, according to their objectives.
20
Figure 13 - Choropleth map with life expectancy for all countries
Figure 14 demonstrates an example of this technique, applied in the context of video games. This map represents crime distribution in one of the cities of the popular game SimCity1. This choropleth map is supplemented with other visualizations, such as bar
charts and icons, that represent the distribution of criminals and points of interest respectively. The different tones of blue used demonstrate the distribution of police across the visible area, with darker tones representing higher police presence and lighter tones representing lower police presence. An analysis of this map allows players to make decisions regarding which areas of the map are more dangerous and, consequently, which areas need higher police presence.
Figure 14 - Choropleth map from the game SimCity2
1 http://www.simcity.com/
21
Heatmaps are another two-dimensional representation of data in which values are represented by colors overlaid in a map [18, 25]. To generate these, maps are divided under scrutiny into a grid of cells and the events that fall in each cell are used to calculate that cell’s value [13]. Regardless of how easy their creation is, heatmaps require a large amount of data to be useful and can sometimes conceal important information due to design restrictions [5], e.g., a 3D environment being mapped to a 2D heatmap may need to forgo some information such as height. Heatmaps are considered to be very easy to analyze and can provide various types of insights from any variety of data, e.g., analyzing a heatmap that shows the distribution of player’s deaths over a certain area can be useful not only to understand where players die the most, but also what is the impact of different enemies or weapons in different regions of that area [13].
Figure 15 – 2015 LoL World Championship heatmap example1
Figure 15 represents a heatmap based on the League of Legends map (Summoner’s Rift), where the location of scouting units (known as wards) placed by a team during the 2015 World Championship is shown. The analysis of this visualization technique can provide insights into which areas of the map are more prone to be contested in terms of vision control. It can also be used to understand if certain teams have a tendency to focus on some specific zone or objective. Furthermore, this visualization can be used by casual players that want to learn which areas of the map they should focus on controlling more often to improve their performance. These maps can also be used to provide insights into why certain areas of the map are not being used [13], which can help developers balance gameplay to prevent unfair advantages to certain players.
22
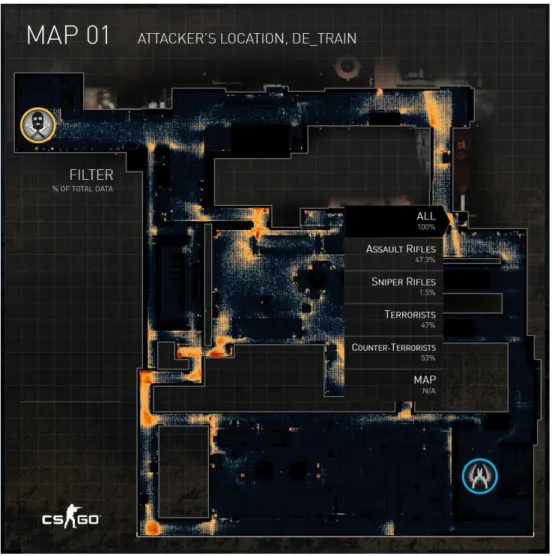
Figure 16 - CS: GO heatmap example1
Figure 16 is another example of the use of heatmaps that shows firing locations for each type of weapon during the beta test of a map of the popular FPS game Counter-Strike: Global Offensive (CS: GO). This approach can be used to understand exactly what areas of the map are not being used and why, e.g., maybe a location is not too favorable to fire from because of the lack of visibility.
The problem of these static map approaches is that they do not allow for a temporal analysis of the data, i.e., it is not possible to analyze the variation of the metric being mapped over time. By adding the temporal dimension, it would be possible to filter information according to specific time intervals to study what happened during different periods of the game. It would also be possible to visualize the evolution of the metric over time, which in turn can enrich the analysis and lead to different, more detailed results. For instance, by analyzing the map in Figure 15, one can only understand which areas of the map were most important in terms of vision control during that match. If the temporal component was added, players could visualize how the areas of focus for this
23
metric varied throughout the game, which can help players understand which zones should be the focus in the earlier stages of the game, and which zones should be focused later in the game.
One interesting approach to map visualization, that combines the use of the temporal dimension, is the Spatial-Temporal Cube (STC). The STC (Figure 17) is a visualization technique that represents both spatial and temporal information within a cube, where the
x-y axes usually represent spatial information (e.g., latitude/longitude), while the z-axis
represents time [26]. Typically, time increases along the z-axis indicating that the higher the information is within the cube, the most recent it is.
Figure 17 - STC of the VisLoL application [18]
This technique has the advantage of presenting a continuous change in time and space, which improves the perception of movement, even when unexpected changes occur [27]. Similarly to static maps, this technique also allows for the incorporation of visual attributes to convey thematic information, as can be seen in Figure 17, where skull symbols denotate a player’s time and place of death. The main aspect that this technique brings to the table, is the integration of the time component with space variables in a single representation, which creates a richer visualization that allows users to evaluate the changes in position of players over time. Consequently, this allows users to understand the impact that the observed actions have in the performance of the players [18]. However, due to their 3D characteristics, the interaction with the STCs can be affected by human perceptual limitations which can cause confusion while using this technique [28]. To minimize these problems, previous studies suggested the use of interactive features, such as changing the point of view within the cube [29] or moving the plane representing spatial information up/downwards, to facilitate locating objects in space and time [30].
24
The animated map is a technique that also combines the spatial and temporal components of data to allow singular images to be reproduced in sequence, supporting the analysis of the variation of player and event location over time [18]. Animated maps display, automatically, a sequence of maps (frames), usually, in a single view, and take advantage of the computer’s capability to rapidly update its contents. These maps have been proposed as an ideal method for learning and scientific discovery because they can explicitly represent dynamic systems and processes [31]. Furthermore, the results of previous studies present in the literature suggest that animated maps allow for more rapid interpretation of spatio-temporal information than do static maps [32].
Map animations can be sub-divided into spatial and temporal animations. Spatial animations are used to demonstrate changes of attributes of a dynamic phenomenon, with no direct relation with world time, such as a change in perspective (Figure 18). On the other hand, temporal animations describe variations on the map following a chronological order (Figure 19), which imply the existence of a direct relation between displayed time and world time [33].
Figure 18 - Spatial animated map that shows change in perspective1
Studies show that animated displays can help reveal spatio-temporal patterns that are not evident with common static representations [34]. Some studies state that animated maps have the potential to be used either for representation of exploration purposes [35]. For representation purposes, animations should be simple enough to properly convey the intended message. For exploration purposes, it is necessary to provide tools that allow the visualization of the spatio-temporal properties of the data in different ways (e.g., different levels of zoom in the map).
25
Figure 19 - Temporal animated League of Legends map with data from 10.000 matches regarding players position at three different times after the game started: (a) 2:15, (b) 12:45 and (c) 30:001
Andrienko et al. [36] identified three variants of animated representations of the movement of objects: snapshot in time, movement history, and time window In the first variant, each map frame only shows the current positions of the objects corresponding to the moment being displayed. In movement history, the routes the objects take from the starting position to the current position are displayed. Consequently, at the end of the animation, the entire routes that the objects travelled will be displayed. The time window variant follows an approach situated between the other two, by having the map show fragments of the routes made during the time interval of a specified duration. The authors also argue that the variant snapshot in time is more suitable for the exploration of the movements of a single object, whereas the variant movement history helps preventing the analysts from losing track of the objects. Lastly, they argue that the last variant is the most convenient for the exploration of object behavior, in terms of speed of movement.
Unlike static approaches, animated maps have an additional dimension that can be used to present information. Consequently, visual variables, similarly to the ones used in STCs, can be applied to represent thematic attributes. However, the amount of data presented increases with the duration of the animation. Furthermore, representing thematic attributes in zones where multiple events occur simultaneously can cause clutter that creates difficulties when analyzing the displayed information. In addition to that, the fact that a frame will not always be visible on the display, may raise some cognitive and perceptual limitations, since the longer the animation lasts the less likely the users are to memorize all relevant information [37]. Therefore, it might be necessary to use approaches that aggregate the information being displayed in the map to prevent the visualization from becoming confusing or obtrusive due to the high amount of data being simultaneously displayed.
![Figure 5 - Trajectories for the map "The Edge", from the popular FPS game Quake 2, for players belonging to the following categories: (a) human, (b) CR Bot, (c) Eraser Bot, and (d) ICE Bot [20]](https://thumb-eu.123doks.com/thumbv2/123dok_br/15676515.1062807/34.892.230.681.183.526/figure-trajectories-popular-players-belonging-following-categories-eraser.webp)
![Figure 6 - Movement of three categories of players in the Arathi Basin battleground: Guard (yellow), Wanderer (grey) and Patroller (green) [21]](https://thumb-eu.123doks.com/thumbv2/123dok_br/15676515.1062807/35.892.292.580.122.446/figure-movement-categories-players-arathi-battleground-wanderer-patroller.webp)