Utility of a novel risk score for prediction of
ventricular tachycardia and cardiac death
in chronic Chagas disease
-the SEARCH-RIO study
P.R. Benchimol-Barbosa
1,2, B.R. Tura
3, E.C. Barbosa
1and B.K. Kantharia
2 1Hospital Universita´rio Pedro Ernesto, Universidade do Estado do Rio de Janeiro, Rio de Janeiro, RJ, Brasil 2University of Texas Health Science Center at Houston, Houston, TX, USA 3Instituto Nacional de Cardiologia, Rio de Janeiro, RJ, BrasilAbstract
The SEARCH-RIO study prospectively investigated electrocardiogram (ECG)-derived variables in chronic Chagas disease (CCD) as predictors of cardiac death and new onset ventricular tachycardia (VT). Cardiac arrhythmia is a major cause of death in CCD, and electrical markers may play a significant role in risk stratification. One hundred clinically stable outpatients with CCD were enrolled in this study. They initially underwent a 12-lead resting ECG, signal-averaged ECG, and 24-h ambulatory ECG. Abnormal Q-waves, filtered QRS duration, intraventricular electrical transients (IVET), 24-h standard deviation of normal RR intervals (SDNN), and VT were assessed. Echocardiograms assessed left ventricular ejection fraction. Predictors of cardiac death and new onset VT were identified in a Cox proportional hazard model. During a mean follow-up of 95.3 months, 36 patients had adverse events: 22 new onset VT (mean±SD, 18.4±4 /year) and 20 deaths (26.4±1.8 /year). In multivariate analysis, only Q-wave (hazard ratio, HR=6.7; P,0.001), VT (HR=5.3; P,0.001), SDNN,100 ms (HR=4.0; P=0.006), and IVET++ (HR=3.0; P=0.04) were independent predictors of the composite endpoint of cardiac death and new onset VT. A prognostic score was developed by weighting points proportional to beta coefficients and summing-up: Q-wave=2; VT=2; SDNN,100 ms=1; IVET++=1. Receiver operating characteristic curve analysis optimized the cutoff value at.1. In 10,000 bootstraps, the C-statistic of this novel score was non-inferior to a previously validated (Rassi) score (0.89±0.03 and 0.80±0.05, respectively; test for non-inferiority: P,0.001). In CCD, surface ECG-derived variables are predictors of cardiac death and new onset VT.
Key words: Chagas heart disease; Noninvasive electrocardiography; Prognostic score; Cardiac death; Ventricular tachycardia
Introduction
Chagas disease is a major cause of cardiomyopathy in Latin America (1-3). It has been estimated that 8 to 10 million people are currently infected by Trypanosoma cruziworldwide, with an overall incidence of 50,000 new cases per year (2). In the USA, up to 120,000 subjects have been estimated to have chronic Chagas disease (2). Sudden ventricular tachyarrhythmias are the main cause of death in Chagas disease (4,5). Although ventricular systolic function plays an important role (6), variables that influence the underlying cardiac electrical activity have relevant prognostic impact in this setting. Within this context, the prognostic significance of the 12-lead resting electrocardiogram (ECG), signal-averaged electrocardiogram (SAECG), and 24-h ambulatory Holter
ECG in Chagas disease have not been adequately investigated.
Variables extracted from surface ECGs, such as abnormal Q-waves, and intraventricular electrical transi-ents in the SAECG, correlate with myocardial fibrosis and conduction abnormalities (7,8). Additionally, autonomic function assessed from the 24-h heart rate variability, and arrhythmias, such as ventricular tachycardia (VT), com-prise a chain of triggers and events that have an impact on risk stratification in Chagas disease (4,5,9).
The objectives of our study were 2-fold. The first was to investigate 12-lead resting ECG, SAECG and 24-h ambulatory ECG in chronic Chagas disease as predictors of a composite of new onset VT and cardiac death. The
Correspondence: P.R. Benchimol-Barbosa, Departamento de Cardiologia, Unidade de Arritimia, Hospital Universita´rio Pedro Ernesto, Boulevard 28 de Setembro, 77, 2o–andar, 20551-900 Rio de Janeiro, RJ, Brasil. E-mail: ecgar@yahoo.com
second was to develop and validate a novel risk stratification score based on noninvasive surface ECGs.
Patients and Methods
Signal-averaged electrocardiogram in Chagas Disease in Rio de Janeiro (SEARCH-RIO) (ClinicalTrials.gov Identifier: NCT01340963) is a single-center longitudinal prospective study that began in 1995, and enrolled 100 consecutive patients (34 to 74 years of age; 32 females) with chronic Chagas disease. All participants had regular follow-up for at least 10 years before admission to the study at the cardiomyopathy outpatient clinic of Pedro Ernesto University Hospital, Rio de Janeiro, Brazil. Chagas disease was confirmed by positive ELISA and indirect immuno-fluorescence hemagglutination tests. Clinical and labora-tory data were assessed during personal interviews and by review of the medical records to exclude potential confounding effects of higher risk conditions. These incuded i) any degree of atrioventricular block or non-sinus rhythm or an implanted cardiac pacemaker, ii) previously documented acute coronary ischemic events, iii) chronic obstructive pulmonary disease, iv) rheumatic valvular heart disease, v) alcohol addiction, vi) thyroid dysfunction, and vii) abnormal serum electrolytes. Exercise treadmill stress tests and/or coronary angiograms were performed when indicated to rule out concomitant coronary artery disease. World Health Organization and Helsinki Treaty regulations were followed.
Clinical follow-up
Patients were followed at outpatient clinic visits scheduled at 3- to 6-month intervals. Appropriate medica-tions such as angiotensin-converting enzyme (ACE) inhibitors, diuretics, vasodilators, and/or beta-blockers were prescribed at the discretion of the physician who performed the primary evaluation. Serum creatinine and potassium values were within the normal ranges. Vaughan-Williams Class III anti-arrhythmic drugs were also prescribed at the discretion of the attending physician. The primary endpoint of the present study was a composite of cardiac death (defined as intractable heart failure, sudden death, or documented arrhythmic death) or new-onset VT (defined as a wide QRS complex duration of .120 ms, three or more consecutive ventri-cular complexes, heart rate .100 bpm, and atrioventri-cular dissociation). The secondary endpoint was either cardiac death or new-onset VT. Symptoms were defined as complaint of palpitations, presyncope or witnessed syncope. The findings of all patient exams were analyzed by independent experts. Adverse events occurring in patients admitted to the hospital were evaluated by review of medical records and active contact with patients and their relatives (see below). No patient was lost during follow-up. Clinical follow-up was ended in December 2012.
Resting surface 12-lead ECG and plain chest roentgenogram
For each patient, standard resting 12-lead ECGs with simultaneous 3-lead digital acquisition were recorded (Cardimax ECAPS 12 2000 Compliant Electrocardiograph, Nihon-Kohden Co., Japan). All the ECG-tracings were analyzed by one expert. If a doubt was raised, a second expert examined the tracing and gave the final interpreta-tion. All measurements of fiducial points, amplitudes and intervals were automated and double-checked by one expert using calipers and a magnifying lens. All initial ECG tracings were of appropriate quality for analysis. Subsequent 12-lead ECG tracings were obtained during follow-up at the discretion of the physician who performed either the outpatient evaluation or assessed the patient during hospital admission as a consequence of an adverse event.
Electrocardiographic abnormalities were classified according to standard criteria (10). A VT episode was defined as the presence of a wide QRS complex with duration of .120 ms, three or more consecutive ventri-cular complexes, a heart rate .100 bpm, and atrioven-tricular dissociation on a long rhythm strip. Abnormal Q-waves were assessed in the anteroseptal leads (V1, V2, and V3 and in the inferior leads (L2, L3, and aVF). The presence of Q-waves in 2 of 3 leads was considered abnormal. Plain chest roentgenograms were performed on the same day as the ECGs. Cardiomegaly was defined by a cardiothoracic ratio.0.50.
M-mode/2-D echocardiogram
All echocardiograms were performed by one expert using standard procedures for echocardiographic meas-urements as recommended by current guidelines. All were assessed for quality and for providing a good window for analysis. As the measurements were made, an onscreen quality assessment was performed, to assure reproduci-bility of all echocardiographic measurements. During follow-up, exams were requested at the discretion of the physician who performed the clinical evaluation and were performed by an expert using standard procedures. The echocardiograms were analyzed with special care taken to detect left ventricular apical aneurysms (6), left ventricular ejection fraction (LVEF) calculated by the Teichholz method, left atrial diameter, left ventricular end systolic diameter and diastolic dysfunction. Abnormal values for LVEF were,50%.
24-h ambulatory ECG monitoring
The standard deviation of all consecutive normal RR intervals in the 24-h period (24-h SDNN) was used to assess heart rate variability, and considered abnormal if,100 ms (9). Ambulatory ECGs were performed at the discretion of the attending physician in order to assess cardiac rhythm and arrhythmia. One trained specialist analyzed all tape recordings immediately after their acquisition.
SAECG
SAECGs were acquired using modified-XYZ Frank orthogonal leads and QRS-triggered coherent-averaged up to the noise level of 0.3mV. Time domain analysis was
carried out on vector magnitude (VM), using a bidirec-tional 4th order 40 to 250 Hz band-pass Butterworth filter. VM-filtered QRS complex duration (DUR, ms) was abnormal if.150 ms (7,11).
The onset and offset points of VM delimitated the analytic region for frequency domain analysis, by using a well-validated spectral turbulence analysis technique (7,12-15). The analytic region was preprocessed and cut into regularly spaced time segment slices to build a power spectral density time-frequency map using Fourier trans-form. Spectral turbulence was studied by comparing sequential spectral estimates (12).
Based on our hypothesis, the presence of high frequency interventricular electrical transients (IVET++), representing underlying electrically unstable myocardial areas, would reduce the similarities between adjacent spectral estimates (intersegment spectral correlation) and also increase their energy content (frequency edge track), determining turbulence (12,13).
Evaluation of adverse events
VT episodes were evaluated by demonstrating three or more rapid consecutive ventricular ectopic beats in either a 24-h ambulatory ECG or a 12-h lead ECG (see below), assessed during either outpatient clinical or in-hospital admission as a consequence of an adverse event. Those patients complaining of palpitations, dizziness or sudoresis associated with cold skin, and in whom a VT run was not subsequently demonstrated in repeated ECG exams, were considered as not having a VT. If indicated, additional medical assessment was carried out by the patients’ health care professionals, and patients continued to be followed by the study team.
Evaluation of cardiac death events was carried out by reviewing either medical records or death certificates. Active contact with first-degree relatives was carried out annually, and allowed us to determine whether patients were alive or not, and whether they had been admitted to a hospital prior to death. Sudden or non-sudden death events from cardiac causes were included in the analysis.
Study variables
The following variables were assessed as predictors for the composite endpoint: i) Q-wave, ii) LVEF,50%, iii) VT,
iv) 24-h SDNN,100 ms, v) DUR.150 ms, and vi) IVET++.
Statistical analyses
Categorical variables are reported as ratios or percentages, and continuous variables as means±SD. The significance of baseline differences was determined for categorical variables by either Yates-corrected chi-square or Fisher exact tests. Continuous variables were tested for normality and compared by either the non-paired Studentt-test or the Mann-Whitney test.
In univariate analyses, the hazard ratio (HR) and respective 95% confidence interval (CI) were calculated with the Cox proportional hazard regression model. Selected variables in univariate analysis were entered in a stepwise multivariate Cox proportional hazard model to determine independent contributions of predictors for the primary endpoint. Variables with a P value .0.05 were excluded from the final model. Thus, the final multivariate model included only significant variables. Correlation analysis assessed interactions between variables. The proportional hazard assumption was tested by correlation analysis between weighted Schoenfeld residuals and transformed survival time.
A practical score was developed by weighting vari-ables retained with respective b coefficients in the multivariate model, rounded to the nearest integer. Risk score summed-up variable weights. Optimal cutoff (lowvs
high) risk categories for the novel score was optimally defined by receiver operating characteristic (ROC) curve analysis using the weight of each individual variable. The procedure was employed each time the ROC curve analysis was performed.
Validation of the model was carried out by two different bootstrap procedures. In the first procedure, 10,000 uniform re-samples were drawn with replace-ment, and prediction accuracy of the novel score was examined by calculating average bootstrap ROC curves and testing for non-inferiority to a previously validated (i.e., Rassi) risk score (16). In the second test-validation procedure analysis, the study population was divided into test (T1) and validation (T2) groups in a 2:1 ratio and 1000 uniform random non-replacement samplings were carried out. For each sampling configuration, a novel score was repeatedly calculated in the T1 group and tested over the T2 group. Overfitting was assessed as the difference of average C-statistic between T1 and T2. It was hypothesized that, if the model was over-fit, the C-statistic in T1 (where the score was calculated) would be much higher than in T2 (where the score was only tested). The ROC curve and respective C-statistic were calculated for each re-sample configuration in both T1 and T2. The novel and Rassi scores in T2 were compared.
Alpha error level was set at 0.05. The software packages used for data analysis were MS Excel 2007 (Microsoft Corporation, USA), Medcalc version 9 (Medcalc Software, Belgium), and R Project 2.9.0 (The R Foundation for Statistical Computing, USA).
Results
Demographics
The clinical, echocardiogram, 12-lead resting ECG, 24-h ambulatory monitoring ECG, and SAECG variables
grouped according to outcomes are reported in Table 1. On admission, all patients were in New York Heart Association (NYHA) functional class I or II and in normal sinus rhythm. Furthermore, no patients had echocardio-graphic evidence of thrombus in either atria or ventricles upon admission.
Clinical follow-up
During a follow-up period of 95.3±31 months (range 6 to 140 months), 22 patients developed new onset VT (incidence, 18.4±4 /year) and 20 patients died (rate,
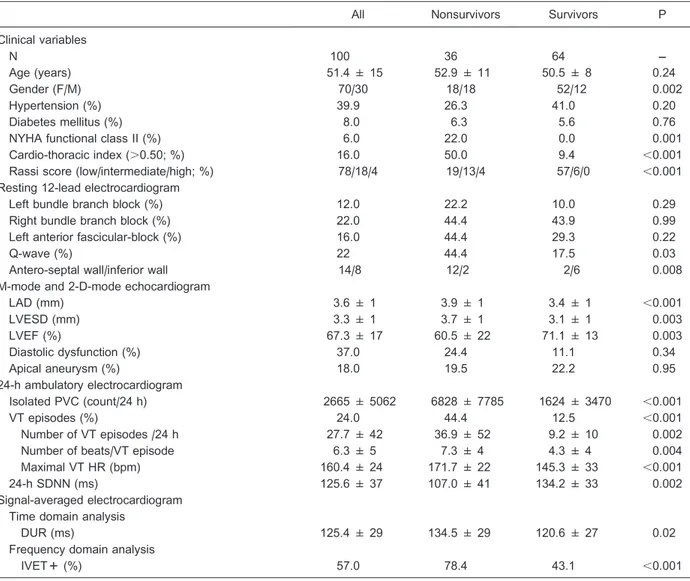
Table 1.Clinical, electrocardiographic, and echocardiographic variables determined on admission as a function of clinical outcome during follow-up.
All Nonsurvivors Survivors P
Clinical variables
N 100 36 64 ––
Age (years) 51.4 ± 15 52.9 ± 11 50.5 ± 8 0.24
Gender (F/M) 70/30 18/18 52/12 0.002
Hypertension (%) 39.9 26.3 41.0 0.20
Diabetes mellitus (%) 8.0 6.3 5.6 0.76
NYHA functional class II (%) 6.0 22.0 0.0 0.001
Cardio-thoracic index (.0.50; %) 16.0 50.0 9.4 ,0.001
Rassi score (low/intermediate/high; %) 78/18/4 19/13/4 57/6/0 ,0.001
Resting 12-lead electrocardiogram
Left bundle branch block (%) 12.0 22.2 10.0 0.29
Right bundle branch block (%) 22.0 44.4 43.9 0.99
Left anterior fascicular-block (%) 16.0 44.4 29.3 0.22
Q-wave (%) 22 44.4 17.5 0.03
Antero-septal wall/inferior wall 14/8 12/2 2/6 0.008
M-mode and 2-D-mode echocardiogram
LAD (mm) 3.6 ± 1 3.9 ± 1 3.4 ± 1 ,0.001
LVESD (mm) 3.3 ± 1 3.7 ± 1 3.1 ± 1 0.003
LVEF (%) 67.3 ± 17 60.5 ± 22 71.1 ± 13 0.003
Diastolic dysfunction (%) 37.0 24.4 11.1 0.34
Apical aneurysm (%) 18.0 19.5 22.2 0.95
24-h ambulatory electrocardiogram
Isolated PVC (count/24 h) 2665 ± 5062 6828 ± 7785 1624 ± 3470 ,0.001
VT episodes (%) 24.0 44.4 12.5 ,0.001
Number of VT episodes /24 h 27.7 ± 42 36.9 ± 52 9.2 ± 10 0.002
Number of beats/VT episode 6.3 ± 5 7.3 ± 4 4.3 ± 4 0.004
Maximal VT HR (bpm) 160.4 ± 24 171.7 ± 22 145.3 ± 33 ,0.001
24-h SDNN (ms) 125.6 ± 37 107.0 ± 41 134.2 ± 33 0.002
Signal-averaged electrocardiogram Time domain analysis
DUR (ms) 125.4 ± 29 134.5 ± 29 120.6 ± 27 0.02
Frequency domain analysis
IVET++ (%) 57.0 78.4 43.1 ,0.001
26.4±1.8 /year). Four patients (20%) experienced sud-den unexpected death recorded at a mean 56.3±10.0 months after admission. Two were females (47±4 years old), all were in class I NYHA at their last clinical visit, all had bundle branch block, and their mean LVEF was 68±3.5%.
Univariate analyses of resting 12-lead ECG, echocardiogram, 24-h ambulatory monitoring ECG and SAECG as predictors of composite endpoint
Univariate analyses of significant variables are sum-marized in Table 1. The prevalence of systemic arterial hypertension and use of ACE inhibitors, beta-blockers and diuretics did not differ significantly among those who experienced (26.3%) and did not experience (41.4%; P=0.20) the predefined study endpoints. Subjects who achieved composite endpoints had a higher use of Class III Vaughan-Williams anti-arrhythmic drugs (84%) than those who did not (16%; P,0.001). At the end of follow-up, amiodarone was used by 87% and sotalol by 13% of the study participants (P,0.001). Two patients had an ICD and 1 had a CRT pace-maker implanted; all were alive in December 2012.
A univariate Cox proportional hazard regression model of selected variables as predictors for composite endpoint showed the following results (Figure 1A-F): 1) 12-lead resting ECG: Q-wave (HR=2.9; 95%CI=1.5-5.8; P=0.002); Q-waves in the anterior-septal leads were significantly associated with the composite endpoint as compared with Q-waves in the inferior leads (HR=18.0; 95%CI=2.0-161.1; P=0.01); 2) echocardiogram: LVEF,50% (HR=3.4; 95%CI=1.7-4.1; P,0.001); 3) 24-h ambulatory ECG: VT (HR=3.6; 95%CI=1.7-7.1; P,0.001) and SDNN,100 ms (HR=4.1; 95%CI=1.8-8.8; P,0.001); 4) SAECG: DUR.150 ms (HR=3.0; 95%CI=1.5-5.9; P=0.002) and IVET++ (HR=4.0; 95%CI=1.8-9.3; P,0.001).
Proportional hazard assumption was preserved in all univariate Cox models.
Multivariate analysis and clinical score development
Multivariate analysis results are summarized in Table 2. Univariate predictors of composite endpoint were entered into a multivariate Cox proportional hazard regression model. In a two-by-two interaction analysis, inter-variable correlation was nonsignificant for all comparisons. The proportional hazard assumption was preserved in the multivariate model (global proportionality assumption test:
x2=0.76; P=0.94).
In a stepwise multivariate Cox model, four significant variables were retained: Q-wave, VT, IVET++, and SDNN,100 ms. The ratio of the number of variables retained in the final model to the number of outcomes was 4:36, yielding an overall ratio of 1:9.
To compose a prognostic score, beta coefficients were rounded to the nearest integer and weights were
assigned to the variables as follows: Q-wave=2; VT=2; IVET++=1, and SDNN,100 ms=1. A practical novel risk score ranging from zero to the highest possible score of 6 was thus constructed.
In the ROC curve analysis, the optimal cutoff value of the novel score was calculated at.1, showing 77% sensitivity and 83% specificity (C-statistic, 0.89±0.03; P,0.001). High risk was defined as.1 and low risk for all others.
A Cox proportional hazard model and adjusted Kaplan-Meir curves of the novel score system for composite endpoint is presented in Figure 1G. Hazard ratios for current novel and Rassi scores according to follow-up time are reported in Table 3. The hazard ratios of novel and Rassi scores for VT and cardiac death assessed separately are reported in Table 4.
Regarding sudden death events, those who experi-enced sudden death showed a significantly higher novel score than those who experienced non-sudden death (5.0±1.2 vs 2.6±1.2, respectively; P=0.004). Conversely, no significant difference in average Rassi score was observed between those who experienced sudden vs non-sudden death (7.5±1.2 vs 8.2±3.6, respectively; P=0.47).
Post hocbootstrap evaluation
In 10,000 bootstrap re-samplings, adjustment of the multivariate Cox proportional hazard model was trivial for all endpoints, and the Wald test was significant in all re-samplings. ROC curves for novel and Rassi scores as predictors for composite endpoint are presented in Figure 2. The average C-statistic of the novel score (0.89±0.03) showed a superior prognostic performance to the Rassi score (0.80±0.05; test for non-inferiority: P,0.001; test for superiority: P,0.01) for the composite endpoint.
In test-validation procedures, adjustment of the multi-variate Cox proportional hazard model was trivial for all endpoints, and the Wald test was significant in all re-samplings. No significant differences in C-statistic between T1 and T2 procedures in all outcomes were seen in novel scores, indicating no over-fitting. Likewise, no significant differences were observed in Rassi scores. In T2 analysis, ROC C-statistic for cardiac death and for VT of the novel score (0.92±0.07 and 0.74±0.09, respectively) were non-inferior to Rassi score (0.81±0.12, P,0.001, and 0.63±0.10, P,0.001, respectively). For the composite endpoint, average C-statistic of the novel score was non-inferior to the Rassi score (0.89±0.05 and 0.79±0.09, respectively; P,0.001). Results of validation (T2) group analyses are presented in Table 5.
Discussion
previous VT episodes, 24-h SDNN,100 ms and IVET++) are independent predictors of adverse outcome defined as cardiac death and new onset ventricular tachycardia. Adjustment of the Cox proportional hazard model for ECG-derived variables allowed for development of a novel score. Chagas disease is a heterogeneous medical
condition with an uneven clinical course, and the application of a risk stratification score in clinical practice might help optimize medical and interventional therapies in this setting (11,16-18).
autonomic markers of cardiac abnormality carry a relevant amount of risk in Chagas disease. According to the Chagas heart disease model, subjects with preserved left ventricular function continue to be at a considerably high risk of death due to arrhythmia, which accounts for up to 78% of all deaths (17,19-21). Thus, it would be expected that a large proportion of the risk for adverse events might be disregarded if only markers of left ventricular dysfunc-tion are taken into account as mainstream prognostic markers. This was confirmed in the present study, because subjects who had sudden death also had normal LVEF and a higher novel score than those who experienced non-sudden death.
In a previous publication (16), the markers for adverse
outcome included in a risk stratification (Rassi) score were left ventricular dysfunction, a low NYHA function class, large left ventricular end-diastolic diameter, segmental or global wall motion abnormalities and cardiomegaly; LVEF was not documented (16). In the present study, the novel score had a 10-11% greater average prognostic accuracy for cardiac death, new onset VT and the composite of both than the Rassi score (Table 5). Furthermore, the Rassi scores of subjects who experienced sudden death were not significantly different from the scores of those who experienced non-sudden death, indicating that electrical markers may have a particular place for risk stratification in this population.
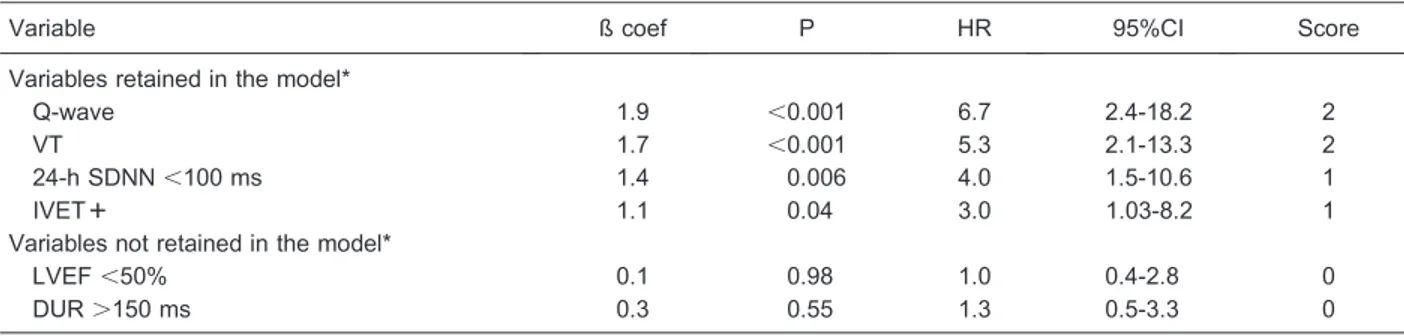
SAECG has been used to investigate abnormal Table 2. Stepwise multivariate Cox proportional hazard regression model analysis for composite endpoint.
Variable ß coef P HR 95%CI Score
Variables retained in the model*
Q-wave 1.9 ,0.001 6.7 2.4-18.2 2
VT 1.7 ,0.001 5.3 2.1-13.3 2
24-h SDNN,100 ms 1.4 0.006 4.0 1.5-10.6 1
IVET++ 1.1 0.04 3.0 1.03-8.2 1
Variables not retained in the model*
LVEF,50% 0.1 0.98 1.0 0.4-2.8 0
DUR.150 ms 0.3 0.55 1.3 0.5-3.3 0
ß coef: coefficient estimate of the variable; HR: hazard ratio; CI: confidence interval; Q-wave: pathological Q-wave on surface ECG; LVEF: left ventricular ejection fraction; VT: ventricular tachycardia (.3 consecutive PVCs, heart rate.100 bpm, AV dissociation); 24-h SDNN: 24-h standard deviation of consecutive normal RR intervals; DUR: time domain filtered-QRS duration; IVET++: positive interventricular electrical transient (short-time Fourier transform mapping of the QRS complex; for details see Ref. 12). Risk score: sum of individual score weights; maximal score=6. * According to stepwise multivariate modeling conditions (see text for details).
Table 3. Comparison of prognostic value of the novel scorevsRassi score for primary (composite) endpoint according to follow-up time.
Variable Event probability (%; 95%CI) ß coef P HR 95%CI
Novel score At 50 months
Low risk score 2.3 (0.1-12.0)
High risk score 19.3 (9.6-34.5) 1.9 ,0.001 6.9 2.9-16.4
At 120 months
Low risk score 16.3 (6.6-33.5)
High risk score 50.9 (34.1-73.1) 2.0 ,0.001 7.7 3.2-18.6
Rassi score At 50 months
Low risk score 3.8 (0.8-11.2)
Intermediate risk score 42.1 (18.2-83.0) 1.6 ,0.001 5.0 2.5-10.1
High risk score 50 (6.1-100) 2.1 0.0002 7.9 2.7-23
At 120 months
Low risk score 28.2 (17.7-42.7)
Intermediate risk score 57.9 (28.9-100) 1.7 ,0.001 5.5 2.7-11
High risk score 75 (15.4-100) 2.8 ,0.001 16.5 5.3-51
electrical transients in surface ECGs, which are considered harbingers of abnormal histopathology underlying ventri-cular arrhythmia and sudden death (11,12,22,23). In Chagas disease, fibrosis and inflammation are associated with worsening of left ventricular function, and life threatening arrhythmia may eventually supervene (24). In time domain analysis, SAECG QRS complex duration has been considered an important risk stratification tool, limited only by the presence of bundle branch blocks (22,25). On the other hand, rather than only looking at frequency components, spectral turbulence analysis sweeps through ventricular activation looking for breaches in frequency components distribution over time, i.e., IVETs, which are commonly associated with abnormal intra-myocardium
conduction delays (12,13,22). Ribeiro et al. (11) analyzing SAECG in time domain found that a long-duration QRS complex was an independent predictor for adverse events in Chagas disease. In the present study, however, we found IVET++ to be an independent predictor for adverse events, whereas a long-duration QRS complex was not an independent predictor in the presence of IVET++ and other variables.
Surface resting 12-lead ECG has been a useful prognostic evaluation tool in Chagas disease (16,26-28). Abnormal Q-wave is a marker of underlying myocardial fibrosis, and has been considered a sign of poor prognosis in Chagas disease-associated cardiomyopathy (26-28). We found that abnormal Q-waves were an independent predictor of adverse events and was assigned a high weight in the novel score. Additionally, Q-waves arising from the anteroseptal wall significantly and positively correlated with both abnormal motion of the anterior wall and a larger left ventricular end-systolic diameter (data not shown), indicating that they can be regarded as surrogate markers of impaired left ventricular function in Chagas heart disease, as reported by other authors (26).
Cardiac arrhythmias in Chagas disease, particularly VT, have been considered a harbinger of poor prognosis. We also found that VT was a strong independent predictor for adverse events in the long term, corroborating previous findings (16,29-31). Furthermore, we observed that VT episodes were more frequent in 24 h, had a longer sequence of ventricular ectopic beats and were faster in non-survivors than in survivors (Table 1).
Increased sympathetic and decreased vagal activ-ities reduce heart rate variability and are associated with a propensity for life-threatening arrhythmia (9). Heart rate variability is reduced in Chagas disease even in subjects with preserved left ventricular function, and seems to be related to auto-antibodies directed against ß-adrenoreceptors and M2 muscarinic receptors, usually preceding dysfunction (16,32-37). Twenty-four-hour SDNN is a simple overall measure of autonomic control of the heart, which is reduced in patients with Chagas disease (16,38-40). Rassi Jr. et al. (16) found that 24-h SDNN,100 ms was a univariate predictor for adverse outcome in Chagas disease, but the authors did not include this variable in their risk score. On the other hand, we showed that 24-h SDNN,100 ms was an independent long-term predictor of adverse events.
The practical risk score that we developed allowed us to identify those patients with Chagas disease at increased risk of cardiac death and new onset VT, indicating that noninvasive ECG monitoring may play a key role in risk stratification of this population when compared to other, conventional indices.
Limitations of the study
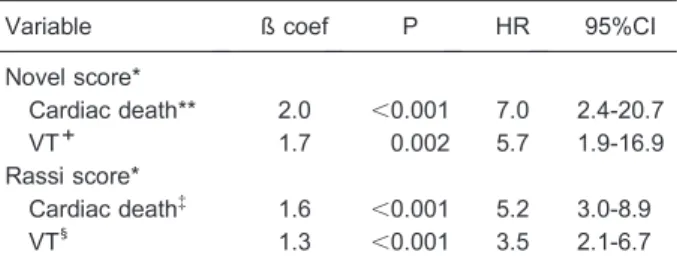
The study cohort consisted of patients referred to a single center. The adverse events were not assessed by Table 4.Cox proportional hazard model analyses of novel and
Rassi scores for cardiac death and VT endpoints, assessed separately.
Variable ß coef P HR 95%CI
Novel score*
Cardiac death** 2.0 ,0.001 7.0 2.4-20.7
VT+ 1.7 0.002 5.7 1.9-16.9
Rassi score*
Cardiac death{ 1.6 ,0.001 5.2 3.0-8.9 VT1
1.3 ,0.001 3.5 2.1-6.7
*Scores analyzed as continuous variables. **Proportionality assumption test: rho=0.23; P=0.31;+proportionality assump-tion test: rho=-0.13; P=0.54;{proportionality assumption test: rho=0.20; P=0.46;1
proportionality assumption test: rho=0.25; P=0.28. ß coef: coefficient estimate of the variable; HR: hazard ratio; CI: confidence interval; VT: ventricular tachycardia.
third parties or independent investigators, which might be a limitation. Although cardiac death was evaluated by review of medical records and contacting close relatives, we did not have access to all death certificates, which was a limitation. In four cases, although we excluded external, violent cause of death, we could not precisely define the cause of death. Those deaths were considered to be of cardiac cause in a worse case scenario, taking into account the patient’s preceding clinical condition. The score in this study was developed over a composite of cardiac death and new onset VT endpoints, and was verified for all adverse outcomes using a classic bootstrap test-validation procedure. A large study population and independent cohort may be necessary to further validate the score. Nevertheless, considering the strict follow-up, the number of adverse outcomes related to predefined endpoints, and overall statistical significance, the present findings are consistent and highly promising. During follow-up, 24-h ambulatory ECG was performed at the discretion of the attending physician. This may represent a selection bias since more symptomatic subjects may be over represented, potentially leading to misclassification bias of VT outcomes. The use of signal-averaged and 24-h ambulatory electrocardiograms stratification tools may depend on their availability in reference healthcare centers. Finally, assessment of the benefit of anti-arrhythmic drugs regimen, CRT-pacemakers and ICDs in this population were not the aim of the study. Therefore,
the validity of the current score as a screening tool for either anti-arrhythmic drugs indication or device implanta-tion awaits confirmaimplanta-tion.
Conclusion
In chronic Chagas disease, the presence of abnormal Q-waves in a resting surface ECG, previous episodes of ventricular tachycardia, low heart rate variability, and high spectral turbulence in SAECG are predictors of cardiac death and new onset ventricular tachycardia. A novel risk score based on surface ECG-derived predictors may improve prognostic assessment in this population.
Acknowledgments
We wish to express our thanks to Dr. Marcia Bueno Castier, Dr. Adriano Moraes and Dr. Paulo Ginefra for carrying out echocardiographic and electrocardiographic evaluations with great dedication, and to Dr. Francisco Manes Albanesi Filho (in memoriam) for his support in the follow-up of the patients. We especially wish to thank Dr. Jose´ Barbosa Filho, former full professor of cardiology, for his insights and support. All of the above are from Universidade do Estado do Rio de Janeiro. Research partially supported by Faculdade de Cieˆncias Me´dicas, Universidade do Estado do Rio de Janeiro (Grant#5152/ 2001), Rio de Janeiro, RJ, Brazil.
References
1. Maguire JH, Hoff R, Sherlock I, Guimaraes AC, Sleigh AC, Ramos NB, et al. Cardiac morbidity and mortality due to Chagas’ disease: prospective electrocardiographic study of a Brazilian community. Circulation 1987; 75: 1140-1145, doi: 10.1161/01.CIR.75.6.1140.
2. Rassi A Jr, Rassi A, Marin-Neto JA. Chagas disease. Lancet 2010; 375: 1388-1402, doi: 10.1016/S0140-6736(10)60061-X.
3. Marin-Neto JA, Rassi A Jr. Update on Chagas heart disease on the first centenary of its discovery. Rev Esp Cardiol 2009; 62: 1211-1216, doi: 10.1016/S0300-8932(09)73071-4.
4. Marin-Neto JA, Cunha-Neto E, Maciel BC, Simoes MV. Pathogenesis of chronic Chagas heart disease.Circulation 2007; 115: 1109-1123, doi: 10.1161/CIRCULATIONAHA.
106.624296.
5. Bestetti RB, Dalbo CM, Arruda CA, Correia FD, Freitas OC. Predictors of sudden cardiac death for patients with Chagas’ disease: a hospital-derived cohort study.Cardiology1996; 87: 481-487, doi: 10.1159/000177142.
6. Acquatella H. Echocardiography in Chagas heart disease. Circulation2007; 115: 1124-1131, doi: 10.1161/CIRCULA TIONAHA.106.627323.
7. Benchimol-Barbosa PR, Muniz RT. Ventricular late potential duration correlates to the time of onset of electrical transients during ventricular activation in subjects post-acute myocardial infarction.Int J Cardiol2008; 129: 285-287, doi: 10.1016/j.ijcard.2007.05.057.
8. Beauregard LA, Waxman HL, Volosin R, Volosin KJ, Kurnik PB. Signal-averaged ECG prior to and serially after Table 5. Receiver operating characteristic curve bootstrap procedure of the novel score compared to the Rassi score as predictors of composite, cardiac death and ventricular tachycardia (VT) outcomes in the validation group (T2).
Outcomes Cardiac death and VT (composite) Cardiac death Ventricular tachycardia
C-statistic
Novel score 0.89 ± 0.05* 0.92 ± 0.07* 0.74 ± 0.09*
Rassi score 0.79 ± 0.09 0.81 ± 0.12 0.63 ± 0.10
thrombolytic therapy for acute myocardial infarction.Pacing Clin Electrophysiol1996; 19: 883-889, doi: 10.1111/j.1540-8159.1996.tb03383.x.
9. Task Force of the European Society of Cardiology and the North American Society of Pacing and Electrophysiology. Heart rate variability. Standards of measurement, physiolo-gical interpretation, and clinical use.Eur Heart J1996; 17: 354-381, doi: 10.1093/oxfordjournals.eurheartj.a014868. 10. Garzon SA, Lorga AM, Nicolau JC. Electrocardiography in
Chagas’ heart disease.Sa˜o Paulo Med J1995; 113: 802-813, doi: 10.1590/S1516-31801995000200011.
11. Ribeiro AL, Cavalvanti PS, Lombardi F, Nunes MC, Barros MV, Rocha MO. Prognostic value of signal-averaged electro-cardiogram in Chagas disease.J Cardiovasc Electrophysiol 2008; 19: 502-509, doi: 10.1111/j.1540-8167.2007.01088.x. 12. Kelen GJ, Henkin R, Starr AM, Caref EB, Bloomfield D,
el-Sherif N. Spectral turbulence analysis of the signal-averaged electrocardiogram and its predictive accuracy for inducible sustained monomorphic ventricular tachycardia. Am J Cardiol 1991; 67: 965-975, doi: 10.1016/0002-9149(91)90169-L.
13. Barbosa EC, Benchimol-Barbosa PR, Ginefra P, Albanesi Filho FM. [High resolution electrocardiogram in frequency domain. Use of statistical techniques of spectral correlation for identification of patients with sustained monomorphic ventricular tachycardia]. Arq Bras Cardiol 1998; 71: 595-599, doi: 10.1590/S0066-782X1998001000007.
14. Benchimol-Barbosa PR, Nasario-Junior O, Nadal J. The effect of configuration parameters of time-frequency maps in the detection of intra-QRS electrical transients of the signal-averaged electrocardiogram: impact in clinical diag-nostic performance. Int J Cardiol 2010; 145: 59-61, doi: 10.1016/j.ijcard.2009.04.013.
15. Kautzner J, Kulakowski P, Hnatkova K, Staunton A, Malik M. Long-term reproducibility of individual indices of time-domain analysis, spectral temporal mapping, and spectral turbulence analysis of signal-averaged ECGs. J Electrocardiol1993; 26 (Suppl): 129-136.
16. Rassi A Jr, Rassi A, Little WC, Xavier SS, Rassi SG, Rassi AG, et al. Development and validation of a risk score for predicting death in Chagas’ heart disease.N Engl J Med 2006; 355: 799-808, doi: 10.1056/NEJMoa053241. 17. Ribeiro AL, Nunes MP, Teixeira MM, Rocha MO. Diagnosis
and management of Chagas disease and cardiomyopathy. Nat Rev Cardiol 2012; 9: 576-589, doi: 10.1038/nrcardio. 2012.109.
18. Viotti R, Vigliano C, Lococo B, Bertocchi G, Petti M, Alvarez MG, et al. Long-term cardiac outcomes of treating chronic Chagas disease with benznidazole versus no treatment: a nonrandomized trial.Ann Intern Med2006; 144: 724-734, doi: 10.7326/0003-4819-144-10-200605160-00006. 19. Bestetti RB, Freitas OC, Muccillo G, Oliveira JS. Clinical
and morphological characteristics associated with sudden cardiac death in patients with Chagas’ disease.Eur Heart J 1993; 14: 1610-1614, doi: 10.1093/eurheartj/14.12.1610. 20. Rassi A Jr, Rassi SG, Rassi A. Sudden death in Chagas’
disease. Arq Bras Cardiol 2001; 76: 75-96, doi: 10.1590/ S0066-782X2001000100008.
21. Carrasco HA, Parada H, Guerrero L, Duque M, Duran D, Molina C. Prognostic implications of clinical, electrocardio-graphic and hemodynamic findings in chronic Chagas’
disease.Int J Cardiol1994; 43: 27-38, doi: 10.1016/0167-5273(94)90087-6.
22. Expert consensus. Signal-averaged electrocardiography.J Am Coll Cardiol1996; 27: 238-249.
23. Liew R. Prediction of sudden arrhythmic death following acute myocardial infarction.Heart2010; 96: 1086-1094, doi: 10.1136/hrt.2010.194407.
24. Higuchi ML, Benvenuti LA, Martins RM, Metzger M. Pathophysiology of the heart in Chagas’ disease: current status and new developments.Cardiovasc Res2003; 60: 96-107, doi: 10.1016/S0008-6363(03)00361-4.
25. Korhonen P, Husa T, Tierala I, Vaananen H, Makijarvi M, Katila T, et al. QRS duration in high-resolution methods and standard ECG in risk assessment after first and recurrent myocardial infarctions.Pacing Clin Electrophysiol2006; 29: 830-836, doi: 10.1111/j.1540-8159.2006.00448.x.
26. Strauss DG, Cardoso S, Lima JA, Rochitte CE, Wu KC. ECG scar quantification correlates with cardiac magnetic reso-nance scar size and prognostic factors in Chagas’ disease. Heart2011; 97: 357-361, doi: 10.1136/hrt.2010.210047. 27. Manzullo EC, Chuit R. Risk of death due to chronic chagasic
cardiopathy.Mem Inst Oswaldo Cruz1999; 94 (Suppl 1): 317-320, doi: 10.1590/S0074-02761999000700060. 28. Barretto AC, Bellotti G, Deperon SD, Arteaga-Fernandez E,
Mady C, Ianni BM, et al. [The value of the electrocardiogram in evaluating myocardial function in patients with Chagas’ disease].Arq Bras Cardiol1989; 52: 69-73.
29. Benchimol-Barbosa PR, Barbosa-Filho J. Mechanical car-diac remodeling and new-onset atrial fibrillation in long-term follow-up of subjects with chronic Chagas’ disease.Braz J Med Biol Res 2009; 42: 251-262, doi: 10.1590/S0100-879X2009000300006.
30. Rassi A Jr, Dias JC, Marin-Neto JA, Rassi A. Challenges and opportunities for primary, secondary, and tertiary prevention of Chagas’ disease. Heart2009; 95: 524-534, doi: 10.1136/hrt.2008.159624.
31. Rassi A Jr, Rassi A, Rassi SG. Predictors of mortality in chronic Chagas disease: a systematic review of observa-tional studies. Circulation 2007; 115: 1101-1108, doi: 10.1161/CIRCULATIONAHA.106.627265.
32. Guzzetti S, Iosa D, Pecis M, Bonura L, Prosdocimi M, Malliani A. Impaired heart rate variability in patients with chronic Chagas’ disease. Am Heart J 1991; 121: 1727-1734, doi: 10.1016/0002-8703(91)90019-E.
33. Ribeiro AL, Moraes RS, Ribeiro JP, Ferlin EL, Torres RM, Oliveira E, et al. Parasympathetic dysautonomia precedes left ventricular systolic dysfunction in Chagas disease.Am Heart J2001; 141: 260-265, doi: 10.1067/mhj.2001.111406. 34. Ribeiro AL, Lombardi F, Sousa MR, Lins Barros MV, Porta A, Costa Val Barros V, et al. Power-law behavior of heart rate variability in Chagas’ disease.Am J Cardiol2002; 89: 414-418, doi: 10.1016/S0002-9149(01)02263-9.
35. Medei E, Pedrosa RC, Benchimol Barbosa PR, Costa PC, Hernandez CC, Chaves EA, et al. Human antibodies with muscarinic activity modulate ventricular repolarization: basis for electrical disturbance.Int J Cardiol2007; 115: 373-380, doi: 10.1016/j.ijcard.2006.03.022.
37. Sterin-Borda L, Borda E. Role of neurotransmitter auto-antibodies in the pathogenesis of chagasic peripheral dysautonomia.Ann N Y Acad Sci2000; 917: 273-280, doi: 10.1111/j.1749-6632.2000.tb05393.x.
38. Ribeiro AL, Cassini P, Peixoto SV, Lima-Costa MF. Vagal impairment in elderly Chagas disease patients: a popula-tion-based study (the Bambui study).Int J Cardiol 2011; 147: 359-365, doi: 10.1016/j.ijcard.2009.10.002.
39. de Sousa MR, Huikuri HV, Lombardi F, Perez AA, Gomes
ME, Barros MV, et al. Abnormalities in fractal heart rate dynamics in Chagas disease. Ann Noninvasive Electrocardiol2006; 11: 145-153, doi: 10.1111/j.1542-474X. 2006.00096.x.