DOI: http://dx.doi.org/10.1590/2446-4740.02315
*e-mail: [email protected]
Received: 11 Aug 2015 / Accepted: 28 March 2016
Correlation between spectral and temporal mechanomyography
features during functional electrical stimulation
Eddy Krueger*, Eduardo Mendonça Scheeren, Guilherme Nunes Nogueira-Neto, Vera Lúcia da Silveira Nantes Button, Percy Nohama
Abstract Introduction: Signal analysis involves time and/or frequency domains, and correlations are described in the literature for voluntary contractions. However, there are few studies about those correlations using mechanomyography (MMG) response during functional electrical stimulation (FES) elicited contractions in spinal cord injured subjects. This study aimed to determine the correlation between spectral and temporal MMG features during FES application to healthy (HV) and spinal cord injured volunteers (SCIV). Methods: Twenty volunteers participated in the research divided in two groups: HV (N=10) and SCIV (N=10). The protocol consisted of four FES proiles transcutaneously applied to quadriceps femoris muscle via femoral nerve. Each application produced a sustained knee extension greater than 65º up to 2 min without adjusting FES intensity. The investigation involved the correlation between MMG signal root mean square (RMS) and mean frequency (MF). Results: HV and SCIV indicated that MMGRMS and MMGMF variations were inversely related with -0.12 ≥ r ≥ -0.82. The dispersion between MMGMF and MMGRMS reached 0.50 ≤ r
2 ≤ 0.64. Conclusion: The increase in MMGRMS and the decrease in MMGMF may be explained by the motor units coherence during fatigue state or by motor neuron adaptation (habituation) along FES application (without modiication on parameters). Keywords: Functional electrical stimulation, Mechanomyography, Muscular physiology.
Introduction
From 1960 on, people with spinal cord injury or some other types of movement disorders have been
beneiting from artiicial muscle contraction elicited
by functional electrical stimulation (FES) (Kesar et al., 2010). One of the available techniques to monitor the contractions evoked by FES is electromyography (EMG). However, as a drawback, the electrical pulses of FES may cause interference on electromyographic signals due to electronic limitations (Seki et al., 2003). Alternatively, mechanomyography (MMG) allows the measurement of mechanical oscillations produced by muscle contraction without electromagnetic interference yielded by FES (Krueger et al., 2014). In this sense, MMG signals may also be applied in clinical settings (Cè et al., 2015) to control myoelectrical prostheses, orthoses (Prociow et al., 2008) or neuroprostheses (Chen et al., 2016; Popovic and Thrasher, 2004). Therefore, MMG enables the evaluation of FES-induced muscle contraction.
MMG has been employed in several areas, including those in which the EMG is already consolidated, but emphasizing voluntary contraction. Generally, the signal analysis methods involve the time and frequency domains or both. As an example, Tarata (2003) correlated the MMG signal between time
and frequency domains concluding that MMGRMS and MMG frequency responses present a negative correlation along time for voluntary contractions.
Despite the feasibility of MMG for the evaluation of FES-induced muscle contraction there are few studies in the literature about MMG response during FES elicited contractions in spinal cord injured subjects. An investigation of muscle activity caused by FES application to people with spinal cord injury can be achieved using different MMG parameters.
Hence, the goal of this study is to correlate spectral and temporal MMG features during FES application to healthy and spinal cord injured volunteers.
Methods
Subjects
This study received the approval of the Pontifícia Universidade Católica do Paraná (PUCPR) Human Research Ethics Committee under register number
2416/08 according to the Helsinki Declaration of 1975
as revised in 1983. The participants signed a consent form to take part in the study. The experimental study was carried out in the Rehabilitation Engineering Laboratory without temperature control.
Ten healthy volunteers (HV) without neurological or orthopaedic disorders (28.30 ± 6.58 yrs) and sixteen spinal cord injured volunteers (SCIV) (32.06 ± 9.68 yrs) were chosen to participate in the study. All participants were male. Before the application of the first stimulation protocol, the SCIV underwent medical examination so as to verify the inclusion/exclusion criteria. The inclusive criteria were clinical stability after spinal cord injury, no metallic implant in thigh or neoplastic tissue. Six SCIV were excluded from the initial group of volunteers, once they either did not tolerate the sensation caused by the application of electrical current or due to denervation of motor units. Table 1 presents the participants demography
and motor response parameters relecting their
neuromuscular condition. Temperature and relative
humidity in the research room were 22.9 ± 3.7 °C
and 62 ± 5.9%, respectively, during the application of protocols.
Sensors
The developed MMG instrumentation included
sensors which were built using Freescale MMA7260Q
MEMS triaxial accelerometers with sensitivity set to 800 mV/G at 1.5 G (G: gravitational acceleration). MMG signals are bipolar and therefore, symmetric-voltage
source supplied the electronic circuits that ampliied the MMG signals by 10x, whereas a 4-40Hz Butterworth third order ilter conditioned their spectral content.
The system acquired and processed the signals via
Data TranslationTM acquisition board and National
InstrumentsTM LabVIEW™ program. The sampling
rate was 1 kHz.
Electrical stimulation and sensors layout
The stimulatory current was a monophasic rectangular wave of 1 kHz pulse frequency (10% duty cycle) and 50 Hz burst frequency (15% duty cycle). After trichotomy and skin cleaning, self-adhesive electrodes (5×9 cm) were positioned over the knee region (anode) and over the femoral triangle (cathode) to stimulate the quadriceps muscle. The MMG sensors were positioned on the rectus femoris (RF) and the
vastus lateralis (VL) muscle bellies. A single axis electrogoniometer acquired the knee joint angle data.
Research design
The volunteers were seated on an adapted chair with
the hip and knee angles set to 70º (Matsunaga et al., 1999) and 90º, respectively. For each volunteer, the intensity set to the electrical stimuli was determined experimentally in an individual basis, and consisted of the smallest voltage required to make the limb move
and cause the knee angles to vary from ~90º to ~40º.
To avoid muscle damage, the rest periods were adjusted to 2 and 5 min, respectively, for HV and SCIV. Four stimulations were performed and the movements were
artiicially elicited by FES (with 5 s rise). Two criteria
were established to cause each contraction to end: time limit (until 120 s) in case the knee angle was always
Table 1. Demography of spinal cord injured volunteers.
Vol Age Spinal cord injury Sensibility Motor system Deliverance
Etiology Com Inc Months L1-L2 Force Relex Spasticity A NA
A 25 Gunshot T8 24 - 0 0 0 X
B 46 Automobilist T8 31 - 0 2 0 X
C 30 Gunshot T6 84 - 0 2 +1 X
D 28 Automobilist T12 48 + 0 1 0 X
E 29 Automobilist T12 108 + 1 3 2 X
F* 26 Gunshot T10-11 168 - 0 2 +1 X
G 34 Automobilist T4-5 84 - 0 2 1 X
H 24 Gunshot T12 24 - 0 0 0 X
I 25 Automobilist T12 18 - 0 0 0 X
J 37 Diving C5-6 162 - 0 3 1 X
K 19 Gunshot T10 12 + 0 3 1 X
L 48 Fall T11 60 + 3 3 2 X
M 52 Other L4 60 + 4 2 0 X
N 26 Automobilist C6-7 28 - 0 3 2 X
O 28 Automobilist T3 60 - 0 0 1 X
P 36 Other L1 132 + 4 2 0 X
Vol: volunteer; Com: complete; Inc: incomplete, nociceptive sensitivity; “-” absent; “+” present; Force: Force scale [0 (absent muscular tonus) to 5 (normal force)] (Cipriano, 2003); Relex: Wexler scale [0 (absent relex) to 5 (sustained clonus)] (Cipriano, 2003); Spasticity: Ashworth modiied
under 65°, or if the knee angle was beyond 65° the
elicited contraction was ceased (Figure 1). For each FES stimuli, three analysis windows (1-initial, 2-middle
and 3-inal) were extracted from the MMG and angle
signals response. The initial window started 8 s after
the beginning (the irst ive seconds was rise time); the inal one was triggered 3 s before the end (125 s
or angle greater than 65º) to avoid spurious signal
due the initial and inal of contraction. Moreover,
the middle was the equidistant window between the
initial and inal ones.
Data acquisition and analysis
All signals and volunteers data were saved into
European Data Format (EDF) iles. The acquisition
system contained a DT300 series Data Translation™ board working at 1 kHz sampling rate. The rectus femoris muscular shape is bipenate (Blemker and Delp, 2006) and the displacements of muscle iber oscillations during contraction occur in several directions; therefore, the resultant (or modulus) of three axes (X, Y and Z) was used, because it represents quite rightly the entire event. The analysis window length (AWL) was 1 s, and the Hanning window was applied to the signals before the spectral feature extraction. For every AWL, root mean square (RMS) and mean frequency (MF) features were computed from the MMG acquired signals. Then MMGRMS and MMGMF moduli were calculated and analyzed.
All data were normalized by means of the values of the initial window (1I). A Kolmogorov-Smirnov test was performed in order to evaluate the normal distribution of data. Paired-sample t-test was applied to compare MMG features between HV and SCIV.
Linear trend line was added to a representative
SCIV data, to show the determination coeficient
(r2) to MMG
RMS and MMGMF. Pearson’s correlation
coeficients were computed between the values of
MMGRMS and MMGMF obtained from MMG sensors.
Scatter plots were traced for the middle and inal points
showed a variation trend such as a cubic function.
Results
According to Kolmogorov-Smirnov test all data have Gaussian distribution and linear correlation analysis was performed. The stimulator output amplitude was adjusted in 82 ± 16 V for HV and 161 ± 36 V for SCIV. Table 2 shows the angular changes during the protocols applied to HV and SCIV. Table 3 presents the mean and standard deviation (along all the protocol) of MMGRMS and MMGMF normalized for
Figure 1. Timing scheme of FES application and MMG acquisition. FES intensity determination to reach 40°, Interval I (2 min – HV and 5 min – SCIV), Session (four contractions I, II, III and IV with 5 s interval between consecutive contractions).
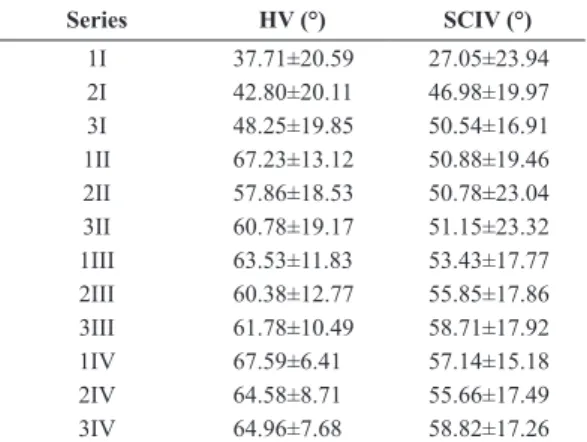
Table 2. Magnitudes of knee angle lexion obtained during the application of protocols to healthy and spinal cord injured volunteers.
Series HV (°) SCIV (°)
1I 37.71±20.59 27.05±23.94 2I 42.80±20.11 46.98±19.97 3I 48.25±19.85 50.54±16.91 1II 67.23±13.12 50.88±19.46 2II 57.86±18.53 50.78±23.04 3II 60.78±19.17 51.15±23.32
1III 63.53±11.83 53.43±17.77
HV and SCIV as the paired-sample t-test p value, where just the MMGMF to VL muscle was different between the groups.
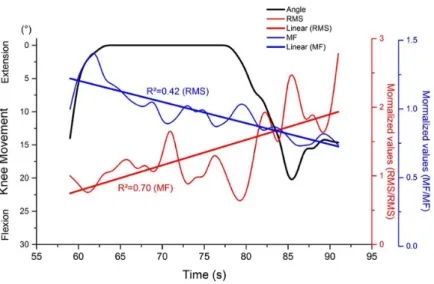
Figure 2 illustrates the MMG responses of RF and
VL muscles of a single volunteer (K – see Table 1) submitted to FES application period of 32 s during
the irst series (I). The plotted trend lines (Linear
MMGMF and Linear MMGRMS) indicate a divergence between MMGRMS and MMGMF variation rates along knee angle decrease.
Table 4 lists the Pearson’s coeficients calculated.
Negative correlation values corroborate that MMGRMS and MMGMF features tend to diverge during the
FES application. Those coeficients varied from –0.12 up to –0.82.
Figure 3 shows scatter plots of the middle and
inal data for all FES series. Since all values were normalized by irst series (I), the initial values were not included in those igures since they were all equal
to unity. For HV and SCIV, the trend lines of MMGMF and MMGRMS presented determination coeficients
(r-squared) from 0.50 to 0.64 indicating a moderate
correlation.
Discussion
In this paper we determined the correlation between spectral and temporal MMG features during FES application to healthy and spinal cord injured volunteers. Our results indicate a negative correlation between the analyzed parameters (MMGRMS and MMGMF) to both groups as found by Tarata (2003) with HV during voluntary contraction. Therefore the negative correlation indicates that MMGRMS and MMGMF values diverge due to muscle fatigue and/or motoneuron adaptation. With a similar research aim, Merletti and Lo Conte (1995) used EMG to identify human tibialis anterior muscle fatigue and their results show that the EMGRMS magnitudes increased and EMGMDF (median frequency of EMG signal) values decreased along time.
Figure 2. MMG response of rectus femoris muscle of spinal cord injured volunteer (K) during 32 s of the irst FES application (I). Straight
lines show MMGMF and MMGRMS data tendencies by means linear regression. Table 4. Pearson’s correlation coeficients (r) between MMGRMS and MMGMF.
Series HV SCIV
I –0.82* –0.12
II –0.72* –0.60*
III –0.68* –0.64*
IV –0.75* –0.58*
HV: healthy volunteer; SCIV: spinal cord injured volunteer. *p< 0.05. Table 3. Normalized mean values of MMGRMS and MMGMF for healthy and spinal cord injured volunteers.
Vol
MMGRMS MMGMF
RF (Norm)
VL (Norm)
RF (Norm)
VL (Norm)
HV 0.98±0.33 0.98±0.36 1.05±0.19 1.00±0.18 SCIV 1.01±0.56 0.89±0.41 0.96±0.19 1.01±0.16
p* 0.678 0.063 0.001 0.625
Vol: volunteer; RMS: root mean square; MF: mean frequency;
Norm: normalized values by irst point of analysis (1I); HV: healthy
Regarding to the MMG temporal feature, Smith et al.
(1997) found that with stronger muscular force, there is an increase in temporal features, thus raising the intensity of muscle vibration.
In the present research, the MMG sensor was attached on the skin. As the protocol involved dynamic movements, it was expected that the skin movement has changed the sensor position relative to the innervation zone. In that way, the MMG signal could be contaminated as the EMG signal in some cases (Artuğ et al., 2016), although Malek and Coburn (2011) showed that the MMG signal is not contaminated by the innervation zone for time and frequency domains.
Blangsted et al. (2005) suggested that the increase in MMGRMS signal is due to the intramuscular pressure increase. However, Søgaard et al. (2006) showed that the increase in intramuscular pressure does not interfere in the amount of MMGRMS. Akataki et al. (2003) investigated the increase in muscular force
and its relationship to MMG. Until 40% of maximal
voluntary contraction (MVC), the MMGRMS magnitude
in the irst dorsal interosseous muscle tends to increase initially and to decrease later. This increase is similar to that occurring on biceps brachii muscle, followed by a decrease in MMGRMS after 60% of MVC. Esposito et al. (2005) showed for the VL muscle an increase in MMGRMS magnitude before of 80% MVC, and after this, the MMGRMS variation trended down. Similar results were found by Stock et al. (2009) to RF, VL and VM (vastus medialis) muscles. These results indicate that the relationship between MMGRMS and muscle strength may be non-linear. We did not measure muscular force directly (we measured the knee joint angle variation), therefore it was not possible to compare MMGRMS and muscle strength.
In the present study, the magnitude of electrical current applied by means of a voltage-controlled
stimulator to the quadriceps muscle contraction was just enough to keep a knee joint extension, consequently, evoking a contraction not so strong that could increase the lactate level (that was not measured) of the participants. However, we had two sample groups, one of SCIV and other of HV who have the integrity of their neuromuscular systems.
There had been just signiicant MMGMF difference for VL sensor (Table 3) between the groups, despite of their different neuromuscular condition and FES intensity levels.
Ebersole et al. (2006) recorded EMG signals while
HV subjects performed ifty voluntary concentric
repetitions of quadriceps muscle and obtained a decrease in the mean power frequency along the time. Carrying out a protocol to evaluate muscle fatigue during 10 s of 30% of MVC, Jansen et al. (1997) showed that there is a relationship between the onset of muscle fatigue, indicated by a decrease in EMGMDF and the increasing of blood lactate.
In voluntary contractions, Ebersole and Malek (2008) stated that the MMGRMS increases could be attributed to the recruitment of new motor units. Our results showed that along the time, with the application of electrical current, occurred a decrease in muscle oscillatory frequency (our results). This event could be explained by the increase in the motor units
iring rate threshold caused by motor neuron adaptation
(Merletti and Lo Conte, 1995; Spielmann et al., 1993). We think that some motor units tend to oscillate at the same frequency of other motor units. When motor
units iring rate have a close frequency, the muscle
performs an in phase contraction due to motor units coherence (Yao et al., 2000). This could explain the MMGRMS increase and MMGMF decrease.
In conclusion, during contraction evoked by FES, MMGRMS and MMGMF variations presented are
which is represented by a negative correlation between them. These results were similar to healthy as to spinal cord injured subjects. The rise of MMGRMS could be explained by the motor units coherence increasing the mechanical wave amplitude. The reduction of MMGMF
might be due to the increase in the motor units iring
rate threshold caused by motor neuron adaptation (habituation). Future studies will be necessary in order to identify a technique to differentiate the
timing among muscular iber events along the FES
application.
Acknowledgements
We would like to thank CNPq, CAPES and SETI-PR
for the important funding and inancial support.
References
Akataki K, Mita K, Watakabe M, Itoh K. Mechanomyographic responses during voluntary ramp contractions of the human first dorsal interosseous muscle. European Journal of Applied Physiology. 2003; 89(6):520-5. http://dx.doi.org/10.1007/ s00421-003-0835-1. PMid:12712352.
Artuğ NT, Goker I, Bolat B, Osman O, Orhan EK, Baslo MB. The effect of recording site on extracted features of motor unit action potential. Computer Methods and Programs in Biomedicine. 2016. In press. PMid:26817404.
Blangsted AK, Sjøgaard G, Madeleine P, Olsen HB, Søgaard K. Voluntary force contraction elicits prolonged low-frequency fatigue and changes in surface electromyography and mechanomyography. Journal of Electromyography and Kinesiology. 2005; 15(2):138-48. http://dx.doi.org/10.1016/j. jelekin.2004.10.004. PMid:15664144.
Blemker SS, Delp SL. Rectus femoris and vastus intermedius fiber excursions predicted by three-dimensional muscle models. Journal of Biomechanics. 2006; 39(8):1383-91. http:// dx.doi.org/10.1016/j.jbiomech.2005.04.012. PMid:15972213. Bohannon RW, Smith M. Interrater reliability of a Modified Ashworth Scale of muscle spasticity. Physical Therapy. 1987; 67(2):206-7. PMid:3809245.
Cè E, Rampichini S, Esposito F. Novel insights into skeletal muscle function by mechanomyography: from the laboratory to the field. Sport Sciences for Health. 2015; 11(1):1-28. http://dx.doi.org/10.1007/s11332-015-0219-z.
Chen X, Wen H, Li Q, Wang T, Chen S, Zheng Y-P, Zhang Z. Identifying transient patterns of in vivo muscle behaviors during isometric contraction by local polynomial regression. Biomedical Signal Processing and Control. 2016; 24:93-102. http://dx.doi.org/10.1016/j.bspc.2015.09.009.
Cipriano JJ. Photographic manual of regional orthopaedic and neurological tests. 4th ed. Atlanta: Lippincott Williams & Wilkins; 2003.
Ebersole KT, Malek DM. Fatigue and the electromechanical efficiency of the vastus medialis and vastus lateralis muscles.
Journal of Athletic Training. 2008; 43(2):152-6. http:// dx.doi.org/10.4085/1062-6050-43.2.152. PMid:18345339. Ebersole KT, O’Connor KM, Wier AP. Mechanomyographic and electromyographic responses to repeated concentric muscle actions of the quadriceps femoris. Journal of Electromyography and Kinesiology. 2006; 16(2):149-57. http:// dx.doi.org/10.1016/j.jelekin.2005.05.005. PMid:16139522.
Esposito F, Cé E, Gobbo M, Veicsteinas A, Orizio C. Surface EMG and mechanomyogram disclose isokinetic training effects on quadriceps muscle in elderly people. European Journal of Applied Physiology. 2005; 94(5-6):549-57. http:// dx.doi.org/10.1007/s00421-005-1371-y. PMid:15942769. Jansen R, Ament W, Verkerke GJ, Hof AL. Median power frequency of the surface electromyogram and blood lactate concentration in incremental cycle ergometry. European Journal of Applied Physiology. 1997; 75(2):102-8. http:// dx.doi.org/10.1007/s004210050133. PMid:9118974. Kesar TM, Perumal R, Jancosko A, Reisman DS, Rudolph KS, Higginson JS, Binder-Macleod SA. Novel patterns of functional electrical stimulation have an immediate effect on dorsiflexor muscle function during gait for people poststroke. Physical Therapy. 2010; 90(1):55-66. http:// dx.doi.org/10.2522/ptj.20090140. PMid:19926681. Krueger E, Scheeren EM, Nogueira-Neto GN, Button VLSN, Nohama P. Advances and perspectives of mechanomyography. Revista Brasileira de Engenharia Biomédica. 2014; 30(4):384-401. http://dx.doi.org/10.1590/1517-3151.0541.
Malek MH, Coburn JW. Mechanomyographic responses are not influenced by the innervation zone for the vastus medialis. Muscle & Nerve. 2011; 44(3):424-31. PMid:21755516. Matsunaga T, Shimada Y, Sato K. Muscle fatigue from intermittent stimulation with low and high frequency electrical pulses. Archives of Physical Medicine and Rehabilitation. 1999; 80(1):48-53. http://dx.doi.org/10.1016/ S0003-9993(99)90306-4. PMid:9915371.
Merletti R, Lo Conte LR. Advances in processing of surface myoelectric signals: part 1. Medical & Biological Engineering & Computing. 1995; 33(3):362-72. http:// dx.doi.org/10.1007/BF02510518. PMid:7666682. Popovic MR, Thrasher TA. Neuroprostheses. In: Bowlin GL, Wnek G, editors. Encyclopedia of Biomaterials and Biomedical Engineering. New York: Informa Healthcare; 2004. p. 1056-65.
Prociow P, Wolczowski A, Amaral T, Dias O, Filipe J. Identification of hand movements based on MMG and EMG signals. In: Proceedings of the International Conference on Bio-inspired Systems and Signal Processing; 2008; Funchal, Madeira, Portugal. Madeira: INSTICC; 2008. p. 534-9. Seki K, Ogura T, Sato M, Ichie M. Changes of the evoked mechanomyogram during electrical stimulation. In: Annual Conference of the International Functional Electrical Stimulation Society; 2003; Brisbane. Sunshine Coast: IFESS; 2003.
Søgaard K, Orizio C, Sjøgaard G. Surface mechanomyogram amplitude is not attenuated by intramuscular pressure. European Journal of Applied Physiology. 2006; 96(2):178-84. http:// dx.doi.org/10.1007/s00421-004-1211-5. PMid:15375662. Spielmann JM, Laouris Y, Nordstrom MA, Robinson GA, Reinking RM, Stuart DG. Adaptation of cat motoneurons to sustained and intermittent extracellular activation. The Journal of Physiology. 1993; 464(1):75-120. http://dx.doi. org/10.1113/jphysiol.1993.sp019625. PMid:8229829.
Stock MS, Beck TW, DeFreitas JM, Dillon MA. Linearity and reliability of the mechanomyographic amplitude
versus concentric dynamic torque relationships for the superficial quadriceps femoris muscles. Muscle & Nerve. 2009; 41:324-49.
Tarata MT. Mechanomyography versus electromyography, in monitoring the muscular fatigue. Biomedical Engineering Online. 2003; 2(1):3. http://dx.doi.org/10.1186/1475-925X-2-3. PMid:12625837.
Yao W, Fuglevand RJ, Enoka RM. Motor-unit synchronization increases EMG amplitude and decreases force steadiness of simulated contractions. Journal of Neurophysiology. 2000; 83(1):441-52. PMid:10634886.
Authors
Eddy Krueger1,2*, Eduardo Mendonça Scheeren3, Guilherme Nunes Nogueira-Neto3,4, Vera Lúcia da Silveira Nantes Button4, Percy Nohama1,3,4
1 Graduate Program in Electrical and Computer Engineering – CPGEI, Universidade Tecnológica Federal do Paraná – UTFPR,
Curitiba, PR, Brazil.
2 Departamento de Anatomia – DANAT, Universidade Estadual de Londrina – UEL, Campus Universitário, s/n, CEP
86051-990, Londrina, PR, Brazil.
3 Programa de Pós-graduação em Tecnologia em Saúde – PPGTS, Pontifícia Universidade Católica do Paraná – PUC-PR,
Curitiba, PR, Brazil.
4 Departamento de Engenharia Biomédica – DEB, Faculdade de Engenharia Elétrica e de Computação – FEEC, Centro de

![Figure 3. Scatter plots of MMG MF and MMG RMS for healthy [HV – illed line (x)] and spinal cord injured volunteers [SCIV –dashed line (▲)].](https://thumb-eu.123doks.com/thumbv2/123dok_br/18862379.418176/5.765.188.626.103.332/figure-scatter-plots-healthy-spinal-injured-volunteers-dashed.webp)
