INTRODUCTION
Over the last few decades, titanium dioxide (TiO2) has attracted the attention of researchers for different applications, like the gate dielectric in metal oxide semiconductor ield-effect transistors (MOSFETs) [1], and surfaces for solar energy conversion [2, 3]; it is also used for high eficient photocatalytic activity [4-6] because of their well-known properties, which include high refractive index (n=2.4), high permittivity and transmittance in the visible region. Recently TiO2 has also been widely used in the ield of optical and protective coatings, iber optics and high speed electronic devices [7, 8] due to their excellent mechanochemical stability [9]. TiO2 as diluted magnetic semiconductors (DMS) share the qualities of
both semiconductors and magnetic materials, such as ferromagnetism and magnetoelectricity, and the application of the diluted magnetic semiconductors is widely promising in various ields [10-12].
Different techniques have been used for the preparation of TiO2 nanoparticles, which includes sol-gel, different forms of sputtering from metallic and ceramic targets, electron beam evaporation, pulsed laser deposition and chemical vapor deposition. Considering the advantages and disadvantages of these methods, sol-gel process has been chosen as the most important process because of its low reaction temperature, narrow range of particle size distribution, controllable particle-size, low cost and ease of processing for the preparation of TiO2 nanoparticles (NPs) [13]. For example, TiO2 NPs were synthesized employing
Inluence of precursor type on structural, morphological, dielectric and
magnetic properties of TiO
2nanoparticles
(Inluência do tipo precursor nas propriedades estruturais, morfológicas,
dielétricas e magnéticas das nanopartículas de TiO
2)P. K. Singh1*, S. Mukherjee2, C. K. Ghosh3, S. Maitra1
1Government College of Engineering and Ceramic Technology, Kolkata 10, India
2Amity School of Engineering and Technology, Amity University, Kolkata, India
3School of Materials Science and Nanotechnology, Jadavpur University, Kolkata, India
[email protected], [email protected], [email protected], [email protected]
Abstract
TiO2 nanoparticles (NPs) were synthesized by sol-gel methods using two different precursors, titanium tetraisopropoxide and
potassium titanium oxalate (KTO). The precursors had a profound inluence on the structural, morphological, dielectric and magnetic properties of synthesized TiO2 NPs, as evidenced by the XRD, FE-SEM, TEM, LCR and VSM studies in the synthesized
samples. Alkoxide-derived TiO2 NPs contained mostly mixed phases of anatase and rutile, whereas KTO-derived TiO2 NPs
contained anatase and Magnéli phases (TinO2n-1). After heat treatment at 550 °C, the crystallite size of KTO-derived NPs was lower
than alkoxide-derived TiO2 NPs. The synthesized nanoparticles were spherical and agglomerated having anatase and rutile phases
with different proportions in the microstructure of the alkoxide sample. Dielectric constant of the KTO-derived NPs was higher than the alkoxide-derived NPs. Diamagnetic behavior of KTO-derived NPs was also higher than the alkoxide-derived TiO2 NPs.
Keywords: TiO2 nanoparticles, sol-gel, dielectric constant, grain size, anatase.
Resumo
Nanopartículas (NPs) de TiO2 foram sintetizadas por métodos de sol-gel usando dois diferentes precursores, tetraisopropóxido
de titânio e oxalato de potássio e titânio (KTO). Os precursores tiveram profunda inluência nas propriedades estruturais,
morfológicas, dielétricas e magnéticas das NPs de TiO2 sintetizadas, como evidenciado pelos estudos de DRX, FE-MEV, MET, LCR e VSM das amostras sintetizadas. As NPs de TiO2 derivadas de alcóxido apresentaram principalmente fases misturadas de anatásio e rutilo, enquanto que as NPs de TiO2 derivadas de KTO apresentaram fases anatásio e de Magnéli (TinO2n-1). Após tratamento térmico a 550 °C, o tamanho de cristalito das NPs derivadas de KTO foi menor do que o das NPs de TiO2 derivadas de alcóxido. As nanopartículas sintetizadas foram esféricas e aglomeradas com fases anatásio e rutilo em diferentes proporções na microestrutura da amostra de alcóxido. A constante dielétrica das NPs derivadas de KTO foi maior do que a das NPs derivadas de alcóxido. O comportamento diamagnético das NPs derivadas de KTO também foi maior do que o das NPs de TiO2 derivadas de alcóxido.
sol-gel technique from titanium tetraisopropoxide with crystal size of approximately 20 nm containing anatase and rutile mixed phases [14]. TiO2 NPs were also synthesized from tetraisopropyl orthotitanate and titanium tetrachloride separately and the product obtained was TiO2 in anatase phase with only ~10 nm crystal size [15]. TiO2 NPs were also synthesized by sol-gel method from titanium alkoxide and adjusting the gelling pH to a value of ~3 pure anatase TiO2 was obtained [16]. Nano-TiO2 in anatase form was synthesized by sol-gel method using titanium isobutoxide with 16 nm crystal size [17]. Non-hydrolytic sol-gel reaction between titanium isopropoxide and oleic acid was employed and generated TiO2 nanorods of uniform dimension with anatase phase [18]. 10 nm anatase TiO2 sample was synthesized by hydrothermal processing at 180 °C and the synthesized TiO2 underwent neither phase change nor signiicant grain growth up to 800 °C; further, nanocrystalline rutile TiO2 particles were attained via hydrothermal treatment in an acidic medium [19].
In the present work, TiO2 nanoparticles were synthesized using two different precursors KTO and titanium alkoxide by sol-gel method. The difference in crystallite size, morphology, phase composition (proportion of rutile and anatase), dielectric and magnetic behavior of the TiO2 particles synthesized from two different precursors was studied by XRD, TEM, FE-SEM, VSM and LCR.
EXPERIMENTAL
All the chemicals used in the present experiment were of reagent grade. TiO2 sol was prepared by dissolving 7.08 mg of potassium titanium oxalate (KTO), K2TiO(C2O4)2.2H2O (Loba Chemie), in 200 mL of distilled water for making 0.1 M KTO solution. White precipitate of titanium hydroxide was formed in the sol when NH4OH (1:1) was added drop wise to the solution under continuous stirring using magnetic stirrer. The precipitation was completed at around pH ~12, and it was washed thoroughly with distilled water until the pH of the solution became 7. Then it was iltered and the precipitate was dissolved in a 1:1 solution of 30% H2O2 (Merck). Afterwards, the total solution was kept for 20 min to dissolve the precipitate completely in the solution. To this solution diethanolamine (DEA), C4H11NO2(Merck, ≥98%) was added drop wise until the pH of the solution became 12 and a stable sol was obtained. KTO-derived sol was dried at 110 °C in an air oven to convert it into gel. It was heat treated subsequently at 550 and 900 °C for 1 h in an electrically heated mufle furnace with heating rate of 5 °C/min.
For the synthesis of TiO2 sol from alkoxide precursor, 10 mL of titanium (IV) isopropoxide, Ti[OCH(CH3)2]4 (Sigma-Aldrich), 3 mL of diethanolamine (Merck), and 60 mL of ethanol (Merck) were taken as starting materials for the preparation of titania sol. Ethanol was mixed with diethanolamine (DEA) and then titanium isopropoxide was added to it slowly; this mixture was vigorously stirred for 40 min. To the thoroughly stirred mixture 2 drops of
water was added followed by stirring again. The sol was observed to be stable and after 7 days it was transformed to gel. Alkoxide-derived sol was converted to gel at room temperature by evaporation followed by heat treatment similar to the above-mentioned procedure. The gel was heat treated at 550 and 900 °C for 1 h in an electrically heated mufle furnace with a heating rate of 5 °C/min.
All samples were characterized by the various techniques, such as X-ray diffraction (XRD, Rigaku, Ultima III). The relative proportion of rutile phase was calculated by [20]:
Wr = Ir
(0.884Ia + Ir) (A)
where, Wr is the rutile fraction, Ir is the intensity of (110) peak of rutile, and Ia is the intensity of (101) peak of anatase. The grain size of the samples was calculated using Scherrer equation [21]:
D = 0.94λ/bcosq (B)
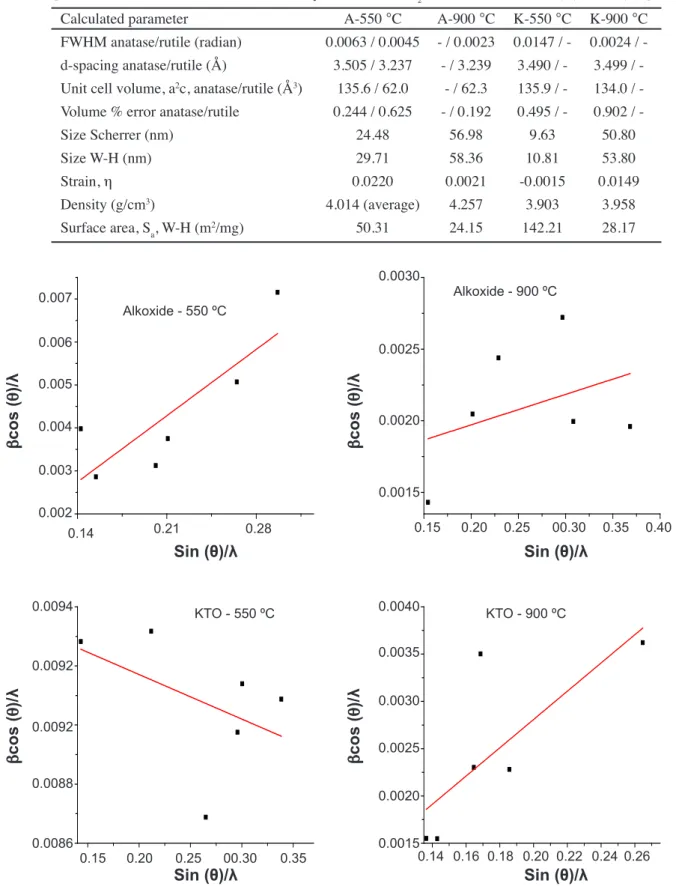
where, D is the size of crystallite, λ is the wavelength, β is FWHM and θ is the diffraction angle. The individual contributions of crystallite sizes and lattice strain on the peak broadening of the TiO2 nanoparticle were analyzed by using the size-strain plot of Williamson-Hall (W-H) method [22, 23]:
(βcosθ)/λ = 1/D + η(sinθ/λ) (C)
where, η is the effective strain, β is FWHM in radian, λ is the X-ray wavelength, θ is the diffraction angle, and D is the effective particle size. The negative slope in W-H plot indicated the presence of compressive strain [24], whereas the positive slope indicated the presence of tensile strain [25]. The sample density, ρ, from X-ray data was calculated by [26, 27]:
r = nM/NV (D)
where, M is the molecular weight, N is Avogadro’s number and V is the volume of unit cell. For anatase phase n is four and for rutile phase n is two [20, 28]. Further, the speciic surface area, Sa, was calculated by [27]:
Sa=6/Dr, (E)
RESULTS AND DISCUSSION
From the XRD pattern of alkoxide-derived TiO2 (Fig. 1a), it was observed that after calcination at 550 °C, the sample contained anatase as the major crystalline phase. The characteristic lattice planes of anatase, (101), (004), (200), (211) and (105), were observed with high intensities. With the increase in temperature, the proportion of rutile phase in the sample increased signiicantly. At 900 °C, (110), (101), (111), (211), (220) and (301) planes of rutile were also detected. At 550 °C about 28% of rutile phase was present in the sample. Although anatase and rutile have the same basic TiO6 octahedron, the arrangement of atoms in the basic unit changed when the rutile phase was developed from anatase. TiO6 octahedron did undergo distortion on heat treatment and inally breaking and recombination of new Ti-O bonds occurred at the interphase and at the grain interiors. Lattice distortion and breaking of Ti-O bonds at higher temperatures
resulted in the removal of oxygen ions and creation of defects along with the development of new Ti-O bonds in the rutile phase. At 900 °C all peaks in the XRD pattern corresponding to the rutile phase were present. The increase in intensities of all the characteristic planes, (110), (101), (111), (211) and (220), indicated inal reconstruction of rutile phase with the removal of residual defects. This observation is somewhat different from other works reported in literature [18, 19].
For KTO-derived TiO2 it was observed from XRD pattern of the sample calcined at 550 °C (Fig. 1b), the present phase was only anatase with characteristic planes (101), (004), (200), (105), (211) and (204). After heat treatment at 900 °C the presence of 95.5% of anatase phase with characteristic planes (101), (004), (200) and (211), and 4.5% of rutile phase with lattice plane (110) were observed. But there were some phases which were related to the formation of non-stoichiometric and defect phases, like TiO, Ti3O5, Ti5O9, Ti4O7 and Ti9O17 (JCPDS No. 80117, 090309, 110193, 181402 and 181405, respectively). When the concentration of the resulting oxygen vacancies is high enough, these phases may rearrange spontaneously to form ordered reduced structures, the so-called Magnéli phases (TinO2n-1) [29], which is a new inding in this work at this temperature. The intensity of peaks corresponding to anatase increased at this temperature indicating improved crystallization of anatase phase. Peaks corresponding to Magnéli phases were also observed in increased proportions.
The deviation in terms of % error in the intensities of diffraction was calculated by taking standard values of cell volume for anatase (135.25 Å3) and for rutile (62.43 Å3) from JCPDS No. 10731764 and 40551. The % cell volume error is given in Table I. For the alkoxide-derived TiO2 powder, the grain size increased and microstrain decreased as a function of the heat treatment (Fig. 2). The grain growth can be related to the removal of oxygen vacancy and increasingly convex nature of the grain boundary. The change in the chemical potential of the atoms across the curved grain boundary side acted as the driving force to move the boundary and resulted in the increase of the grain [30-32].
From EDX analysis, in alkoxide-derived sample it was observed that with the increase in the calcination temperature, the proportion of oxygen atom decreased from 38.3 to 27.6 at% and the proportion of Ti increased in TiO2. It indicated that with the increase in the calcination temperature oxygen ions came out of the structure with the formation of oxygen vacancies. In KTO-derived sample, it was observed that with the increase in the calcination temperature, the proportion of oxygen atom decreased from 38.1 to 19.0 at%, and 2.6 to 2.3 at% of potassium was present in sample. The oxygen vacancy increased substantially at higher calcination temperature, indicating lower oxygen partial pressure at 900 °C.
From HRTEM image of TiO2 nanoparticles calcined at 550 °C derived from KTO precursor (Fig. 3), clear lattice fringes were observed which indicated that the crystallite of TiO2 particle were mostly anatase as detected from XRD analysis. It can be seen that the average crystallite size in the synthesized TiO2 powder was about 11 nm in diameter which Figure 1: X-ray diffraction patterns of alkoxide (a) and
KTO (b) derived TiO2 samples heat treated at 550 and 900 °C.
[Figura 1: Difratogramas de raios X de amostras de TiO2
derivadas de alcóxido (a) e KTO (b) calcinadas a 550 e 900 °C.]
20
20
2q (degree)
2q (degree)
In
te
n
s
ity
In
te
n
s
ity
40
40
60
60 30
30
50
50
70
was in agreement with the size obtained from XRD analysis.
Selected area electron diffraction pattern (SAED) of TiO2 particle showed rings for the anatase phase and the irst four rings were related to the diffraction from (101), (004),
Calculated parameter A-550 °C A-900 °C K-550 °C K-900 °C
FWHM anatase/rutile (radian) 0.0063 / 0.0045 - / 0.0023 0.0147 / - 0.0024 / -d-spacing anatase/rutile (Å) 3.505 / 3.237 - / 3.239 3.490 / - 3.499 / -Unit cell volume, a2c, anatase/rutile (Å3) 135.6 / 62.0 - / 62.3 135.9 / - 134.0 / -Volume % error anatase/rutile 0.244 / 0.625 - / 0.192 0.495 / - 0.902 /
-Size Scherrer (nm) 24.48 56.98 9.63 50.80
Size W-H (nm) 29.71 58.36 10.81 53.80
Strain, η 0.0220 0.0021 -0.0015 0.0149
Density (g/cm3) 4.014 (average) 4.257 3.903 3.958
Surface area, Sa, W-H (m2/mg) 50.31 24.15 142.21 28.17
Table I - Structural parameters of alkoxide (A) and KTO (K) derived TiO2 nanoparticles.
[Tabela I - Parâmetros estruturais das nanopartículas de TiO2 derivadas de alcóxido (A) e KTO (K).]
0.15 0.20 0.25 0.30 0.35 0.40
0.0015 0.0020 0.0025 0.0030
b
C
os
(
q
)/
l
Sin(
q
)/
l
Alkoxide - 900
oC
0.14 0.16 0.18 0.20 0.22 0.24 0.26
0.0015 0.0020 0.0025 0.0030 0.0035 0.0040
b
C
os
(
q
)/
l
KTO -900
oC
0.14 0.21 0.28
002 003 004 005 006 007
Sin(
q
)/
l
Alkoxide -550
oC
0.15 0.20 0.25 0.30 0.35
0086 0088 0090 0092
0094
KTO - 550
oC
Figure 2: W-H plots of alkoxide and KTO derived TiO2 samples heat treated at 550 and 900 °C.
[Figura 2: Gráicos de W-H de amostras de TiO2 derivadas de alcóxido e KTO calcinadas a 550 e 900 °C.]
0.007
0.0040 0.0094
0.0035 0.0092
0.0030 0.0092
0.0025
0.0088
0.0020
0.0015 0.0086
0.0030
0.0025
0.0020
0.0015 0.004
0.006
0.003 0.005
0.002
0.14 0.14
Sin (θ)/λ
b
c
o
s
(
q
)/λ
b
c
o
s
(
q
)/λ
b
c
o
s
(
q
)/λ
b
c
o
s
(
q
)/λ
Sin (θ)/λ
Sin (θ)/λ
Sin (θ)/λ
0.18 0.22
0.16 0.20 0.24 0.26 0.15
0.15
00.30
00.30 0.21
0.20
0.20
0.35
0.35 0.28
0.25
0.25 0.40
Alkoxide - 900 ºC Alkoxide - 550 ºC
(200) and (211) planes of anatase, which radii corresponded to interplanar distances. The image for the sample derived from KTO precursor did not show much contrast among the individual images of the crystallite indicating the presence of mostly single type phase anatase in the sample.
For alkoxide-derived TiO2 (Fig. 4) signiicant grain growth was noticed during the transformation of anatase to rutile. After heat treatment at 550 °C, the grain size of the alkoxide-derived NPs was 29 nm which became double in size (58 nm) after heat treatment at 900 °C. Rutile grains in the samples developed at the expense of neighboring grain coalescences until the relatively larger rutile grain began to impinge on each other. From alkoxide-derived sample images, it was observed that the different type crystallite with different density were present in the microstructure. The lighter image was attributed to higher density rutile particles.
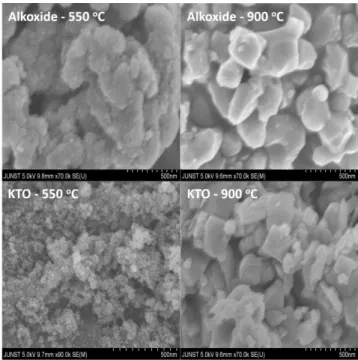
FE-SEM micrographs (Fig. 5) of the alkoxide precursor derived TiO2 revealed that the samples consisted of nanosized primary particles with spherical shape and agglomeration. Increase in the particle size with calcination temperature was related to the crystal growth. Changes in the dispersion behavior of the agglomerates as a function of calcination temperature were noticed in the micrographs. For KTO-derived TiO2 samples, with the increase in the calcination temperature the morphology of the particles changed. Initially it was irregular shaped spherical structures consisting of relatively smaller granule clusters, but with the increase in the calcination temperature morphology was changed to a mixture of platelet shaped structures with Figure 3: TEM micrographs of KTO-derived TiO2 nanoparticles
calcined at 550 °C (a,b), SAED pattern of TiO2 nanoparticle (c), and HRTEM image of TiO2 nanoparticles showing a fringe spacing of 0.365 nm (d).
[Figura 3: Micrograias obtidas por microscopia eletrônica de transmissão de nanopartículas de TiO2 derivadas de KTO calcinadas a 550 °C (a,b), padrão SAED de nanopartículas de TiO2 (c) e imagem de alta resolução de nanopartículas de TiO2 mostrando espaçamento entre franjas de 0,365 nm (d).]
Figure 5: FE-SEM micrographs of alkoxide and KTO derived TiO2 nanopowders heat treated at 550 and 900 °C. [Figura 5: Micrograias obtidas por microscopia eletrônica de varredura por emissão de campo de nanopós de TiO2 derivados de alcóxido e KTO calcinados a 550 e 900 °C.]
Figure 4: TEM micrographs of alkoxide-derived TiO2 nanopowder calcined at 550 °C.
[Figura 4: Micrograias obtidas por microscopia eletrônica de transmissão de nanopó de TiO2 derivado de alcóxido calcinado a 550 °C.]
a)
c)
b)
some rod like structures indicating directional growth in the sample. This type of morphology was not observed in other reported studies [15]. The grain size after heat treatment at 550 °C was substantially smaller, i.e. ~10 nm, which became about 53 nm after heat treatment at 900 °C.
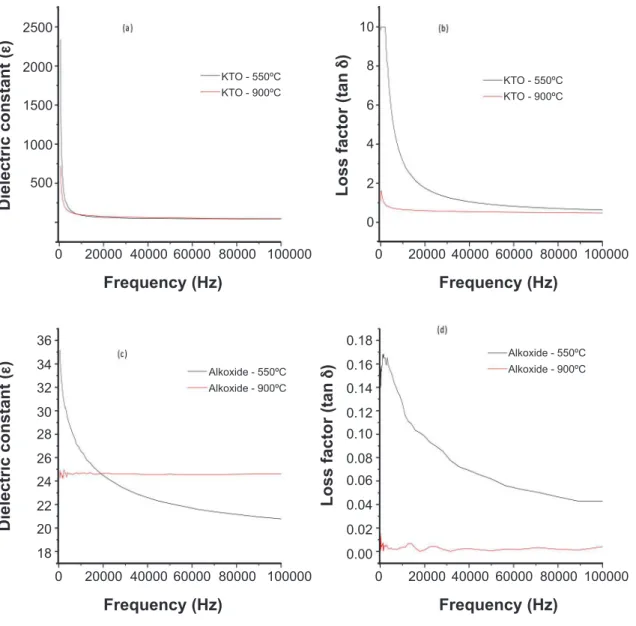
Dielectric constant of TiO2 nanoparticles decreased rapidly with the increase in the frequency (Fig. 6). Variation in the dielectric constant at lower frequency was attributed to space charge contribution rather than electronic and ionic contribution with the increase in frequency [33]. The ionic and electronic contribution became dominant and the space charge contribution diminished gradually. Hence dielectric constant decreased with the increase in frequency towards relatively constant value (relaxation behavior) at higher frequency. The average value of dielectric constant of the alkoxide-derived TiO2 samples increased with the increase in heat treatment temperature, which has not been reported
hitherto and remained almost constant with the change in frequency as reported in other works [34]. It indicated complete crystallization and phase transformation in the TiO2 sample (rutile phase) at the calcination temperature. The dielectric losses of the samples as a function of frequency are also shown in Fig. 6. The low frequency dielectric losses were related to the dielectric constant, electrical conductivity and point defect concentrations associated with reduction of Ti4+ to Ti3+ and associated oxygen vacancies. Dielectric losses are a strong function of frequency and at high frequency range for all samples the loss factor values achieved a saturation level at the present work. At high frequency, the dipoles can no longer follow the ield, therefore the loss factor remained constant. The constant loss factor values for the samples calcined at 900 °C can be related to the perfection in the crystal structure and restriction in the free dipolar oscillation due to the increase in packing density.
Figure 6: Dielectric constant and loss factor versus frequency of alkoxide and KTO derived TiO2 samples heat treated at 550
and 900 °C.
[Figura 6: Constante dielétrica e fator de perda versus frequência de amostras de TiO2 derivadas de alcóxido e KTO calcinadas a 550 e 900 °C.]
2500 10 6 2 8 4 0 1500 500 2000 1000 0 0 Frequency (Hz) D ie le c tr ic c o n s ta n t ( e ) L o s s fa c to r (ta n d ) L o s s fa c to r (ta n d ) D ie le c tr ic c o n s ta n t ( e ) Frequency (Hz) Frequency (Hz) Frequency (Hz) 0 0 20000 20000 20000 20000 60000 60000 60000 60000 40000 40000 40000 40000 80000 80000 80000 80000 100000 100000 100000 100000 36 0.18 0.14 0.10 0.06 0.02 0.16 0.12 0.08 0.04 0.00 28 20 32 24 34 26 18 30 22
KTO - 550ºC KTO - 550ºC
Alkoxide - 550ºC Alkoxide - 550ºC Alkoxide - 900ºC Alkoxide - 900ºC
The high value of dielectric constant for KTO-derived TiO2 NPs (almost 100 times than alkoxide-derived TiO2 NPs at low frequency) can be related to the incomplete crystallization and distortion in the crystallite. Here also with the increase in the frequency, the dielectric constant and loss values decreased and became almost constant at higher frequency range. The higher value of dielectric constant at low frequency can be related to the simultaneous presence of space charge, dipolar, ionic and electronic polarization. With the increase in the calcination temperature, dielectric constant values decreased which can be related to the increase in the packing density of the samples or decrease in the number of particles and grain boundary in the samples. However, for both cases dielectric constant assumed a constant value at high frequency region.
Vibrating sample magnetometer (VSM) was employed to measure the magnetic properties of the samples (Fig. 7). TiO2 synthesized from both precursors did not exhibit any ferromagnetism, rather it exhibited a diamagnetic behavior [35]. The intrinsic defect alone in TiO2 nanoparticle could not account for the observed ferromagnetism. Diamagnetic behavior in KTO-derived sample was more than the alkoxide-derived sample. The variation in magnetization with magnetic ield was more signiicant for KTO-derived sample compared to alkoxide derived sample. It can also be related to the incomplete crystallization or more crystalline defects in KTO-derived TiO2 sample.
CONCLUSIONS
Titania nanoparticles were synthesized by sol-gel methods using titanium (IV) isopropoxide and potassium titanium oxalate (KTO) precursors and calcined at 550 and 900 °C to compare the role of precursors on the particle
size, morphology, dielectric and magnetic properties of the synthesized TiO2 nanoparticles (NPs). XRD analysis of TiO2 NPs calcined at 550 °C revealed the presence of anatase phase for TiO2 derived from KTO and mixed phases of anatase and rutile for alkoxide-derived sample. Beyond rutile and anatase phases some Magnéli phases (TinO2n-1) of TiO2 were also present in the synthesized samples, particularly in KTO-derived samples. The proportion of rutile phase increased with the increase in the calcination temperature for the synthesized NPs. The XRD results also showed that the average crystallite size increased with the increase in calcination temperature and the surface area of these samples decreased signiicantly. The average particle size of KTO-derived NPs was signiicantly lower than the alkoxide-derived NPs. From FE-SEM study it was observed that TiO2 were primarily nanosized particles with larger spherical agglomerates for alkoxide-derived sample calcined at 550 °C. For KTO-derived sample with the increase in calcination temperature morphology of particles changed from irregular spherical structure to mixed platelet and rod like structure. TEM analysis for KTO-derived TiO2 indicated that the average crystallite size was about 11 nm in diameter which conirmed the XRD results. For alkoxide-derived TiO2 samples large grains with different crystallite types and with different densities were present in the microstructure. KTO-derived TiO2 exhibited higher value of dielectric constant due to incomplete crystallization and possible distortion in the crystallites. VSM studied revealed that synthesized TiO2 nanoparticles were diamagnetic. The change in magnetization with magnetic ield was more intense in KTO-derived TiO2 sample.
REFERENCES
[1] P.S. Peercy, Nature 406 (2000) 1023.
[2] B. O’Regan, M. Gratzel, Nature 353 (1991) 737. [3] U. Bach, D. Lupo, P. Comte, J.E. Moser, E. Weissortel, J. Salbeck, H. Spreitzer, M. Gratzel, Nature 395 (1998) 583. [4] G.N. Shao, S.M. Imran, S.J. Jeon, S.J. Kang, M.S. Haider, H.T. Kim, Appl. Surf. Sci. 351 (2015) 1213. [5] J.W. Shi, C. Xie, C. Liu, C. Gao, S. Yang, J.W. Chen, G. Li, Catal. Commun. 66 (2015) 46.
[6] Y. Liu, Y. Wu, Y. Zhou, Y. Wang, L. Yang, C. Li, Trans. Indian Ceram. Soc. 75, 3 (2016) 155.
[7] R.F. Service, Science 276, 5314 (1997) 895.
[8] S.A. Wolf, D.D. Awschalom, R.A. Buhrman, J.M. Daughton, S. Von Molnar, M.L. Roukes, A.Y. Chtchelkanova, D.M. Treger, Science 294, 5546 (2001) 1488.
[9] S. Takeda, S Suzuki, H. Odaka, H. Hosono, Thin Solid Films 392, 2 (2001) 338.
[10] K. Oganisian, A. Hreniak, A. Sikora, D.G. Koniarek, A. Iwan, Proc. Applic. Ceram. 9, 1 (2015) 43.
[11] F. Tolea, M.N. Grecu, V. Kuncser, S.G. Constantinescu, D. Ghica, Appl. Phys. Lett. 106 (2015) 142404.
[12] A.S. Bolokang, F.R. Cummings, B.P. Dhonge, H.M.I. Abdallah, T. Moyo, H.C. Swart, C.J. Arendse, T.F.G. Muller, D.E. Motaung, Appl. Surf. Sci. 331 (2015) 362.
0.014
0.010
0.006
0.002 0.012
0.008
0.004
0.000 -0.002
-0.006
-0.010 -0.004
-0.008
-0.012 -0.014
-20000
Ma
g
n
e
ti
za
ti
o
n
(e
m
u
/g
)
Magnetic ield (G)
20000 -10000 0 10000
Alkoxide - 550 ºC
KTO - 550 ºC
Figure 7: Magnetization versus magnetic ield for alkoxide and KTO derived TiO2 nanopowders heat treated at 550 °C.
[13] N.B. Chaure, A.K. Ray, R. Capan, Sci. Technol. 20 (2005) 788.
[14] A. Sharma, R.K. Khan, S.K. Pandhiyan, J. Basic Appl. Eng. Res. 1, 9 (2014) 1.
[15] Y. Bessekhouad, D. Robert, J.V. Weber, Int. J. Photo Eng. 5 (2003) 154.
[16] A. Karami, J. Iran. Chem. Soc. 7 (2010) 5154.
[17] H. Yang, K. Zhang, R. Shi, X. Li, X. Dang, Y. Yu, J. Alloys Compd. 413 (2006) 302.
[18] J. Joo, S.G. Kwon, T. Yu, M. Cho, J. Lee, J. Yoon, T. Hyen, J. Phys. Chem. B 109, 32 (2005) 15297.
[19] C. Wang, J.Y. Ying, Chem. Mater. 11, 11 (1999) 3113. [20] W. Li, C. Ni, H. Lin, C.P. Huang, S. Ismat Shah, J. Appl. Phys. 96, 11 (2004) 6663.
[21] D. Maheswari, P. Venkatachalam, IOSR J. Electron. Commun. Eng. 4, 4 (2013) 29.
[22] B. Choudhury, A. Choudhury, Mater. Chem. Phys. 131, 3 (2012) 666.
[23] G.K. Williamson, W.H. Hall, Acta Metall. 1, 1 (1953) 22.
[24] R.R. Prabhu, M.A. Khadar, Bull. Mater. Sci. 31, 3 (2008) 511.
[25] S. Velusamy, P. Vickraman, M. Jayachandran, J. Mater. Sci. Mater. Electron. 21, 4 (2010) 343.
[26] A.K. Tripathi, M.C. Mathpal, P. Kumar, M.K. Singh, S.K. Mishra, R.K. Srivastava, J.S. Chung, G. Verma, M.M. Ahmad, A. Agarwal, Adv. Mater. Lett. 6, 3 (2015) 201. [27] A. Maurya, P. Chauhan, S.K. Mishra, R.K. Srivastava, J. Alloys Compd. 509, 33 (2011) 8433.
[28] A.I. Kingon, J.P. Maria, S.K. Streiffer, Nature 406 (2000) 1032.
[29] X. Zhong, I. Rungger, P. Zapol, O. Heinonen, Phys. Rev. B 91 (2015) 115143.
[30] S.S. Mali, C.A. Betty, P.N. Bhosale, P.S. Patil, Cryst. Eng. Comm. 13 (2011) 6349.
[31] C. Rath, P. Mohanty, A.C. Pandey, N.C. Mishra, J. Phys. D Appl. Phys. 42 (2009) 205101.
[32] R.D. Shannon, J. Appl. Phys. 35, 11 (1964) 3414. [33] A. Kumar, B.P. Singh, R.N.P. Choudhary, A.K. Thakur, Mater. Chem. Phys. 99 (2006) 150.
[34] S. Sagadevan, J. Nanosci. Nanotechnol. 1, 1 (2013) 27. [35] S.D. Delekar, H.M. Yadav, S.N. Achary, S.S. Meena, S.H. Pawar, Appl. Surf. Sci. 263 (2012) 536.