www.atmos-chem-phys.net/13/3587/2013/ doi:10.5194/acp-13-3587-2013
© Author(s) 2013. CC Attribution 3.0 License.
Atmospheric
Chemistry
and Physics
Geoscientiic
Geoscientiic
Geoscientiic
Geoscientiic
Modeling of daytime HONO vertical gradients during SHARP 2009
K. W. Wong1,*, C. Tsai1, B. Lefer2, N. Grossberg2, and J. Stutz1
1Department of Atmospheric and Oceanic Sciences, University of California Los Angeles, Los Angeles, CA 90095, USA 2Department of Earth and Atmospheric Science, University of Houston, Houston, TX 77204-5007, USA
*now at: Jet Propulsion Laboratory, California Institute of Technology, Pasadena, CA 91109, USA Correspondence to:J. Stutz ([email protected])
Received: 11 September 2012 – Published in Atmos. Chem. Phys. Discuss.: 23 October 2012 Revised: 7 March 2013 – Accepted: 8 March 2013 – Published: 2 April 2013
Abstract.Nitrous acid (HONO) acts as a major precursor of the hydroxyl radical (OH) in the urban atmospheric bound-ary layer in the morning and throughout the day. Despite its importance, HONO formation mechanisms are not yet com-pletely understood. It is generally accepted that conversion of NO2on surfaces in the presence of water is responsible
for the formation of HONO in the nocturnal boundary layer, although the type of surface on which the mechanism occurs is still under debate. Recent observations of higher than ex-pected daytime HONO concentrations in both urban and ru-ral areas indicate the presence of unknown daytime HONO source(s). Various formation pathways in the gas phase, and on aerosol and ground surfaces have been proposed to ex-plain the presence of daytime HONO. However, it is unclear which mechanism dominates and, in the cases of heteroge-neous mechanisms, on which surfaces they occur.
Vertical concentration profiles of HONO and its precur-sors can help in identifying the dominant HONO formation pathways. In this study, daytime HONO and NO2 vertical
profiles, measured in three different height intervals (20–70, 70–130, and 130–300 m) in Houston, TX, during the 2009 Study of Houston Atmospheric Radical Precursors (SHARP) are analyzed using a one-dimensional (1-D) chemistry and transport model. Model results with various HONO forma-tion pathways suggested in the literature are compared to the the daytime HONO and HONO/NO2ratios observed during
SHARP. The best agreement of HONO and HONO/NO2
ra-tios between model and observations is achieved by includ-ing both a photolytic source of HONO at the ground and on the aerosol. Model sensitivity studies show that the ob-served diurnal variations of the HONO/NO2ratio are not
re-produced by the model if there is only a photolytic HONO source on aerosol or in the gas phase from NO∗
2+ H2O.
Fur-ther analysis of the formation and loss pathways of HONO shows a vertical dependence of HONO chemistry during the day. Photolytic HONO formation at the ground is the major formation pathway in the lowest 20 m, while a combination of gas-phase, photolytic formation on aerosol, and vertical transport is responsible for daytime HONO between 200– 300 m a.g.l. HONO removal is dominated by vertical trans-port below 20 m and photolysis between 200–300 m a.g.l.
1 Introduction
Early observations of nitrous acid (HONO) in the polluted ur-ban atmosphere were made by differential optical absorption spectroscopy (DOAS) by Platt et al. (1980), who pointed out its role as a hydroxyl radical (OH) precursor in the morning. It has since been recognized that HONO photolysis (Reac-tion R1) plays an important role in initiating daytime photo-chemistry.
HONO+hν λ<−→400 nmOH+NO (R1) During the day, HONO has long been expected to reach a pseudo steady state between its photolysis (Reaction R1), gas-phase reaction with OH (Reaction R2), and gas-phase formation from NO and OH (Reaction R3). The theoretical pseudo steady-state HONO mixing ratio is in the low ppt (for the remainder of the manuscript we will use ppt as the equiv-alent of pmol mol−1)levels in most areas (Kleffmann, 2007).
HONO+OH −→NO2+H2O (R2)
However, recent field observations show that daytime HONO concentrations can be substantially higher than the theoret-ical steady-state mixing ratio, reaching up to a few hun-dred ppt in urban and rural areas (Kleffmann et al., 2005; Acker et al., 2006a; Zhou et al., 2007; Wong et al., 2012). These elevated daytime HONO mixing ratios indicate the presence of unknown HONO formation mechanisms, which make HONO also a significant OH precursor throughout the day. Various studies show that up to 55 % of the total OH budget during the day can be attributed to HONO photoly-sis in the morning and throughout the day (Mao et al., 2010; Elshorbany et al., 2009; Acker et al., 2006b; Kleffmann et al., 2005; Aumont et al., 2003). The formation rate of daytime HONO by unknown pathways has been estimated in rural and urban regions in the range of 1–35 × 106molec cm−3s−1
(Acker et al., 2006a; Zhang et al., 2009; Elshorbany et al., 2009; Kleffmann et al., 2005; Zhou et al., 2002; Su et al., 2008; S¨orgel et al., 2011a; Ren et al., 2010).
Based on recent laboratory and field experiments various photolytic formation pathways occurring in the gas phase and on aerosol/ground surfaces have been proposed to explain the observed daytime HONO levels (Li et al., 2008; Stemmler et al., 2006; George et al., 2005; Zhou et al., 2007; Kleff-mann, 2007). Potential daytime gas-phase formation path-ways of HONO include the reaction of photoexcited NO2,
NO∗
2, with water vapor, as proposed by Li et al. (2008), and
photolysis of ortho-nitrophenols, as proposed by Bejan et al. (2006). Heterogeneous NO2to HONO conversion was
pro-posed to be enhanced by solar irradiance on some types of surfaces. These surfaces include those coated with phenols and aromatic ketones as proposed by George et al. (2005) and humic acids and soil as suggested by Stemmler et al. (2006, 2007). Another proposed daytime HONO formation mechanism is the photolysis of surface adsorbed nitric acid (HNO3)(Zhou et al., 2007; He et al., 2006; Beine et al.,
2002; Dibb et al., 2002; Zhou et al., 2002, 2003, 2011). Both of these heterogeneous formation pathways, NO2conversion
and photolysis of HNO3, can potentially occur on aerosol and
ground surfaces. Recently, Su et al. (2011) also proposed the release of soil nitrite as a possible HONO source.
The study of HONO sources is challenging as it requires the separation of processes occurring in the gas phase, the aerosol, and on ground surfaces. Observations of the ver-tical distribution of HONO and its precursors in the day-time boundary layer can carry important information on the sources and formation of HONO. For instance, a strong tinuous ground source of HONO would lead to higher con-centrations near the ground, while formation on aerosol sur-faces should lead to a relatively uniform HONO vertical boundary layer distribution, assuming the most likely case, that the aerosol profile is uniform in the daytime boundary layer. Similarly, gas-phase sources in a well-mixed boundary layer should also, in principle, lead to a fairly uniform HONO vertical distribution. However, only a few observational stud-ies have been performed to measure daytime HONO
verti-cal profiles (Kleffmann, 2007; Zhang et al., 2009; Villena et al., 2011; Zhou et al., 2001; H¨aseler et al., 2009). The re-sults from these studies are not conclusive. Kleffmann (2007) did not observe significant vertical HONO gradients in the lowest 190 m of the atmosphere in a semi-rural area in Ger-many. Similarly, S¨orgel et al. (2011b) did not observe gra-dients in the lowest 25 m of a forest. In contrast, Villena et al. (2011) found elevated levels of HONO at 6 m com-pared to 53 m altitude in a polluted urban area. Two air-craft observations have been reported. Zhang et al. (2009) reported negative concentration profiles up to 2500 m alti-tude, while H¨aseler et al. (2009) observed no gradients in the lowest 1000 m of the atmosphere. Flux measurements of HONO have been carried out to study the daytime sources of HONO. Zhou et al. (2011) reported HONO fluxes in a forest canopy, with a peak flux at noon of 1 × 10¹⁰molec cm−2s−1.
Another study by the same group measured HONO flux over arctic snow and reported maximum HONO fluxes of 1 × 10⁹molec cm−2s−1. Ren et al. (2011) reported HONO
fluxes of up to 6 × 10⁹molec cm−2s−1 in Bakersfield, CA,
and a strong correlation of the flux with NO2and solar
radi-ation, while the fluxes over a forest were close to zero. In addition to observations of vertical profiles, atmo-spheric chemistry and transport models are often necessary to test and validate the potential HONO formation mecha-nism. So far, there have been very limited modeling stud-ies on daytime HONO focusing on vertical gradients. Vo-gel et al. (2003) used a 1-D chemistry and transport model to reproduce tower measurements of daytime HONO verti-cal gradients in Germany (Kleffmann, 2007). Their model, which took into account HONO emissions, gas-phase forma-tion and heterogeneous formaforma-tion, underestimated daytime HONO concentrations by 30–50 %. Inclusion of a photolytic HONO source, which was proportional to the NO2
photol-ysis frequency, lead to much better agreement between the modeled and the observed HONO concentrations. Aumont et al. (2003) used a two layer box-model to study the contri-bution of HONO photolysis to the OH budget, but no obser-vation of HONO was available to validate the HONO sim-ulations. Their study showed that when HONO emission, gas-phase reaction and heterogeneous formation on ground and aerosol were considered in the model, daytime HONO was a significant source of OH in wintertime conditions. A few 3-D model studies on HONO have been published re-cently (Czader et al., 2012; Gonc¸alves et al., 2012; Sarwar et al., 2008, 2009). Most of these studies did not analyze the vertical distribution of HONO in detail. Only Czader et al. (2012) showed a comparison of LP-DOAS (long-path dif-ferential optical absorption spectroscopy instrument) profile data with their model. They also concluded that a surface for-mation mechanism was necessary to improve HONO levels simulated by the model.
ratios were measured at three altitude intervals in Houston, TX, in spring 2009. Analysis of the observational data of HONO, NO2 and HONO/NO2 ratios showed the presence
of a photolytic HONO source, which exhibited a dependence on NO2concentrations and solar irradiance. The conversion
of NO2to HONO was most likely occurring on the ground,
rather than on aerosol or in the gas-phase (Wong et al., 2012). Here we will further expand this analysis by using a 1-D at-mospheric chemistry and transport model to understand the observed vertical profiles of HONO, NO2and HONO/NO2
ratios in Houston, TX. Model runs that include parameteriza-tions of the various proposed HONO formation mechanisms are compared to the field observations to identify the domi-nant processes. The altitude dependence of daytime HONO chemistry will also be investigated.
2 Approach
2.1 Experimental
Daytime HONO and NO2vertical mixing ratio profiles were
measured from 20 April to 30 May during the 2009 Study of Houston Atmospheric Radical Precursors (SHARP), in Houston, TX, using UCLA’s (University of California Los Angeles) long-path differential optical absorption spec-troscopy instrument. The LP-DOAS instrument was set up on the roof of the North Moody Tower on the campus of the University of Houston, at an altitude of about 70 m above the ground. The instrument sent a collimated beam of light from a Xe arc lamp onto three retroreflectors, which were mounted on the top of three buildings located in downtown Houston at distances of 4.1, 5.05, and 5.15 km from the Moody Tower at altitudes of 20, 130, and 300 m a.g.l., respectively). The LP-DOAS telescope was aimed consecutively at these retrore-flectors to measure the absorptions of HONO and NO2
be-tween the University of Houston and downtown Houston. The retrieved mixing ratios were horizontally averaged be-tween the Moody Tower and downtown Houston and ver-tically averaged over the LP-DOAS height intervals: lower (20–70 m), middle (70–130 m), and upper (130–300 m). De-tails of the experiment and data analysis are described in Wong et al. (2012) and references therein. Our analysis will focus on the same sunny days as outlined in Wong et al. (2012): 21 April, 17 and 18 May. These days were chosen as they provided the only cloud free conditions that allow a rigorous analysis of HONO chemistry.
2.2 Model description
To more quantitatively understand the observations of HONO vertical profiles, which are the results of a combi-nation of chemistry and vertical mixing, we employ a 1-D chemistry and transport model. The purpose of the model is to help distinguish between the different formation processes outlined above and to help understand how HONO chemistry
changes with altitude, rather than to model the entire bound-ary layer chemical system. We will, therefore, focus on the model output of NO2, HONO and HONO/NO2ratios.
We use RCAT8.2, a vertically highly resolved chem-istry and transport model, which includes the gas-phase Re-gional Atmospheric Chemistry Mechanism (RACM), 84 re-active species and 244 gas-phase chemical reactions (Stock-well et al., 1997). RCAT has been successfully used to describe nocturnal HONO formation and vertical profiles (Wong et al., 2011), to investigate the impact of nocturnal processes on daytime chemistry (Wong and Stutz, 2010), and most recently to investigate the impact of NO3 photolysis
from artificial light sources (Stark et al., 2011). As the model has been described in detail previously, only a short descrip-tion will be given here. A detailed descripdescrip-tion of the param-eterization of HONO will be given in Sect. 2.2.1.
The model subdivides the lowest 3000 m into 32 grid cells, including 5 grid cells with cell heights decreasing logarith-mically below 1 m to take into account the inefficient vertical transport near the ground. Vertical exchange of trace species between adjacent boxes occurs through turbulent diffusion, as well as molecular diffusion in the lowest millimeters above the surface, as chemical reactions take place simultaneously at all altitudes. RCAT8.2 considers temporally varying an-thropogenic emissions, predominately from traffic between 0.1 m and 1 m altitude, as well as biogenic emissions at the ground and between 1 m and 10 m altitude. Anthropogenic VOC (volatile organic compounds) and NOx emissions are
linked in the model using emission ratios based on Kurten-bach et al. (2001, 2002). Surface uptake resulting in dry de-position and chemistry on aerosol and ground surfaces are in-cluded as well. Chemistry in the liquid phase is currently not considered in the model. Photolysis frequencies of chemical species are calculated based on Landgraf and Crutzen (1998) and are approximated by a sine function, which turns posi-tive after the time of sunrise. Photolysis rates were compared with observations during SHARP to ensure their accuracy.
The chemistry of molecules on the ground surface, includ-ing that of HONO and NO2, is calculated from the
num-ber of molecules in the lowest grid cell colliding with the ground and the respective uptake coefficients (Wong and Stutz, 2010). The ground is assumed to be flat in the model and no buildings or trees are considered. The uptake rates of trace gases, including HONO and NO2, on aerosols are
de-termined from the aerosol surface area density and the uptake coefficients according to the mass transfer equation given by Fuchs and Sutugin (1971) and assuming an average particle diameter of 150 nm. The aerosol vertical profile is assumed to be uniform in the boundary layer.
Vertical transport of trace gases,j, is calculated based on a flux-gradient relationship of concentration of trace gas,C, and eddy diffusivity,Kz(Geyer and Stutz, 2004). Eddy dif-fusivity is calculated by the Monin–Obukhov theory with the Von K´arm´an constantκ, the friction velocityu∗
and stability through the Obukhov lengthL(Businger et al., 1971; Stull, 1988).
j (z, t )= −Kz(z, t )· ∂C (z, t )
∂z where Kz(z, t )=
κ·u∗(t )·z
8(Lz, t ) (1)
As the purpose of the model for this study is solely the in-vestigation of HONO chemistry, we use observations of NO2
vertical profiles to constrain NOxemissions and vertical
mix-ing. This comparison is achieved by averaging the model re-sults over the LP-DOAS height intervals. The rere-sults of this comparison will be discussed below.
2.2.1 Parameterization of HONO chemistry
We started our analysis using the RCAT8.2 version, which was previously used for modeling of nocturnal HONO (Wong et al., 2011). In this version the main HONO sources include direct emissions from cars with an emission ratio HONO/NOx=0.008 between 0.1 m and 1 m altitude, based
on the tunnel measurement from Kurtenbach et al. (2001). Gas-phase formation of HONO results from the reaction of NO with OH (Reaction R3). HONO is also formed from con-version of NO2on aerosol and ground surfaces, with a yield
of 50 % following the stoichiometry of this reaction mecha-nism and an NO2reactive uptake coefficient of 10−5(Trick,
2004). HONO loss reactions in the model include HONO photolysis (Reaction R1), and the HONO reaction with OH (Reaction R2). In addition, HONO is taken up on aerosol and ground surfaces with reactive uptake coefficients of 10−3
and 2×10⁻⁵, respectively, which were used in our previous
modeling studies (Wong et al., 2011). We will refer to this parameterization of HONO chemistry as the base case here. It should be added that this model performed well for noctur-nal conditions, as shown in Wong et al. (2011).
As previously mentioned, and also discussed below in more detail, the HONO formation mechanisms at night are insufficient to explain daytime HONO levels. We have thus also included parameterizations for three different photolyti-cally enhanced daytime formation mechanisms:
Conversion on the ground
According to our previous analysis of daytime HONO obser-vations in Houston (Wong et al., 2012), photolytic conver-sion of NO2at the ground, proportional to [NO2] and solar
irradiance, was the most likely source of daytime HONO. Following this idea, we developed a parameterization for this source, which is based on a sunlight dependent NO2to
HONO reactive uptake coefficient at the ground.
As our model, like most other atmospheric chemistry mod-els, relies on a parameterization of the actinic flux/photolysis rates to describe the influence of sunlight on atmospheric chemistry, we first developed a description of solar irradi-ance as a function of the photolysis rate of NO2,JNO2. The following equation, which normalizes solar irradiance to 1 at
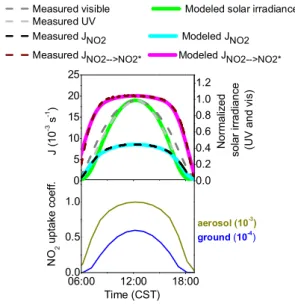
Fig. 1.Upper panel: time series of measured NO2photolysis
fre-quenciesJNO2, photolysis frequency of NO2to NO∗
2,JNO2→NO2∗,
normalized solar visible irradiance, and UV irradiance are shown as dashed lines (see Wong et al., 2012 for details on the observations).
ModeledJNO2, JNO2→NO2∗ and normalized solar irradiance are
shown as thick lines. Lower panel: time series of calculated reactive
NO2uptake coefficient on the ground and on aerosol in model runs
2 and 3.
noon and is based on a cubic dependence onJNO2, was found to be the simplest description of the diurnal variation of solar irradiance:
Irradiance = Max.Irradiance·
JNO3
2
JNO3
2at noon
(2) We validated this parameterization with a comparison to the observations of solar irradiance during the three focus days (see Fig. 1). The modeled solar irradiance is within 5 % of the observed UV solar irradiance, which we found previously to better correlate with the photolytic surface source of HONO than the visible solar irradiance (Wong et al., 2012). To over-come the lack of quantitative information on the magnitude of photoenhanced NO2to HONO surface conversion on real
ground surfaces in the atmosphere, we adjusted the reactive uptake coefficient describing the conversion in model test runs for one day and then applied the result to all other days. The result of this procedure was an uptake coefficient of zero at the time of sunrise and sunset and a maximum of 6 × 10⁻⁵
at noon. Following laboratory findings (for example George et al., 2005; Stemmler et al., 2006), we assumed a 100 % yield of HONO for every NO2molecule being taken up. The
final parameterization of the solar irradiance dependent re-active uptake coefficient describing the photoenhanced con-version of NO2on the ground was then (see also Table 1)
γNO2ground =6×10
−5· J 3 NO2
JNO3
2at noon
It should be noted that we used this parameterization for all days we analyzed in this study.
Conversion on aerosol
Similar to the parameterization of photolytic HONO for-mation at the ground, the photolytic HONO forfor-mation on aerosol was parameterized by a NO2to HONO reactive
up-take coefficient that is a function of the photolysis of NO2.
γNO2aerosol = 1×10
−3 JNO2
JNO2at noon
(4)
Again the, otherwise unknown, multiplicative factor in this expression was chosen to simulate the HONO levels well on the first day and was then applied to the other days as well.
Gas-phase formation
The only photoenhanced gas-phase reaction parameterized in the model is through the reaction of photoexcited NO2with
water vapor, based on the numbers by Li et al. (2008). NO2+hν (λ>420 nm)→NO∗2 (R4)
NO∗2−→M NO2 (R5)
NO∗
2+H2O→OH+HONO (R6)
These three reactions were included in the model. The pho-toexcitation frequency of NO2to NO∗2(JNO2→NO∗
2) was pa-rameterized using a sine function in the model to match it to the observations (Fig. 1). In Sect. 4 we will describe the results of the various parameterizations.
2.2.2 Model initialization
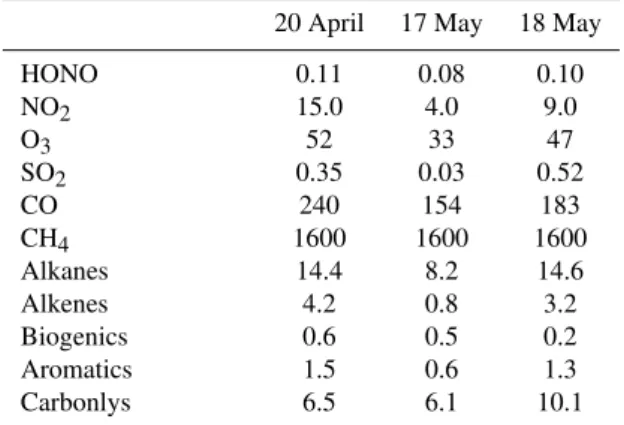
The model was initialized at the beginning of the night pre-vious to the respective modeled days, 21 April, 18 and 19 May, using observed concentrations at 18:50 CST (central standard time) on 20 April 2009 and 19:10 CST on 17 and 18 May 2009. LP-DOAS observations of HONO, NO2, O3
and SO2profiles and in situ CO mixing ratios at 70 m were
used. Observed volatile organic compounds concentrations at 70 m, assumed to be constant at all heights, were used in all three model runs (T. Jobson, personal communication, 2010) (Table 2). Aerosol surface area densities of 170, 85 and 180 µm2cm−3were used in the model runs of 21 April, 18
and 19 May, respectively. These are diurnal averaged aerosol surface area concentrations measured on these days by Rice University and Texas A&M University (R. Griffin, C. Reed and D. Collins, personal communication, 2010).
As previously described in Geyer and Stutz (2004), noc-turnal vertical profiles of most trace gases depend strongly on two factors: vertical stability and NOxemission rates. Both
parameters are not known well enough for the SHARP data
Fig. 2.HONO emission rate in the altitude interval between 0.1–1 m due to traffic in the model.
to allow an accurate modeling of nocturnal chemistry. To en-sure that we describe these two factors correctly before we attempt to simulate HONO profiles, NOxemission rates and
vertical mixing were adjusted at each hour at night to make the modeled temporal and vertical profiles of NO2 and O3
fit the measurement. Vertical mixing was adjusted indirectly by varying the Monin–Obukhov length, which was used to calculate the eddy diffusivity. This method was used in our previous modeling studies on nocturnal HONO profiles in Houston, TX, in 2006 (Wong et al., 2011). Sunrise and the onset of photolysis occurred at model hour 11 (or 05:50 CST) on 21 April, 10.25 (or 05:25 CST) on 18 and 19 May.
Daytime boundary layer height measurements performed by the University of Houston during SHARP were used in the model. Boundary layer heights increased from 130, 160 and 100 m at sunrise to 1500, 2800 and 2000 m in the after-noon on 21 April, 18 and May 19, respectively. Due to the lack of micrometeorological observations during the exper-iment, vertical mixing during the day is assumed to have a maximum at noontime, when solar radiation peaks, for all model runs. This assumption is supported by previous mea-surements of eddy diffusivity (Horv´ath et al, 1998; Constant et al., 2008). In order to reproduce the daytime NO2
ob-servations, the daytime NOx emissions were also adjusted.
NOx emission rates for all three modeling periods were
characterized by a morning rush hour period, which peaks at 07:00 CST at about (3–4)×1010molec cm−3s−1, and an
broad afternoon rush hour, which starts at about 02:00 CST. The shape of the NOxemission profile is similar to those
re-ported by Berkowicz et al. (2006) and Marr et al. (2002). As the HONO emission rate was linked to that of NOx, it was
thus also adjusted accordingly, as shown in Fig. 2. Vertical mixing during the day is assumed to be at a maximum at noontime for all model runs.
Table 1.Summary of different model runs.
Model runs
Photolytic HONO source
Photolytic HONO formation reactions or parameterizations
1 None None
2 NO2 conversion at the
ground only
γNO2ground= 6 × 10
−5· J 3 NO2 J3
NO2 at noon
, HONO yield=100 %
3 NO2 conversion on
aerosol only
γNO2aerosol=1 × 10
−3· JNO2
JNO2 at noon, HONO yield=100 %
4 Gas phase NO +hν(λ >420 nm)→NO∗2
NO∗2−→M NO2
NO∗
2+H2O→OH+HONO
5 NO2 conversion at the
ground and on aerosol
Ground:γNO2ground=6 × 10
−5· JNO23 J3
NO2 at noon
, HONO yield=100 %
Aerosol:γNO2aerosol=4 × 10
−4· JNO2
JNO2 at noon, HONO yield=100 %
Table 2.Initial concentrations in the model in ppb.
20 April 17 May 18 May
HONO 0.11 0.08 0.10
NO2 15.0 4.0 9.0
O3 52 33 47
SO2 0.35 0.03 0.52
CO 240 154 183
CH4 1600 1600 1600
Alkanes 14.4 8.2 14.6
Alkenes 4.2 0.8 3.2
Biogenics 0.6 0.5 0.2
Aromatics 1.5 0.6 1.3
Carbonlys 6.5 6.1 10.1
3 Results
We applied our different parameterizations to three days dur-ing the SHARP experiment: 21 April, 18 and 19 May. These days were the cloud free days during the experiment that we used in our previous analysis (Wong et al., 2012). The smooth diurnal variation of solar irradiance and actinic flux makes the interpretation of HONO chemistry considerably easier. While our model runs included 10–11 h before sun-rise, we will only show the model results and observations of HONO, NO2and HONO/NO2ratio from 06:00 to 18:00 CST
here. The ability of our model to describe nocturnal vertical profiles of NO2 and HONO has been described in detail in
Wong et al. (2011), and will not be repeated here. While the model results of other trace gases have been compared to ob-servations to ensure that we capture daytime chemistry, we will not show these comparisons here, as the vertical profiles of NO2and HONO are most relevant for this study. It should
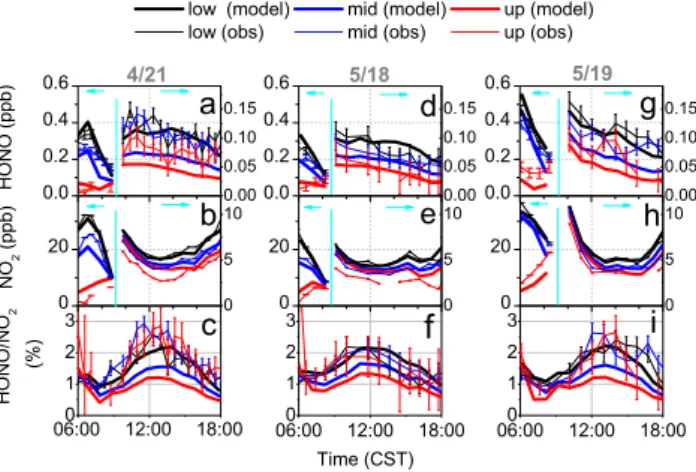
Fig. 3.Comparisons between observations and model results
with-out photolytic HONO source. Shown here are daytime HONO(a, d,
g), NO2(b, e, h), and HONO/NO2ratio(c, f, i)in the lower (black), middle (blue), and upper (red) height altitudes on 21 April (left panel), 18 May (middle panel), and 19 May (right panel). HONO
and NO2mixing ratios after 09:00 CST were magnified with a
dif-ferent scale on the right axis. Error bars in this figure, and all fol-lowing figures, represent the 1-sigma statistical uncertainty of the measurements (Wong et al., 2012).
also be noted that in all cases, we applied the same parame-terizations of HONO chemistry for all three days.
3.1 Base model run without photolytic HONO source
The base model run (No. 1, Table 1) is solely based on the dark conversion of NO2to HONO that was initially
imple-mented in our nocturnal model exercise (Wong et al., 2011). Modeled NO2, shown as mixing ratios vertically
h), showed good agreement with the observations. The model was able to capture the morning rush hour peaks of NO2
in the lower and middle height intervals on all three days. The modeled NO2 mixing ratios in the middle height
inter-vals were slightly lower than the observations on 21 April. NO2 mixing ratios in the upper height intervals were
over-estimated on 21 April and 18 May, but were underpredicted on 19 May. Boundary layer height estimated from aerosol backscatter measurements indicated that the upper height in-terval was in the residual layer in the early morning (Wong et al., 2012). Modeling of vertical mixing is challenging dur-ing this period of transition from a stable to a well-mixed boundary layer. Despite the adjustment of vertical mixing, the model most likely did not accurately capture the timing of the onset of enhanced daytime vertical mixing and height of the morning boundary layer (Wong et al., 2011). Never-theless, the model captured the general features of the ob-servations, i.e., the decrease of NO2vertical gradients due to
photolysis and vertical mixing for all three days.
Throughout the rest of the day, modeled NO2mixing
ra-tios followed the observations closely, with a steady decrease towards a minimum around, or shortly after, noon, and a slow increase towards the evening. This behavior can be partially explained by the shift in the NO-NO2photostationary steady
state as the NO2photolysis rate varied throughout the day.
The smoothness in the observations, which makes modeling considerably easier, stems from the horizontal path averag-ing of the LP-DOAS, as well as from the fairly constant me-teorological conditions during these days. On all three days, daytime NO2mixing ratios remained below 10 ppb.
Vertical gradients of NO2were observed on all three days,
with lower mixing ratios aloft. The model reproduced the presence of gradients on all three days, except that the model tended to overestimate the NO2 mixing ratios in the upper
height intervals on 21 April and 18 May. The reason for the overestimate may be due to the fact that our model did not capture mixing above 150 m correctly or that there was an influence from advection. Despite some of the discrepancies in the comparison of the model with the observations, the model generally captured the modeled NO2 mixing ratios
and vertical profiles well enough to allow a detailed analy-sis of HONO chemistry.
Early morning HONO mixing ratios in the model agreed well with the observations on all three days (Fig. 3a, d, g). The morning HONO peaks in the lower height intervals tended to be slightly overestimated by the model. This can be caused by the overestimated HONO/NOx emission ratio
in the model, since traffic is a significant source of HONO during the early morning rush hour, as shown in Wong et al. (2011). The decrease of HONO concentrations and vertical gradients due to photolysis and vertical mixing was repro-duced well in the model. However, after 09:00 CST the mod-eled HONO mixing ratios were much smaller than the ob-served mixing ratios on all three days. Small vertical gradi-ents were simulated by the model, as expected from the
pho-tolysis of HONO as it is mixed upwards from the ground. The modeled HONO mixing ratios of 0.05 ppb or less in all three height intervals describe only 50 % or less of the observed mixing ratios on 21 April and 19 May. Only in the upper height interval on 18 May do the modeled HONO mixing ratios fall within the error bars of the observed HONO mix-ing ratios. Daytime HONO durmix-ing this model run was pre-dominately from the gas-phase formation from NO and OH. Contribution from the dark heterogeneous conversion at the ground is less significant. The underestimated HONO mix-ing ratios in the model clearly indicated a missmix-ing daytime HONO source in the base model run, confirming previous findings about a missing daytime HONO source.
As explained in detail in Wong et al. (2012), the HONO/NO2 ratios offer unique insight into the chemistry
of HONO, which for most of the proposed mechanisms in-volves NO2. Consequently, the HONO/NO2ratios were also
compared between the model results and the observations (Fig. 3c, f, i). In the very early morning, the model shows good agreement with the observations for all three days. This is mostly explained by the dominance of direct emissions and HONO left over from the previous night. However, for the rest of the day, the model was unable to reproduce the observed magnitude or diurnal variation of the HONO/NO2
ratios. The observed ratios increased in the morning and reached a maximum at about 2–3 % around noontime, while the modeled ratios stayed below 1 % and did not show a strong diurnal variation. This again confirms the lack of a daytime HONO source in our base model case.
3.2 Model runs with photolytic HONO source at the
ground
From the comparison of the modeled HONO and HONO/NO2ratios in the base case, it is clear that an
addi-tional source of HONO during the day is necessary to de-scribe the observations. Our previous analysis, which was based on a correlation analysis of this missing HONO source with solar irradiance and actinic flux, indicated that the most likely source of daytime HONO was a photo-enhanced con-version at the ground (Wong et al., 2012). Consequently, we performed additional model runs for the three focus days with this source included. As discussed above, the diurnal variation of this source was linked to observed variations of the solar irradiance in Houston. The magnitude of this source, however, was adapted to explain the observed HONO mixing ratios. The maximum reactive NO2→HONO uptake
coefficient that best explained our observations was found to be 6 × 10⁻⁵, which is larger than, but of the same order
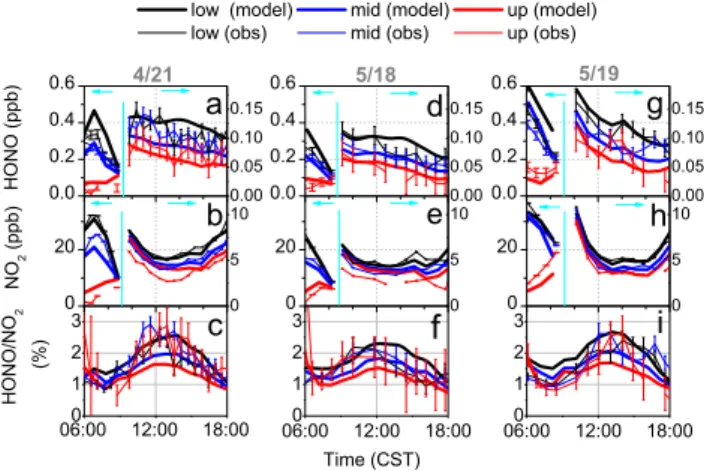
Fig. 4.Comparisons between observations and model results with a photolytic HONO source at the ground. Shown here are daytime HONO(a, d, g), NO2(b, e, h), and HONO/NO2ratios(c, f, i)in the lower (black), middle (blue), and upper (red) height altitudes on 21 April (left panel), 18 May (middle panel), and 19 May (right panel).
HONO and NO2mixing ratios after 09:00 CST were magnified with
a different scale on the right axis.
was to slightly increase (by 5 %) the NOxemissions, in order
to compensate for the higher NO2loss in the model due to its
conversion to HONO.
After the photolytic HONO source at the ground was im-plemented in the model, the daytime HONO mixing ratios were significantly increased (Fig. 4). HONO mixing ratios in the lower height intervals showed much better agreement be-tween the model and the observations on all three days. The modeled HONO mixing ratios in the lower height intervals were typically within ± 20 % of the observations, and often within the errors of the observations. On 18 May, the mod-eled HONO mixing ratios in the middle and upper height in-tervals were also within the errors of the observed mixing ra-tios. However, on 21 April and 19 May, the modeled HONO mixing ratios in the middle and upper height intervals were still smaller than those observed.
The modeled HONO/NO2ratios also showed much better
agreement with the observed ratios. In particular, the mod-eled HONO/NO2 ratios showed the observed diurnal
vari-ations, with a maximum of around 2 % at noon. However, consistent vertical gradients of HONO/NO2 ratios, which
were not observed, were simulated by the model. While the HONO/NO2ratios in the lowest height intervals showed
good agreement with the observations, the ratios in the mid-dle and upper height intervals were underpredicted by as much as a factor of two by the model.
The low HONO mixing ratios and low HONO/NO2
ra-tios in the middle and upper height intervals in the model suggested that either an additional HONO source existed aloft, or that the loss, which proceeds predominately though HONO photolysis, was too large, as HONO formed at the surface is mixed upwards. We investigated the possibility that
Fig. 5.Comparisons between observations and model results with a photolytic HONO source on aerosol only. Shown here are daytime HONO(a, d, g), NO2(b, e, h), and HONO/NO2ratios(c, f, i)in the lower (black), middle (blue), and upper (red) height altitudes on 21 April (left panel), 18 May (middle panel), and 19 May (right panel).
HONO and NO2mixing ratios after 09:00 CST were magnified with
a different scale on the right axis.
mixing in the model is too slow, leading to a much faster de-cay of HONO with altitude. However, any attempt to increase vertical mixing in the model led to unrealistic vertical gradi-ents of NO2and other trace gases (not shown). We therefore
concluded that the most likely reason for low HONO aloft in the model is the presence of another HONO source (see Sect. 3.4).
3.3 Model runs with source on aerosol or in gas phase only
To test if our observations of daytime HONO could be ex-plained by photoenhanced conversion of NO2on the aerosol
or through the gas-phase reaction of NO∗
2with water vapor
(see Table 1), we performed two sets of model runs with each of these formation mechanisms (Figs. 5 and 6).
Model runs with a daytime HONO source on aerosol showed HONO mixing ratios of within ± 20 % of the obser-vations at all height intervals, except that the morning peaks were overestimated in the lower and/or middle height in-tervals. The HONO mixing ratios in the upper height inter-vals were over-predicted/under-predicted due to the overesti-mated/underestimated NO2mixing ratios in the model.
While the absolute values of HONO and the general diurnal variation based on these the aerosol formation mechanisms agree well between model and observations, the HONO/NO2 ratios reveal a different picture. Modeled
HONO/NO2 ratios did not reproduce the observed diurnal
variations. While the observations on all three days clearly show a profile with a maximum around noon, the mod-eled HONO/NO2changed little throughout the day. The lack
Fig. 6.Comparisons between observations and model results with
photolytic HONO gas-phase formation from NO∗
2+ H2O (Li et al.,
2008) only. Shown here are daytime HONO(a, d, g), NO2(b, e, h),
and HONO/NO2ratios(c, f, i)in the lower (black), middle (blue),
and upper (red) height altitudes on 21 April (left panel), 18 May
(middle panel), and 19 May (right panel). HONO and NO2mixing
ratios after 09:00 CST were magnified with a different scale on the right axis.
runs with aerosol formation was consistent with our previous analysis (Wong et al., 2012), and stems from the cancellation of the photolytic dependence of the formation mechanism and the photolytic HONO loss. Our previous analysis using a steady-state approximation showed that the diurnal variation of HONO/NO2is proportional to the ratio ofJNO2toJHONO, assuming that photolytic NO2 conversion on aerosol is the
primary formation of HONO during the day and photolysis is the major removal pathway. Because bothJNO2andJHONO occur in a similar spectral region, their ratio shows almost no diurnal variation.
The model results with photolytic gas-phase HONO for-mation from NO∗
2+ H2O (Fig. 6) showed much smaller
HONO mixing ratios than the observations on all three days. The HONO mixing ratios were similar to those when no day-time HONO source was considered in the model (Fig. 3). Modeled HONO/NO2ratios were significantly less than the
observed ratios and did not show the observed diurnal varia-tions.
With our choice of aerosol reactive uptake coefficient (Ta-ble 1), the model was a(Ta-ble to reproduce the general mix-ing ratios and behavior of daytime HONO. A closer look at the HONO/NO2 ratios, however, revealed that the
underly-ing chemical mechanisms have clear flaws. We likely chose an aerosol uptake coefficient that was too high. Even with the rate constant suggested by Li et al. (2008), the gas-phase mechanism through NO∗
2 is too slow to reproduce the
ob-served daytime HONO mixing ratios. This confirms other studies that found this mechanism to be unimportant (Carr et al., 2009; Amedro et al., 2011). We can therefore conclude that aerosol formation alone cannot be the dominant source
Fig. 7.Comparisons between observations and model results with a photolytic HONO source at the ground and on aerosol. Shown are
daytime HONO(a, d, g), NO2(b, e, h), and HONO/NO2ratios(c,
f, i)in the lower (black), middle (blue), and upper (red) height alti-tudes on 21 April (left panel), 18 May (middle panel), and 19 May
(right panel). HONO and NO2mixing ratios after 09:00 CST were
magnified with a different scale on the right axis.
of daytime HONO and, that the gas-phase reactions of NO∗
2
+ H2O is negligible in daytime HONO formation.
3.4 Model runs with photolytic HONO formation both
at the ground and on aerosol
While the formation of HONO through the photoenhanced conversion of NO2on the surface provided a good
descrip-tion of the lower height interval, HONO levels were too low in the middle and upper intervals. One possible explanation for the observations would be the presence of an open-air HONO source. While we showed in Sect. 3.5 that open air sources such as the conversion of NO2 to HONO on the
aerosol alone do not explain HONO, we have no reason to completely exclude these mechanisms. However, the gas-phase reactions of NO∗
2+ H2O were found to be unimportant
for daytime HONO formation (Sect. 3.5), and will not be fur-ther considered here. Consequently we performed a model run implementing both the aerosol source and the ground source described previously. We used the same uptake coeffi-cients on the ground as in our previous model runs (6×10⁻⁵ on the ground), but a smaller uptake coefficient of 4 × 10⁻⁴
on aerosol for all three days (Case 5, Table 1). NOx
emis-sions were again slightly increased to fit the modeled NO2
mixing ratios better to the observations.
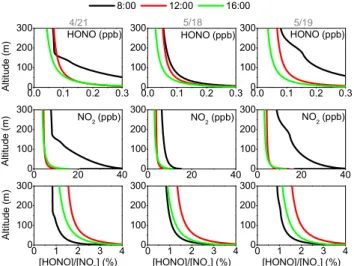
Fig. 8.Modeled vertical profiles of daytime HONO (upper panel),
NO2(middle panel) and HONO/NO2ratios (lower panel) at 08:00,
12:00, and 16:00 CST on 21 April, 18 May, and 19 May. Results are from model runs with photolytic HONO sources at the ground and on aerosol.
morning peaks of HONO mixing ratios were overestimated in the model on all three days, most likely pointing to either a smaller HONO source from direct emissions, or a miss-ing mornmiss-ing sink. S¨orgel et al. (2011a), who also observed a missing HONO sink in the early morning in a rural area, sug-gested that the missing sink could be due to deposition. Nev-ertheless, our modeled and observed HONO agrees within ± 15 % on all three days on all light paths, which is in most cases within the measurement error.
The modeled HONO/NO2 ratios in Case 5, with both
sources, showed better agreement with the observations than Case 2, with a ground source alone. Nevertheless the ratios still consistently show vertical gradients which, despite the errors in the observations, were not seen in Houston. The rea-son for this difference is currently unclear. One possible ex-planation is that the overestimated NO2mixing ratios in
up-per height intervals of the model causes the HONO/NO2
ra-tios to be too low aloft. If we calculate the ratio based on the modeled HONO and observed NO2in the upper height
inter-val, the HONO/NO2ratios would be simulated very well and
the HONO/NO2ratios in the upper height intervals would be
similar to those in the middle height intervals. The vertical gradients of HONO/NO2ratios would also be smaller, which
would be more consistent with the observations.
The comparisons between our three cases suggest that the best description of daytime HONO chemistry in Houston can be achieved by a combination of photoenhanced conversion of NO2on the ground and on the aerosol. The contribution
of each of these mechanisms to the HONO budget will be discussed in the next section.
4 Discussion
Our sensitivity model runs indicated that a combination of photoenhanced formation of HONO at the ground and on the aerosol lead to the best agreement of daytime HONO and HONO/NO2ratios between the model and the observations.
To further elucidate the vertical HONO profiles, as well as the contribution of the HONO formation and loss pathways, we analyzed the details of the model run, including both the photoenhanced aerosol and ground sources.
Figure 8 shows the modeled vertical profiles of HONO, NO2and HONO/NO2ratios at 08:00, 12:00 and 16:00 CST
on 21 April, 18 and 19 May. NO2showed strong vertical
pro-files at 08:00 CST in the morning of 21 April and 19 May. In contrast, the profiles were much less pronounced on 18 May. The profiles clearly showed that during this time the bound-ary layer was shallower on 21 April and 19 May than on 18 May. Boundary layer height data estimated from simul-taneous aerosol backscatter observations showed that dur-ing this time mixed layer height was 190, 330, and 410 m on 21 April, 18 and 19 May respectively. Later during the day, NO2 profiles on all three days were fairly weak, with
the strongest gradients in the lowest 30–50 m, where NO2
was still strongly influenced by surface emissions. However, because the model overpredicted the NO2 mixing ratios in
the upper height intervals, the actual NO2 vertical
gradi-ents at 12:00 and 16:00 CST were most likely stronger (see Sect. 3.1).
The influence of the morning surface inversions on 21 April and 19 May were also clearly visible in the HONO mixing ratios, which were larger than 0.3 ppb below 50 m al-titude on both mornings. The model overpredicted morning HONO mixing ratios in the lower height intervals and the ac-tual vertical profiles at 08:00 CST were, thus, somewhat less pronounced on these days. The reason for this overpredic-tion was most likely a missing HONO sink or HONO/NOx
emissions ratios, which were set too high for Houston as previously mentioned. Vertical profiles of HONO were still present at noon and in the afternoon, with strong vertical gra-dients below 50 m. At noon, HONO mixing ratios decreased from 0.2/0.15/0.2 ppb at 15 m to 0.09/0.06/0.09 ppb at 100 m altitude on 21 April, 18 and 19 May, respectively. We will further investigate the reason for these profiles below.
HONO/NO2ratios followed the diurnal behavior, with a
maximum at noon at all altitudes. HONO/NO2 ratios also
showed consistent vertical profiles in the model. Interest-ingly, the impact of the morning inversion was not as ob-vious as for HONO and NO2alone. It, therefore, seems that
the HONO/NO2ratios are not as impacted by vertical mixing
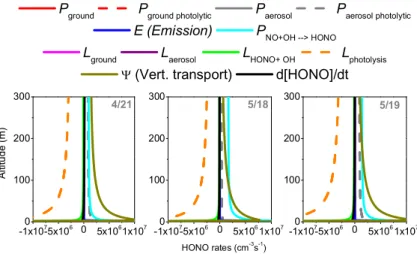
Fig. 9.Vertical profiles of the modeled HONO formation and loss pathways in the lowest 300 m at noon on 21 April, 18 May, and 19 May. The vertical transport term describes how much HONO is added or removed by vertical transport at each altitude.
4.1 Vertical profiles of HONO formation and loss rates
We further investigated the different formation and removal pathways of HONO in the lowest 300 m of the boundary layer in order to understand the altitude dependent chemistry behind daytime HONO. Figure 9 shows the vertical profiles of the modeled HONO formation and loss rates at noon on 21 April, 18 and 19 May. There was a clear vertical depen-dence of the different formation and loss pathways of HONO on all three days, and the basic shape of the vertical profiles looked similar on all three days. The largest contribution to the formation of HONO is the photolytic conversion of NO2
on the ground (not directly shown in Fig. 9). The formation fluxes, expressed as molecules per surface area and time, were 1.7 × 10¹¹, 1.4 × 10¹¹ and 1.8 × 10¹¹molec cm−2s−1
on 21 April, 18 and 19 May, respectively. The photolytic HONO formation fluxes at the ground were more than 10 times larger than the non-photolytic ground formation fluxes. To compare the ground source with the volume sources we averaged this formation rate over the lowest 300 m of the atmosphere to derive a volume formation rate of 5.7 × 10⁶, 4.7 × 10⁶ and 6.0 × 10⁶molec cm−3s−1 at noon
on 21 April, 18 and 19 May, respectively. The compari-son of these numbers with the values of other HONO for-mation pathways in Fig. 9 clearly showed the significance of the photolytic ground source. Direct emission also oc-curred between 0.1–1 m above the ground at rates of 1.0– 1.6 × 10⁸molec cm−3s−1. In Fig. 9, both ground formation
and direct emissions manifest themselves as a vertical trans-port term, 9. On all three days, vertical transport was an important source of HONO above 10 m altitude, with maxi-mum rates of 3.2–4.2 × 10⁸molec cm−3s−1near the ground
and 1.1–1.8 × 10⁶molec cm−3s−1 at 150 m. HONO
forma-tion from the gas-phase reacforma-tion of NO and OH peaked near the ground at rates of 4.1–5.3 × 10⁷molec cm−3s−1and
decreased with altitude, but stayed about constant at rates
of 1.0–1.7 × 10⁶molec cm−3s−1 above 50 m. It should be
noted that the modeled NO mixing ratios at 70 m altitude were within 15 % of the observations, and that the modeled OH concentrations were within the uncertainty of the mea-surements (not shown). Photolytic formation of HONO on aerosol also had a similar vertical profile. This pathway was insignificant on 18 May, due to the lower aerosol levels. Its magnitude was comparable to the gas-phase formation on 21 April and 19 May.
Photolysis was the major sink of HONO in the low-est 300 m. It peaked at the ground, where HONO mix-ing ratios were largest, and decreased with altitude. Pho-tolysis led to loss rates of 3.2–3.7 × 10⁸molec cm−3s−1
near the ground and 3.5–3.8 × 10⁶molec cm−3s−1at 150 m.
As this loss process leads to the formation of OH radi-cals, one expects a larger impact on the OH budget near the surface than aloft. This topic will be investigated in more detail in an upcoming publication. Vertical transport was the major loss of HONO at the ground, with fluxes of 1.1–1.4 × 10¹¹molec cm−2s−1, followed by deposition
with fluxes of 4.2–5.6 × 10¹⁰molec cm−2s−1(not shown in
Fig. 9). HONO was, thus, being formed at the ground and transported upward, while its mixing ratio decreased due to photolysis.
The diurnal evolution of HONO formation and loss pro-cesses integrated over the lowest 20 m and between 200– 300 m are shown in Fig. 10. Photolytic HONO formation at the ground was the dominant formation pathway of HONO in the lowest 20 m. It contributed 64–65 % of HONO formation in the lowest 20 m during the day. It peaked around noon due to its dependence on solar radiation. The asymmetric shape in the morning and in the afternoon was due to the diurnal variation of NO2mixing ratios, as explained in Wong et al.
Table 3.Percentage contribution of the different HONO formation and loss processes averaged in lowest 300 m above ground.
Production Loss Net
Ground (%)
Ground (photo) (%)
Aerosol (%)
Aerosol (photo) (%)
Emiss. (%)
NO + OH (%)
Total (1015cm−2)
Ground (%)
Aerosol (%)
HONO + OH (%)
Vert. Trans. (%)
Photo. (%)
Total (1015cm−2)
(1014cm−2)
4/21 10 49 <1 15 10 16 8.7 19 1 2 20 58 8.5 1.8
5/18 8 47 <1 7 10 28 6.8 17 <1 2 24 57 6.7 1
5/19 7 46 <1 16 8 22 10 17 1 2 18 62 9.9 1.9
Fig. 10. Timeseries of the integrated HONO formation and loss rates in the lowest 20 m (lower panels) and between 200–300 m (up-per panels) on 21 April, 18 May, and 19 May.
minor sources of HONO in the lowest 20 m. Vertical trans-port, which depends on the vertical gradients of HONO and the eddy diffusivity, peaked around noon and was the ma-jor sink of HONO in the lowest 20 m, leading to 56–59 % of HONO loss, followed by deposition (24–25 %) and photol-ysis (16–18 %). The fact that photolphotol-ysis is not the dominant loss process of HONO near the surface, where most previ-ous HONO measurements have been performed, shows that the analysis of the HONO budget has to include the transport term. Simple 0-dimensional budget calculations based on the photolysis as the only loss process will otherwise underesti-mate the source strength of HONO considerably.
Between 200–300 m altitude, i.e., removed from the sur-face sources and direct emissions from traffic, gas-phase re-action, photolytic formation on aerosol, and vertical trans-port were the main formation pathways of daytime HONO. Gas-phase formation, which was responsible for 30–60 % of daytime HONO formation between 200–300 m, was a ma-jor source of HONO, followed by vertical transport, which lead to 26–35 % of daytime HONO formation in this altitude interval. Photolytic HONO formation on aerosol contributed 10–36 % to daytime HONO formation between 200–300 m. On 18 May, photolytic aerosol formation was less important, based on our model results, because of the small observed
aerosol surface area density. The main removal of HONO between 200–300 m was due to photolysis. This loss rate peaked in the morning, due to the combined diurnal variation of the HONO mixing ratios and the HONO photolysis fre-quency. This was responsible for 96–97 % of HONO removal at this altitude. HONO uptake on aerosol surface and reaction with OH were unimportant removal pathways of HONO.
4.2 Vertically integrated HONO formation and loss
rates over lowest 300 m
To further quantify the overall importance of the different altitude dependent HONO formation and loss pathways in our model, and to reduce the influence of vertical mixing, we integrated the formation and loss pathways over the low-est 300 m throughout the day, i.e., between sunrise and sun-set, and compared them to each other (Table 3). The to-tal production of HONO integrated over the lowest 300 m of the atmosphere and time was 6.8–10 × 1015molec cm−2,
which was balanced by its removal. Daytime HONO for-mation was dominated by the photoenhanced NO2
conver-sion on the ground, which contributed 46–49 % of total day-time HONO formation, followed by the gas-phase reaction of NO with OH, which contributed to 16–28 % to total forma-tion, and photoenhanced HONO formation on aerosol with 7–16 % contribution. Non-photoenhanced HONO formation at the ground from NO2conversion was 7–10 %, similar to
the magnitude of direct emission, which was 8–10 % of to-tal HONO formation during the day. HONO formation from NO2non-photolytic conversion on aerosol did not play a
sig-nificant role. As expected, photolysis was the largest loss of HONO, resulting in 57–62 % of total daytime HONO removal. Deposition on the ground and vertical transport played secondary roles in HONO loss, contributing to 17– 19 % and 18–24 % of total removal. HONO loss on aerosol and by reaction with OH were minor.
the relative importance of ground and aerosol surfaces are not reported in their studies. Contributions from other sources are also not quantitatively reported and can therefore not be compared. As for the removal pathways of HONO, Czader et al. (2012) found that vertical transport contributed 65 % to the daytime HONO loss in the lowest 34 m, while our study shows a smaller contribution of 51 %. However, the contribu-tion by dry deposicontribu-tion in their study (12 %) was half of what we found. For chemical loss, Czader et al. (2012) reported 24 % of HONO removal due to reaction with OH. This is much larger than our results, which showed less than 2 % contribution. Sarwar et al. (2008) also concluded that pho-toenhanced HONO formation was necessary to explain ob-served daytime HONO levels, although they assumed that the main process is surface nitrate photolysis, a mechanism we did not consider based on our earlier analysis of the field observations in Houston (Wong et al., 2012).
5 Conclusions
A 1-D chemistry and transport model was used to re-produce the vertical gradients of HONO, NO2 and the
HONO/NO2 ratios observed during the SHARP 2009
ex-periment in Houston, TX, and to investigate potential day-time HONO formation pathways. Dayday-time HONO mixing ratios and HONO/NO2ratios in all height intervals were
un-derestimated by approximately 50 % when only dark HONO formation pathways were considered, which were sufficient to explain nocturnal HONO at the same location previously (Wong et al., 2011). Model scenarios with photoenhanced conversion of NO2on the ground and the aerosol, as well as
the gas-phase HONO formation through photoexcited NO2,
showed that the formation pathway that best explained our observations, and in particular those of the HONO/NO2
ra-tios, was NO2conversion at the ground. The inability to
re-produce the vertical profiles of HONO and HONO/NO2led
to the conclusion that photoenhanced NO2 conversion on
aerosol was a likely contributor to HONO formation above 100 m altitude. The parameterization that led to the best de-scription of HONO was based on a maximum reactive up-take coefficient at noon of 6 × 10⁻⁵that was scaled with the
normalized spectral irradiance and 100 % yield of NO2 to
HONO. This uptake coefficient is larger than those found on organics and urban grime in laboratory studies (for ex-ample George et al., 2005; Brigante et al., 2008; Ammar et al., 2010). However, the true atmospheric surface area available for chemistry is likely larger than the geometric surface area used in the model, thus explaining the need for a larger uptake coefficient in the model. The reactive NO2
uptake on aerosol implied by our model study is higher than that reported from laboratory studies (for example Stemmler et al., 2007; Woodill and Hinrichs, 2010), and the reason for this discrepancy is currently unclear. It is possible that other
mechanisms, thus far not considered, are acting in the atmo-sphere.
Our modeling results have a number of interesting impli-cations for the chemistry of HONO and interpretation of field data. The model clearly shows that ground surfaces play a crucial role for HONO levels in the atmosphere. Urban air-shed models currently do not have the ability to simulate chemical transformations on the surface, and highly simpli-fied parameterizations are used in most cases (Czader et al., 2012; Gonc¸alves et al., 2012; Sarwar et al., 2009), many of which have not been extensively tested. More research is needed to understand the processes occurring on true sur-faces to better understand HONO. Zhang et al. (2009) and H¨aseler et al. (2009) suggested that vertical mixing has a large impact on daytime HONO vertical gradients due to the observation of weakening HONO vertical profiles in convec-tive boundary layers. However, no further investigations on vertical mixing have been carried out in these studies. Our model also shows that vertical transport plays a crucial role in distributing HONO from its surface source(s) to the entire boundary layer. Between 56–59 % of the HONO loss in the lowest 20 m of the atmosphere is due to upward transport, 25 % by deposition, and only 16–18 % due to photolysis. Therefore, care must be taken to interpret in situ HONO ob-servations near the surface, as photolysis is not the main loss pathway at this altitude during the day. Pseudo steady state budget calculations, which are often used to calculate the missing daytime HONO source (such as Kleffmann, 2007; S¨orgel et al., 2011a; Wong et al., 2012), may thus underes-timate the daytime HONO source. As a consequence of the vertical HONO profile observed and modeled in our study, one can expect that the OH formation rate due to HONO pho-tolysis is also altitude dependent. More research is needed to understand if this altitude dependence impacts boundary layer chemistry.
Acknowledgements. This work was funded by the State of Texas through the Texas Commission of Environmental Quality, the Houston Advanced Research Center, and the Air Quality Research Program of the University of Texas. Funding was also provided by a National Science Foundation (NSF) Career Award (ATM-0348674). We would like to thank Tom Jobson at Washington State University for the hydrocarbon data, Robert Griffin at Rice University and Crystal Reed and Don Collins at Texas A&M University for the aerosol data.
Edited by: I. Trebs
References
Acker, K., M¨oller, D., Wieprecht, W., Meixner, F., Bohn, B., Gilge, S., Plass-D¨ulmer, C., and Berresheim, H.: Strong daytime
pro-duction of OH from HNO2 at a rural mountain site, Geophys.
Res. Lett., 33, L02809, doi:10.1029/2005GL024643, 2006b. Amedro, D., Parker, A., Schoemaecker, C., and Fittschen, C.: Direct
observation of OH radicals after 565nm multi-photon excitation
of NO2in the presence of H2O, Chem. Phys. Lett., 513, 12–16,
doi:10.1016/j.cplett.2011.07.062, 2011.
Ammar, R., Monge, M., George, C., and D’Anna, B.:
Photoen-hanced NO2loss on simulated urban grime, Chem. Phys. Chem.,
11, 3956–3961, doi:10.1002/cphc.201000540, 2010.
Aumont, B., Chervier, F., and Laval, S.: Contribution of HONO
sources to the NOx/HOx/O3chemistry in the polluted boundary
layer, Atmos. Environ., 37, 487–498, 2003.
Beine, H.., Domin´e, F., Simpson, W., Honrath, R., Sparapani, R., Zhou, X., and King, M.: Snow-pile and chamber experi-ments during the Polar Sunrise Experiment “Alert 2000”: explo-ration of nitrogen chemistry, Atmos. Environ., 36, 2707–2719, doi:10.1016/S1352-2310(02)00120-6, 2002.
Bejan, I., Abd El Aal, Y., Barnes, I., Benter, T., Bohn, B., Wiesen, P., and Kleffmann, J.: The photolysis of ortho-nitrophenols: a new gas phase source of HONO, Phys. Chem. Chem. Phys., 8, 2028– 2035, doi:10.1039/b516590c, 2006.
Berkowicz, R., Winther, M., and Ketzel, M.: Traffic pollution mod-eling and emission data, Environ. Modell. Softw., 21, 454–460, 2006.
Brigante, M., Cazoir, D., D’Anna, B., George, C., and Donaldson,
D.: Photoenhanced uptake of NO2by pyrene solid films, J. Phys.
Chem. A, 112, 9503–9508, doi:10.1021/jp802324g, 2008. Businger, J., Wyngaard, J., Izumi, Y., and Bradley, E.: Flux-profile
relationships in atmospheric surface layer, J. Atmos. Sci., 28, 181–189, 1971.
Carr, S., Heard, D., and Blitz, M.: Comment on “Atmospheric
hy-droxyl radical production from electronically excited NO2and
H2O”, Science, 324, 5925, doi:10.1126/science.1166669, 2009.
Constant, P., Poissant, L., and Villemur, R., Annual hydrogen, car-bon monoxide and carcar-bon dioxide concentrations and surface to air exchanges in a rural area, Atmos. Environ., 42, 5090–5100, 2008.
Czader, B. H., Rappengl¨uck, B., Percell, P., Byun, D. W., Ngan, F., and Kim, S.: Modeling nitrous acid and its impact on ozone and hydroxyl radical during the Texas Air Quality Study 2006, Atmos. Chem. Phys., 12, 6939–6951, doi:10.5194/acp-12-6939-2012, 2012.
Dibb, J., Arsenault, M., Peterson, M., and Honrath, R.: Fast nitro-gen oxide photochemistry in Summit, Greenland snow, Atmos. Environ., 36, 2501–2511, doi:10.1016/S1352-2310(02)00130-9, 2002.
Elshorbany, Y. F., Kurtenbach, R., Wiesen, P., Lissi, E., Rubio, M., Villena, G., Gramsch, E., Rickard, A. R., Pilling, M. J., and Kleffmann, J.: Oxidation capacity of the city air of Santiago, Chile, Atmos. Chem. Phys., 9, 2257–2273, doi:10.5194/acp-9-2257-2009, 2009.
Fuchs, N. and Sutugin, A.: Highly dispersed aerosols, Ann Arbor Science, Ann Arbor, MI, USA, 1–90, 1971.
George, C., Strekowski, R., Kleffmann, J., Stemmler, K., and
Am-mann, M.: Photoenhanced uptake of gaseous NO2 on
solid-organic compounds: a photochemical source of HONO?, Fara-day Discuss., 130, 195–210, doi:10.1039/b417888m, 2005.
Geyer, A. and Stutz, J.: Vertical profiles of NO3, N2O5, O3, and
NOx in the nocturnal boundary layer: 2. Model studies on the
altitude dependence of composition and chemistry, J. Geophys. Res., 109, D12307, doi:10.1029/2003JD004211, 2004.
Gonc¸alves, M., Dabdub, D., Chang, W., Jorba, O., and Bal-dasano, J.: Impact of HONO sources on the performance of mesoscale air quality models, Atmos. Environ., 54, 168–176, doi:10.1016/j.atmosenv.2012.02.079, 2012.
H¨aseler, R., Brauers, T., Holland, F., and Wahner, A.: Develop-ment and application of a new mobile LOPAP instruDevelop-ment for the measurement of HONO altitude profiles in the planetary boundary layer, Atmos. Meas. Tech. Discuss., 2, 2027–2054, doi:10.5194/amtd-2-2027-2009, 2009.
He, Y., Zhou, X., Hou, J., Gao, H., and Bertman, S.: Importance of dew in controlling the air-surface exchange of HONO in rural forested environments, Geophys. Res. Lett., 33, L02813, doi:10.1029/2005GL024348, 2006.
Horv´ath, L., Nagy, Z., and Weidinger, T., Estimation of dry deposi-tion velocities of nitric oxide, sulfur dioxide, and ozone by the gradient method above short vegetation during the tract cam-paign, Atmos. Environ., 32, 1317–1322, 1998.
Kleffmann, J.: Daytime sources of nitrous acid (HONO) in the at-mospheric boundary layer, Chem. Phys. Chem., 8, 1137–1144, doi:10.1002/cphc.200700016, 2007.
Kleffmann, J., Gavriloaiei, T., Hofzumahaus, A., Holland, F., Koppmann, R., Rupp, L., Schlosser, E., Siese, M., and Wah-ner, A.: Daytime formation of nitrous acid: A major source of OH radicals in a forest, Geophys. Res. Lett., 32, L05818, doi:10.1029/2005GL022524, 2005.
Kurtenbach, R., Becker, K., Gomes, J., Kleffmann, J., L¨orzer, J., Spittler, M., Wiesen, P., Ackermann, R., Geyer, A., and Platt, U.: Investigations of emissions and heterogeneous formation of HONO in a road traffic tunnel, Atmos. Environ., 35, 3385–3394, 2001.
Kurtenbach, R., Ackermann, R., Becker, K., Geyer, A., Gomes, J., L¨orzer, J., Platt, U., and Wiesen, P.: Verification of the contribu-tion of vehicular traffic to the total NMVOC emissions in
Ger-many and the importance of the NO3chemistry in the city air, J.
Atmos. Chem., 42, 395–411, 2002.
Landgraf, J. and Crutzen, P.: An efficient method for online calcula-tions of photolysis and heating rates, J. Atmos. Sci., 55, 863–878, 1998.
Li, S., Matthews, J., and Sinha, A.: Atmospheric hydroxyl radical
production from electronically excited NO2and H2O, Science,
319, 1657–1660, doi:10.1126/science.1151443, 2008.
Mao, J., Ren, X., Chen, S., Brune, W., Chen, Z., Martinez, M., Harder, H., Lefer, B., Rappengl¨uck, B., Flynn, J., and Leuchner, M.: Atmospheric oxidation capacity in the summer of Houston 2006: Comparison with summer measurements in other metropolitan studies, Atmos. Environ., 44, 4107–4115, doi:10.1016/j.atmosenv.2009.01.013, 2010.
Marr, L., Black, D., and Harley, R.: Formation of photochemical air pollution in central California 1. Development of a revised motor vehicle emission inventory, J. Geophys. Res., 107, 4047, 2002. Platt, U., Perner, D., Harris, G., Winer, A., and Pitts, J.:
Ren, X., Gao, H., Zhou, X., Crounse, J. D., Wennberg, P. O., Browne, E. C., LaFranchi, B. W., Cohen, R. C., McKay, M., Goldstein, A. H., and Mao, J.: Measurement of atmospheric nitrous acid at Bodgett Forest during BEARPEX2007, Atmos. Chem. Phys., 10, 6283–6294, doi:10.5194/acp-10-6283-2010, 2010.
Ren, X., Sanders, J. E., Rajendran, A., Weber, R. J., Goldstein, A. H., Pusede, S. E., Browne, E. C., Min, K.-E., and Cohen, R. C.: A relaxed eddy accumulation system for measuring verti-cal fluxes of nitrous acid, Atmos. Meas. Tech., 4, 2093–2103, doi:10.5194/amt-4-2093-2011, 2011.
Sarwar, G., Roselle, S., Mathur, R., Appel, W., Dennis, R., and Vo-gel, B.: A comparison of CMAQ HONO predictions with obser-vations from the Northeast Oxidant and Particle Study, Atmos. Environ., 42, 5760–5770, doi:10.1016/j.atmosenv.2007.12.065, 2008.
Sarwar, G., Pinder, R., Appel, K., Mathur, R., and Carlton,
A.: Examination of the impact of photoexcited NO2
chem-istry on regional air quality, Atmos. Environ., 43, 6383–6387, doi:10.1016/j.atmosenv.2009.09.012, 2009.
S¨orgel, M., Regelin, E., Bozem, H., Diesch, J.-M., Drewnick, F., Fischer, H., Harder, H., Held, A., Hosaynali-Beygi, Z., Martinez, M., and Zetzsch, C.: Quantification of the unknown HONO
day-time source and its relation to NO2, Atmos. Chem. Phys., 11,
10433–10447, doi:10.5194/acp-11-10433-2011, 2011a. S¨orgel, M., Trebs, I., Serafimovich, A., Moravek, A., Held, A., and
Zetzsch, C.: Simultaneous HONO measurements in and above a forest canopy: influence of turbulent exchange on mixing ratio differences, Atmos. Chem. Phys., 11, 841–855, doi:10.5194/acp-11-841-2011, 2011b.
Stark, H., Brown, S., Wong, K., Stutz, J., Elvidge, C., Pollack, I., Ryerson, T., Dube, W., Wagner, N., and Parrish, D.: City lights and urban air, Nat. Geosci., 4, 730–731, doi:10.1038/ngeo1300, 2011.
Stemmler, K., Ammann, M., Donders, C., Kleffmann, J., and George, C.: Photosensitized reduction of nitrogen dioxide on humic acid as a source of nitrous acid, Nature, 440, 195–198, doi:10.1038/nature04603, 2006.
Stemmler, K., Ndour, M., Elshorbany, Y., Kleffmann, J., D’Anna, B., George, C., Bohn, B., and Ammann, M.: Light induced conversion of nitrogen dioxide into nitrous acid on submi-cron humic acid aerosol, Atmos. Chem. Phys., 7, 4237–4248, doi:10.5194/acp-7-4237-2007, 2007.
Stockwell, W., Kirchner, F., Kuhn, M., and Seefeld, S.: A new mechanism for regional atmospheric chemistry modeling, J. Geophys. Res., 102, 25847–25879, 1997.
Stull, R.: An introduction to boundary layer meteorology, Kluwer Academic Publishers, Dodrecht/Boston/London, 1–666, 1988. Su, H., Cheng, Y., Shao, M., Gao, D., Yu, Z., Zeng, L., Slanina,
J., Zhang, Y., and Wiedensohler, A.: Nitrous acid (HONO) and its daytime sources at a rural site during the 2004 PRIDE-PRD experiment in China, J. Geophys. Res.-Atmos., 113, D14312, doi:10.1029/2007JD009060, 2008.
Su, H., Cheng, Y., Oswald, R., Behrendt, T., Trebs, I., Meixner, F., Andreae, M., Cheng, P., Zhang, Y., and P¨oschl, U.: Soil nitrite as a source of atmospheric HONO and OH radicals., Science, 333, 1616–1618, doi:10.1126/science.1207687, 2011.
Trick, S.: Formation of nitrous acid on urban surfaces – a physical-chemical perspective, Ph.D. thesis, University of Heidelberg, Heidelberg, Germany, 2004.
Villena, G., Kleffmann, J., Kurtenbach, R., Wiesen, P., Lissi, E., Rubio, M., Croxatto, G., and Rappengl¨uck, B.: Vertical gradients
of HONO, NOxand O3in Santiago de Chile, Atmos. Environ.,
45, 3867–3873, doi:10.1016/j.atmosenv.2011.01.073, 2011. Vogel, B., Vogel, H., Kleffmann, J., and Kurtenbach, R.: Measured
and simulated vertical profiles of nitrous acid-Part II. Model sim-ulations and indications for a photolytic source, Atmos. Environ., 37, 2957–2966, 2003.
Wong, K. and Stutz, J.: Influence of nocturnal vertical stability on daytime chemistry: A one-dimensional model study, Atmos. Environ., 44, 3753–3760, doi:10.1016/j.atmosenv.2010.06.057, 2010.
Wong, K. W., Oh, H.-J., Lefer, B. L., Rappengl¨uck, B., and Stutz, J.: Vertical profiles of nitrous acid in the nocturnal urban atmo-sphere of Houston, TX, Atmos. Chem. Phys., 11, 3595–3609, doi:10.5194/acp-11-3595-2011, 2011.
Wong, K. W., Tsai, C., Lefer, B., Haman, C., Grossberg, N., Brune, W. H., Ren, X., Luke, W., and Stutz, J.: Daytime HONO vertical gradients during SHARP 2009 in Houston, TX, Atmos. Chem. Phys., 12, 635–652, doi:10.5194/acp-12-635-2012, 2012. Woodill, L. A. and Hinrichs, R.: Heterogeneous reactions of
surface-adsorbed catechol with nitrogen dioxide: substrate ef-fects for tropospheric aerosol surrogates., Phys. Chem. Chem. Phys., 12, 10766–10774, doi:10.1039/c002079f, 2010.
Zhang, N., Zhou, X., Shepson, P., Gao, H., Alaghmand, M., and Stirm, B.: Aircraft measurement of HONO vertical pro-files over a forested region, Geophys. Res. Lett., 36, L15820, doi:10.1029/2009GL038999, 2009.
Zhou, X., Beine, H., Honrath, R., Fuentes, J., Simpson, W., Shep-son, P., and Bottenheim, J.: Snowpack photochemical produc-tion of HONO: a major source of OH in the Arctic bound-ary layer in springtime, Geophys. Res. Lett., 28, 4087–4090, doi:10.1029/2001GL013531, 2001.
Zhou, X., He, Y., Huang, G., Thornberry, T., Carroll, M., and Bertman, S.: Photochemical production of nitrous acid on glass sample manifold surface, Geophys. Res. Lett., 29, 4590, doi:10.1029/2002GL015080, 2002.
Zhou, X., Gao, H., He, Y., Huang, G., Bertman, S., Civerolo, K., and
Schwab, J.: Nitric acid photolysis on surfaces in low-NOx
envi-ronments: Significant atmospheric implications, Geophys. Res. Lett., 30, 2217, doi:10.1029/2003GL018620, 2003.
Zhou, X., Huang, G., Civerolo, K., Roychowdhury, U., and
Demer-jian, K.: Summertime observations of HONO, HCHO, and O3
at the summit of Whiteface Mountain, New York, J. Geophys. Res.-Atmos., 112, D08311, doi:10.1029/2006JD007256, 2007. Zhou, X., Zhang, N., TerAvest, M., Tang, D., Hou, J., Bertman, S.,