Texture Analysis and Modified Level Set Method for
Automatic Detection of Bone Boundaries in Hand
Radiographs
Syaiful Anam
Graduate School of Science and Engineering Yamaguchi University
Yamaguchi, Japan Department of Mathematics
University of Brawijaya Malang, Indonesia
Eiji Uchino
Graduate School of Science and Engineering Yamaguchi University
Yamaguchi, Japan Fuzzy Logic Systems Institute
Iizuka, Japan
Hideaki Misawa
Department of Electrical Engineering Ube National College of Technology
Ube, Japan
Noriaki Suetake
Graduate School of Science and Engineering Yamaguchi University
Yamaguchi, Japan
Abstract—Rheumatoid Arthritis (RA) is a chronic inflammatory joint disease characterized by a distinctive pattern of bone and joint destruction. To give an RA diagnosis, hand bone radiographs are taken and analyzed. A hand bone radiograph analysis starts with the bone boundary detection. It is however an extremely exhausting and time consuming task for radiologists. An automatic bone boundary detection in hand radiographs is thus strongly required. Garcia et al. have proposed a method for automatic bone boundary detection in hand radiographs by using an adaptive snake method, but it
doesn’t work for those affected by RA. The level set method has
advantages over the snake method. It however often leads to either a complete breakdown or a premature termination of the curve evolution process, resulting in unsatisfactory results. For those reasons, we propose a modified level set method for detecting bone boundaries in hand radiographs affected by RA. Texture analysis is also applied for distinguishing the hand bones and other areas. Evaluating the experiments using a particular set of hand bone radiographs, the effectiveness of the proposed method has been proved.
Keywords—hand bones radiograph; boundary detection; modified level set method; diffusion filter
I. INTRODUCTION
Rheumatoid Arthritis (RA) is a chronic and systemic inflammatory disorder that may affect many tissues and organs, but principally attacks synovial joints. RA affects about 1% of the population worldwide and causes premature mortality, disability, and compromised quality of life [1]. It has been demonstrated that early treatment significantly delays joint destruction, disease activity, and functional disability.
Changes in the early stages of a disease are thus extremely
important. To give an RA diagnosis, a radiograph of patient’s
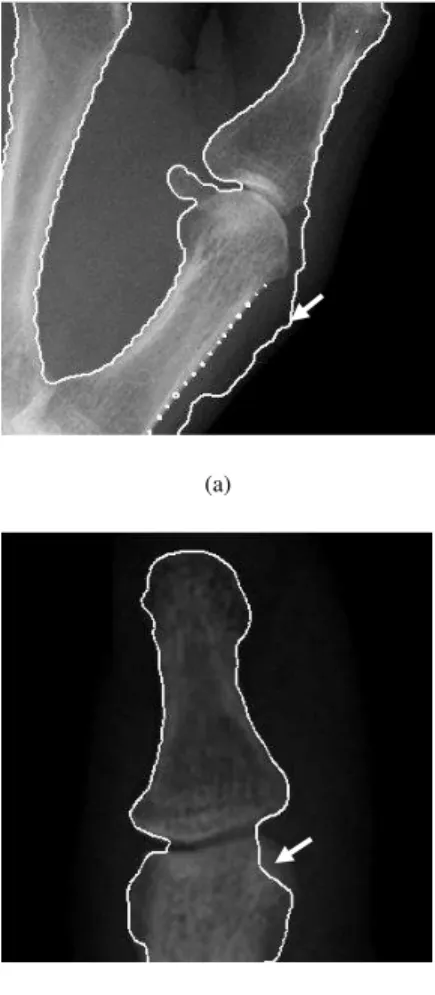
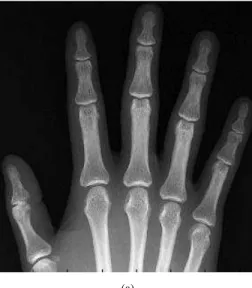
hand is taken as shown in Fig. 1(a), and hand bones are analyzed to detect erosion caused by RA as shown in Fig. 1(b).
The boundaries of the hand bones firstly need to be detected for the hand bone radiograph analysis. However, it is an extremely exhausting and time consuming task for radiologists because the precision required for correct diagnosis is very high. Therefore, an automatic bone boundary detection in the hand radiographs are to be established first.
Boundary detection is a fundamental task in computer vision with wide applications in areas such as feature extraction, object recognition and image segmentation [2]. The boundary detection problem is the problem of finding lines separating homogeneous regions. Active contour models have been extensively applied for detecting an image boundary [3, 4, 5, 6, 7, 8, 9, 10]. The active contour models have several desirable advantages over classical image segmentation methods, e.g., edge detection, thresholding, and region growth. The first advantage of the active contour model is that it can achieve sub-pixel accuracy of the object boundaries [3]. The second is that it can be easily formulated under a principled energy minimization framework, and allows incorporation of various prior knowledge, such as shape and intensity distribution, for a robust segmentation [8]. The third advantage is that it can give smooth and closed contours as a segmentation result, which are necessary and can be readily used in further processing, such as shape analysis and recognition.
(a)
(b)
Fig. 1. Rheumatoid arthritis. (a) Rheumatoid arthritis photographed in the hand bone radiograph. (b) The hand bone erosion is caused by rheumatoid arthritis.
Fig. 2. Seed points of the adaptive snake method [11]. The initial contours are defined simply by creating a small contour around each
Fig. 3. An example of the failed detection boundary result by a snake method with a certain initial contour.
(a)
(b)
Fig. 4. The level set method problems. (a) A premature termination problem. (b) A complete breakdown problem.
Existing active contour models can be categorized into two types. Those are a snake method and a level set method. The level set method, is a highly robust and accurate method for tracking interfaces moving under complex motions. It has been widely and successfully used for image segmentation. Hand bone
erosion
: Seed points
method are that the curves break or merge naturally during an evolution process, and their topological changes are thus automatically handled.
The level set method however doesn’t work well on images with noise. It often leads to either a complete breakdown or a premature termination in the curve evolution process, resulting in unsatisfactory results as shown in Fig. 4. This is because the speed function cannot properly detect the boundary and its detected boundary is dull even after filtering.
To avoid a premature termination or a complete breakdown in the level set method, we propose a new modified level set method. Two points in the level set method are modified. The first point is on the filtering and the second point is on the speed function.
In the standard level set method, the Gaussian filter is used for reducing noise. However, there is a high possibility that the image boundary becomes dull after applying the Gaussian filter. Therefore, the first modification point is that the Perona Malik Diffusion (PMD) filter [12] is employed to substitute the Gaussian filter. The PMD filter not only reduces noise but also effectively enhances the image boundaries.
The second point is that the speed function of the level set method is modified to improve the motion of the level set contour. The modified speed function controls the motion of level set contour, and thus the zero level curve of the level set stops around the boundary areas and moves quickly in other areas.
In hand bone radiographs, the bone boundary detection is very difficult because the pixel intensities of bones and other areas are similar in some parts, and the hand bone has non-uniform illumination. To solve this problem, we employ an entropy method as a preprocessing, which is one of the texture analysis methods, to distinguish the hand bones and other areas.
The effectiveness of the proposed method is verified through the experiments by applying it to the real hand bone radiographs.
II. RHEUMATOID ARTHRITIS AND HAND BONE RADIOGRAPHS
Arthritis is a general term used to describe more than 100 chronic diseases of the joints, bones and muscles. One type of arthritis is Rheumatoid Arthritis (RA) which is a chronic inflammatory joint disease characterized by a distinctive pattern of bone and joint destruction.
RA affects joints in hands, hips, spine, knees and feet. Commonly, the hand and wrist radiographs are a source of important clinical information with regard to very prevalent musculoskeletal diseases.
X-ray or radiograph is the gold standard for an assessment of joint damage in RA. The hand bone radiograph of Fig. 1(a) is used not only for the initial diagnosis but also for the monitoring of disease progression and assessment of the therapeutic effect of various drugs. Fig. 1(b) shows the bone erosion which is caused as a result of RA.
Radiographs depict the time-integrated cumulative record of joint damage. Its advantages are low costs, high availability, possibility of standardization together with blinded centralized reading, reasonable reproducibility, and existence of validated assessment methods. Furthermore, radiography is helpful in the differentiation of RA from other joint conditions including osteoarthritis, psoriatic arthritis and neoplasms [13].
III. IMAGE BOUNDARY DETECTION
Image segmentation is a process of partitioning a digital image into multiple segments. Image segmentation is typically used to locate the objects and boundaries in images. The boundary of an image can provide valuable information for further image analysis and interpretation tasks.
A boundary is a contour in the image plane that represents a change in pixel ownership from one object or surface to another [14]. Images are characterized by color, texture, and non-texture regions. Thus, boundaries can arise due to the adjacency of any of these regions in natural images.
IV. TEXTURE ANALYSIS
An image texture is a property that represents the surface and structure of an image. Generally speaking, the image texture can be defined as a regular repetition of an element or a pattern on a surface. The image texture is a complex visual pattern composed of entities or regions with sub-patterns with the characteristics of brightness, color, shape, size, etc.
An image region has a constant texture if a set of its characteristics are constant, slowly changing or approximately periodic. The image texture can be regarded as a similarity grouping in an image.
Texture analysis is a major step in texture classification, image segmentation and image shape identification. Image segmentation and shape identification are preprocessing steps for object recognition in an image [15].
Texture analysis refers to a class of the mathematical procedures and models that characterize the spatial variations within imagery by means of extracting information.
Approaches to the texture analysis are usually categorized into structural, statistical, model-based and transform methods. Feature extraction is the first stage of the image texture analysis. The results obtained from this stage are used for texture discrimination, texture classification or object shape determination. One of the feature extraction methods is a histogram based entropy method.
The image is assumed as a function f(x,y) of two space variables x and y, where x0,1,...,N1 and
. 1 ..., , 1 ,
0
M
y The function f(x,y) can take discrete
values of 0,1,...,G1, which are the values of the intensity in the image.
1 0 1 0 ), ), , ( ( ) ( N x M y i y x f ih (1)
where (j,i) is a following Kronecker’s delta function:
. , 0 , 1 ) , ( i j i j i j (2)
Dividing the values h(i)by the total number of pixels in the image, one obtains the appropriate probability density of occurrence of the intensity levels as follows:
. 1 ..., , 1 , 0 , ) ( )
( i G
NM i h i
p (3)
The entropy is defined by:
)). ( ( log ) ( 1 0
2 pi
i p E G i
(4)The entropy method is also often used for characterizing the image texture.
V. ANISOTROPIC DIFFUSION FILTER
The anisotropic diffusion filter was originally proposed by Perona and Malik [12] in order to preserve the edges of an image. The basic idea behind the Perona Malik Diffusion (PMD) process is to get an increasingly smoothed image
) , , (x y t
u from an original image u0(x,y), indexed by a
diffusion parameter t.
This process can be interpreted as an image convolution by a Gaussian kernel G(x,y,t) with an increasing width as follows: ). , , ( * ) , ( ) , ,
(x yt I0 x y G x yt
I (5)
The anisotropic diffusion equation is defined by:
, ) , , ( ) , , ( ) ) , , ( ( I t y x c I t y x c I t y x c div t I It (6) where ) ) , , ( ( ) , ,
(x y t g I x yt
c (7)
is a diffusion coefficient. I denotes a gradient of an image. g
refers to an edge stopping function, which is a decreasing function of the gradient of an image.The initial condition is given by:
, y , x I , y , x
I( 0) 0( ) (8)
(9)
where and are the coordinates of the pixel of concern and its neighboring pixels, respectively. is an intensity at with an iteration count n. represents the diffusion directions. is the number of pixels in the neighboring area. is a parameter.
A monotonically decreasing function of the gradient of an image is usually adopted as g
. The gradient of an image and the speed function are given by:(10) and
(11)
where K is a parameter which controls the strength of diffusion.
g takes large values at the regions where the intensity gradients are low. On the contrary, it takes low values at the regions where the intensity gradients are high.
VI. LEVEL SET METHOD
The level set methods have been widely and successfully used for detecting image boundaries. The basic idea of the level set method is that the contour is represented by the zero level set of a higher dimensional function, called a level set function. The motion of the contour is formulated based on the evolution of the level set function.
Let us consider a dynamic parametric contour )), , ( ), , (
(x st y st
C the curve evolution of which is defined by:
,
/ t FN
C
(12)
where t is a set point in time, s is a curve parameter, N is an inward normal vector to the curve C. Fis a speed function that controls the motion of the contour.
The curve evolution of (12), in terms of a parameterized contour, can be converted to a level set formulation by embedding the dynamic contour Cas the zero level set of a time dependent level set function (x,y,t).
Assuming that the embedding level set function takes the negative values inside the zero level contour and the positive values outside, the inward normal vector can be expressed as
,
/
N where is a gradient operator. The curve evolution of (12) is then converted to:
, ) ( ( ) , ) ( , ) ( ) 1
(
np s n p s s n s n
s I g I I
I
) , (x y
s p
) (n s
I
s s
s , ) ( ) ( ) ( , n s n p n p
s I I
I
,
/
t F (13)
which is referred to as a level set evolution equation. Curve evolution that is used by the level set (x) is defined by:
(14)
where is a dirac delta function and div is a divergence operator. g is a speed function which is given by:
), * ( 1 /(
1 G I
g (15)
where Gis a Gaussian filter and I is an image [7].
VII.PROPOSED METHOD
We modify the level set method and apply it for bone boundary detection in hand radiographs. We further propose to employ an entropy method-based texture analysis as a preprocessing.
This chapter is divided into two sections. Those are bone texture extraction and modified level set method.
A. Bone Texture Extraction
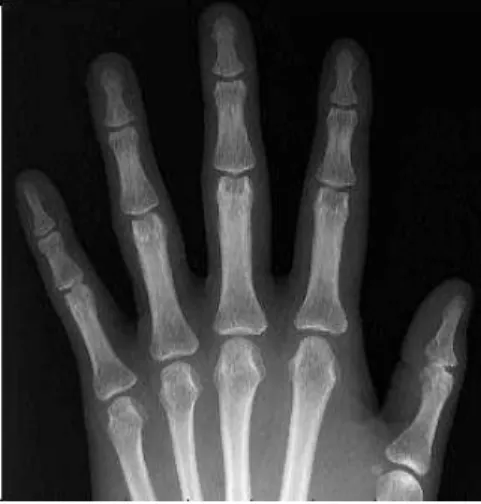
In the first step, the hand bone radiograph is cropped to get a region of concern as of Fig. 5. In the second step, the cropped radiograph is scanned as in Fig. 6 and the entropy is calculated for each window as follows:
, )) ( ( log ) ( )
, (
255
0
2
k
k p k p j
i
E (16)
where E(i,j)is an entropy evaluated at the center of the window.
Fig. 5. The hand bone radiograph to be processed.
Fig. 6. Scan of the cropped radiograph by using a moving window (raster scan).
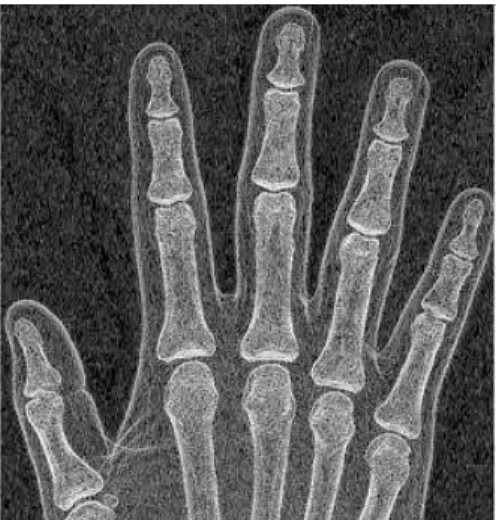
Fig. 7. The entropy of an image of Fig. 5.
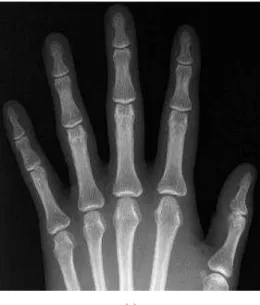
Fig. 8. The hand bone radiograph after applying the erosion morphological operation to Fig. 5.
), ( )
/ ( ) (
) ) ( ( /
div g g
d div
t p
Fig. 9. The entropy of an image of Fig. 8.
Fig. 10. The result after applying the PMD filter to Fig 9.
Fig. 11. The result after applying the Gaussian filter to Fig 9.
The window moves from the top left to the right, then in the next row, until the bottom right of an image. This is called a raster scanning.
The entropy of an image of Fig. 5 is shown in Fig. 7. From Fig. 7 it can be observed that the entropy can distinguish the bone areas and the other areas. The entropy has however a disadvantage that it makes the bones be connected to each other even if they are separated actually. To overcome this problem, it is recommended to employ the erosion morphology operation before the entropy of an image is evaluated.
An erosion operation is one of the most basic morphological operations. It adds and/or removes pixels on the image boundaries. The number of pixels added and/or removed from the objects in an image depends on the size and the shape of the structuring element of the erosion morphology operation.
Fig. 12.The values of the standard speed function for Fig. 10.
Fig. 14. Randomly given intial contour of the level set.
A structuring element of it is a matrix consisting of only 0's and 1's that can have any arbitrary shape and size. The pixels with values of 1 define the neighborhood.
In this paper, the 90 degrees line structure element is used. The length of the line is set to be 11. The result of the erosion morphology applied to Fig. 5 is shown in Fig 8, and the entropy of an image of Fig. 8 is shown in Fig. 9. Fig. 9 is used thereafter.
B. Modified Level Set Method
In this section, the modified level set method is described, which is applied to the entropy of an image in section VII. A.
The procedure of the modified level set method is summarized as follows:
1) Apply the PMD filter to the entropy of an image to
smooth it. This PMD filter substitutes the Gaussian filter in the standard level set method.
2) Calculate the image gradient magnitude |I(x,y)|.
3) Normalize |I(x,y)| in range [0,1] as follows:
. | y , x I | min | y , x I | max
| y , x I | min | y , x I | Gnorm
) ) ( ( ) ) ( (
) ) ( ( ) (
(17)
4) Calculate the modified speed function which is defined
by:
, bG exp
g ( norm2) (18)
where b is a constant which controls the motion of the contour.
5) Give the initial contour of the level set.
6) Calculate the contour evolution by using (14).
7) Calculate the new contour.
8) Repeat steps (vi) and (vii) until it converges or the
maximum number of iterations is reached.
VIII. EXPERIMENTAL RESULTS
The proposed method is applied to a set of the hand bone radiographs. In the experiments, four hand bone radiographs are used. The bone boundary results by the proposed method are compared with the boundaries manually detected by an experienced medical doctor.
As described in chapter VII, Fig. 5 is the input image to be processed. Fig. 8 is obtained after applying the erosion morphological operation to Fig. 5. Finally Fig. 9 is obtained by computing the entropy of Fig. 8. It is seen that Fig. 9 has uniform illumination and thus the bone areas and the other areas are softly distinguished.
Figs. 10 and 11 show the entropy of an image after applying the PMD filter and the Gaussian filter to Fig. 9, respectively. It is seen that the PMD filter works better than the Gaussian filter.
The values of the standard speed function and the values of the modified speed function for Fig. 10 are shown in Figs. 12 and 13, respectively. It can be seen that the modified speed function clearly show the bone boundaries better than the standard speed function. The modified speed function can thus avoid a complete breakdown or a premature termination, while the standard speed function cannot.
The parameters of the level set of (14) are empirically assigned as Δt10, 1, 0.2/Δt,5, and 1.5.
Fig. 14 shows the randomly given initial contour of the level set. The contour of the level set moves gradually with a speed function g. The level set contour with zero level moves from outside to inside, because the level set function has
(b)
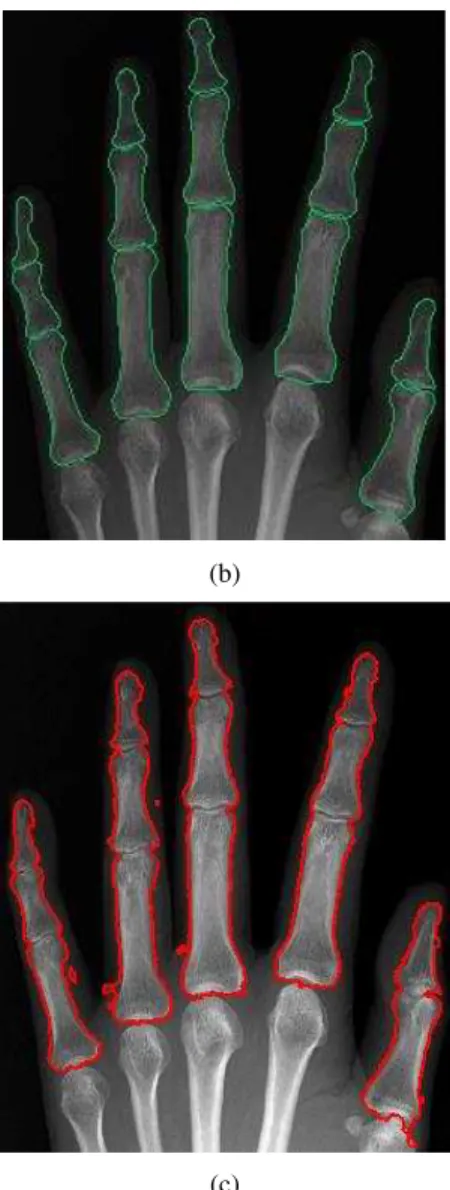
Fig. 15. The bone boundary detection results for the left hand radiograph. (a) The left hand bone radiograph to be proccessed. (b) The red lines and the green lines show the boundaries detected by the proposed method and those manually detected by an experienced medical doctor, respectively.
negative values inside the zero level set contour and positive values outside.
The contour of the level set stops and converges on the boundary areas because the values of the speed function g on the boundary areas are close to 0.
Fig. 15(a) and Fig. 16(a) show the radiographs for the left and right hands to be processed, respectively. Fig. 15(b) and Fig. 16(b) show the boundary detection results for each hand. It is seen from those results that the red lined boundaries manually detected by the proposed method are close to the green lined boundaries by an experienced medical doctor. The proposed method is efficient.
(a)
(b)
Fig. 16.The bone boundary detection results for the right hand radiograph. (a) The right hand bone radiograph to be proccessed. (b) The red lines and the green lines show the boundaries detected by the proposed method and those manually detected by an experienced medical doctor, respectively.
TABLE I. NUMERICAL EVALUATION OF THE BONE BOUNDARY
DETECTION RESULTS.
(Pixels)
Data Hand Image size Hausdorff distance
Data 1 Left Hand 1539 x1543 34.9 Right Hand 1500 x1481 38.7
Data 2 Left Hand 1347x1390 43.3 Right Hand 1341x1384 42.0
Data 3 Left Hand 1437x1354 39.2 Right Hand 1398x1330 40.6
Data 4 Left Hand 1449x1212 61.3 Right Hand 1425x1386 58.5
Average 44.8
(b)
(c)
Fig. 17. One failed result of the bone boundary detection. (a) The entropy of the input image after applying the PMD filter. (b) The bone boundary detected by an experienced medical doctor. (c) The bone boundary detected by the proposed method.
The bone boundary detection results are numerically evaluated by Hausdorff distance [16]. The Hausdorff distance between the two curves is defined as the maximum of the distance to the closest point between two curves as follows:
, A , b d max , B , a d max max B , A
e j
j i
i { ( )} { ( )})
( )
( (19)
where A{a1,a2,...,am} and B{b1,b2,...,bm} represent
the two curves. ai and bj are the ordered pairs of x and y coordinates of a point on the curve. d(ai,B) is the distance to the closest point for ai to curve B defined by:
. a b min B , a
d j i
j
i )
( (20)
The numerical evaluations of the bone detection results by Hausdorff distance are given in Table 1. The average of the
Hausdorff distance between two curves is 44.8 pixels. Based on the definition of the Hausdorff distance, this means that the maximum error is 44.8 pixels.
The proposed method could detect the bone boundaries quite well for almost all the images that were used. One failed result is shown in Fig. 17. It can be seen that the pixel intensities of the hand bone and the pixel intensities of the other areas are mostly similar in some parts. Fig. 17(a) shows the entropy of the input image after PMD filtering. Fig. 17(b) shows a hand bone boundary detected by an experienced medical doctor. Fig. 17(c) shows the bone boundary detected by the proposed method. Even for a case as difficult as this, the proposed method could somehow detect the bone boundary.
IX. CONCLUSIONS
We have proposed a modified level set method for an automatic detection of the bone boundaries in hand radiographs. The proposed method has shown a good detection performance.
The proposed method however could not work well for some cases when the pixel intensities of the bone and those of the other areas are similar.
In future works, the above problem needs to be further considered. We aim to develop a method which is robust to a variety of image intensities. Application of the present method to other practical cases and more comparative discussions with other techniques are left for the future studies.
ACKNOWLEDGMENT
This work was supported by the research fund from the Iizuka Research and Development Organization under the project number 24102. Syaiful Anam would also like to thank DGHE postgraduate scholarship of Indonesia for supporting his stay at Yamaguchi University, Japan.
REFERENCES
[1] B. Zielinski, “Hand radiograph analysis and joint space location improvement for image interpretation,” Schedae Informaticae, vol. 17/18, pp. 45–61, 2009.
[2] M. Leordeanu, R. Sukthankar and C. Smichisescu, “Efficient closed-form solution to generalized boundary detection,” European Conference on Computer Vision, LCNS, vol. 7575, pp. 516–529, 2012.
[3] L. He, S. Zheng and L. Wang, “Integrating local distribution information with level set for boundary detection,” Journal of Visual Communication and Image Representation, vol. 21, pp. 343–354, 2010.
[4] K. Horbert, K. Rematas and B. Leibe, “Level-set person segmentation and tracking with multi-region appearance models and top-down shape information,” In Proceedings of International Conference on Computer Vision, pp. 1871–1878, 2011.
[5] M. Li, C. He and Y. Zhan, “Adaptive regularized level set method for weak boundary object segmentation,” Mathematical Problems in Engineering, vol. 2012, pp. 1–16, 2012.
[6] C. Li, R. Huang, Z. Ding, J. C. Gatenby, D. N. Metaxas and J. C. Gore, “A level set method for image segmentation in the presence of intensity inhomogeneities with application to MRI,” IEEE Transactions on Image Processing, vol. 20, no. 7, pp. 2007–2016, 2011.
[7] C. Li, C. Xu, C. Gui and M. D. Fox, “Distance regularized level set evolution and its application to image segmentation,” IEEE Transactions on Image Processing, vol. 19, pp. 3243–3254, 2010.
[9] C. Li, C. Y. Kao, J. C. Gore, and Z. Ding, “Minimization of Region-Scalable Fitting Energy for Image Segmentation,” IEEE Transactions on Image Processing, vol. 17, no. 10, pp. 1940–1949, 2008.
[10] L. Wang, F. Shi, W. Lin, J. H. Gilmore, and D. Shen, “Automatic Segmentation of Neonatal Images Using Convex Optimization and Couple Level Sets,” Neuro Image, vol. 58, pp. 805-817, 2011.
[11] R. D. L. Garcia, M. M. Fernandez, J. I. Arribas and C. A. Lopez, “A fully automatic algorithm for contour detection of bones in hand radiographs using active contours,” In Proceedings of International Conference on Image Processing, pp. 421–424, 2003.
[12] P. Perona and J. Malik, “Scale-space and edge detection using anisotropic diffusion,” IEEE Transactions on Pattern Analysis and Machine Intelligence, vol. 12, pp. 629–639, 1990.
[13] O. Troum, E. Olech and A. F. Wells, “Newer imaging modalities; their use in rheumatic diseases,” Update to Rheumatic Disease Clinics of North America, vol. 4, no. 3, pp. 1–20, 2001.
[14] G. D. Joshi and J. Sivaswamy, “A computational model for boundary detection,” Computer Vision, Graphics and Image Processing, LNCS, vol. 4338, pp. 172–183, 2006.
[15] T. V. N. Rao and A. Govardhan, “Analysis and assessment of surface image texture mechanisms,” Journal of Global Research in Computer Science, vol. 3, no.9, pp. 6–11, 2012.