© Author(s) 2008. This work is distributed under the Creative Commons Attribution 3.0 License.
Chemistry
and Physics
Measurements of UV aerosol optical depth in the
French Southern Alps
J. Lenoble1,2, C. Brogniez1, A. de La Casini`ere2, T. Cabot2, V. Buchard1, and F. Guirado3
1Laboratoire d’Optique Atmosph´erique (LOA), Universit´e des Sciences et Technologies de Lille, 59655 Villeneuve d’Ascq Cedex, France
2Interactions Rayonnement Solaire Atmosph`ere (IRSA), Universit´e Joseph Fourier de Grenoble, 17 Quai Claude Bernard, 38000 Grenoble, France
3Centre Europ´een M´edical et Bioclimatologique de Recherche et d’Enseignement Sup´erieur (CEMBREU), 35, rue Croix de Bretagne, Villars St Pancrace, 05100 Brianc¸on, France
Received: 29 November 2007 – Published in Atmos. Chem. Phys. Discuss.: 8 January 2008 Revised: 29 September 2008 – Accepted: 29 September 2008 – Published: 17 November 2008
Abstract. Routine measurements of global and diffuse UV irradiances at Brianc¸on station (1310 m a.s.l.) are used to re-trieve the direct solar irradiance and the aerosol optical depth (AOD), for cloudless days. Data of three years (2003, 2004, 2005) are analyzed; the results confirm those of a preliminary analysis for 2001, 2002.
The atmosphere is very clear in winter, with AODs be-tween 0.05 and 0.1. The turbidity increases slowly in spring, starting end of February, with AODs around 0.2–0.3 in mid summer, some values reaching 0.4. A similar behaviour is observed for all years, with somewhat higher values in late summer for the year 2003.
1 Introduction
Spectral ultraviolet (UV) global and diffuse irradiances on an horizontal plane have been routinely measured during several years at the Brianc¸on station in the French Southern Alps. The direct irradiance is therefore obtained by difference, and is used for retrieving AODs. The objectives are: i) to build a climatology of aerosols in a clean unpolluted area, ii) to detect possible cases of turbidity and to analyse their causes. We present the measurement site and the instruments in Sect. 2, the data and their analysis in Sect. 3. Section 4 shows the results, mainly the AOD annual variation. Summary and conclusion are in Sect. 5.
Correspondence to:J. Lenoble ([email protected])
2 Station and instruments
The measurement site is located in Villars Saint Pancrace, a small village, close to the town of Brianc¸on (44.90◦N,
6.65◦E), in a sunny and dry Alpine valley, at the altitude of
1310 m a.s.l.; the site belongs to the CEMBREU. The instru-ments are operated under the supervision of LOA and IRSA groups. Figure 1 shows a photograph of the instruments on the CEMBREU platform.
Two UV spectroradiometers measure the irradiance on an horizontal surface, a Bentham (BE) DM150, and a Jobin Yvon (JY) HD10. Both instruments operated regularly since November 1999, until September 2005. The BE measures every 30 min three spectra, alternately the global, with a shadow disc the diffuse and the global irradiance; each spec-tral scan needs about 5 min The JY first measured the global irradiance every 30 min (Pachart, 1997; Masserot, 2001); it was equipped with a shadow disc in July 2003, and there-after measured a spectrum every 10 min, alternately global and diffuse irradiances. The characteristics of the two instru-ments are very similar (Lenoble et al., 2005). The largest wavelength recorded is 400 nm for the BE and 450 nm for the JY.
Fig. 1. The measurement platform, with the two spectroradiome-ters, on the left Bentham, on the right Jobin Yvon.
0,05 0,1 0,15 0,2 0,25 0,3
320 340 360 380 400 420 440
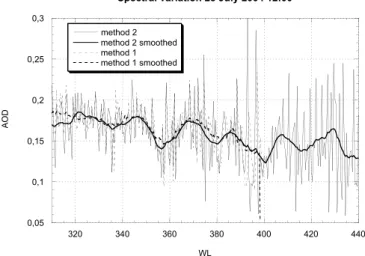
Spectral variation 25 July 2004 12:00
method 2 method 2 smoothed method 1 method 1 smoothed
AOD
WL
Fig. 2. Spectral variation of AOD observed on 25 July 2004 at 12:00, directly and after smoothing over 4 nm. Solid line for AOD obtained by the method used throughout the paper (method 1), dashed line for the second method presented in Sect. 3.1. The smoothing is performed respectively with a rectangular function, and with a triangular function, for methods 1 and 2.
due to the sky light intercepted by the shadowing disc has been evaluated previously to be smaller than 1% in the con-ditions of Brianc¸on site.
A cosine correction is applied to both instruments; how-ever it is important only for large solar zenith angles, and we do not consider such cases in this study.
The direct solar irradiance DIR(t) at time t, is retrieved from the measured global GLO and diffuse DIF irradiances, as
DIR(t )= [GLO(t+1t )+GLO(t−1t )]/2−DIF(t ) (1) where1t=10 min, for the JY and1t=5 min for the BE. The retrieval is limited to clear stable conditions, when the
so-0 0,05 0,1 0,15 0,2 0,25 0,3 0,35 0,4
0 50 100 150 200 250 300 350 400 BE 2003
BE 2004
JY 2004 BE 2005 JY 2005
AOD
Day
Fig. 3.The annual variation of AOD at 340 nm, for the two instru-ments, and the three years 2003, 2004, 2005.
lar zenith angle (SZA) does not vary too rapidly, preferably around local noon.
3 Retrieval of the AOD
3.1 Method
The direct irradiance can be written, as
DIR=F0µ0exp(−(τRay+τOz+τaer)/µ0), (2) whereF0 is the extraterrestrial solar flux,µ0 the cosine of the SZA,τRaythe molecular Rayleigh optical depth,τOzthe ozone absorption optical depth,τaerthe AOD. The NO2 opti-cal depth has been checked to be negligible. The AOD is the only unknown in Eq. (2). The direct irradiance that would be observed for a perfectly clear atmosphere, without aerosols, DIRcl, is computed as
DIRcl =F0µ0exp(−(τRay+τOz)/µ0), (3) at step 0.05 nm, using the ATLAS3 high resolution spectrum (Van Hoosier, 1996), and it is convoluted using the instru-ment slit function. The Rayleigh optical depth is computed for a standard mid latitude atmosphere winter or summer (McClatchey et al., 1972), at the altitude of Brianc¸on. The ozone optical depth uses the Paur and Bass (1985) ozone cross sections and the ozone total column amount given by the Total Ozone Mapping Spectrometer (TOMS) (McPeters et al., 1998), for Brianc¸on.
The AOD is therefore retrieved as
τaer= −µ0ln(DIR/DIRcl). (4)
A similar approach consists in first deriving the total optical depth
0 0.05 0.1 0.15 0.2 0.25 0.3 0.35 0.4
0 50 100 150 200 250 300 350 400 BE 2003
BE 2004 JY 2004 BE 2005 JY 2005
AOD
Day
Fig. 4.Same as Fig. 3 for 380 nm.
from Eq. (2), as
τtot= −µ0ln(DIR/µ0F0), (6)
where F0 is preliminary convoluted to the instrument slit function; thenτRay andτOz are substracted fromτtot. This second method has been compared satisfactorily (Fig. 2) to the first one, used throughout the paper. The differences, which appear similarly in all cases, are most likely due to the different slit corrections and to the different smoothing performed in both methods.
3.2 Data analyzed
All the cloudless days available for the three years 2003, 2004, and 2005, are considered. We select cloudless days by plotting the diurnal variation of irradiance at a fixed wave-length; the curve is perfectly regular only when there is no cloud. Both instruments suffered some technical problems leading to interruptions of data recording. The JY spectrora-diometer operated, with the shadow disc, only between July 2004 and September 2005. On the whole 179 cloudless days have been analyzed, including 53 days with the two spectro-radiometers. Some preliminary results concerning only the JY data have been presented (Guirado et al., 2005).
A previous analysis of the BE data in 2001 and 2002 has been published (Lenoble et al., 2004), and its results are com-forted by the present work.
3.3 Uncertainties
For this analysis, we have found more convenient to use the formalism of the second method, although both methods are rigourously equivalent.
From (Eq. 6), the uncertainty onτtotis due to the indepen-dent uncertainties on the measured irradiance DIR and on the extraterrestrial fluxF0.
1τtot=µ0[(1DIR/DIR)2+(1F0/F0)2]1/2 (7)
0 0.05 0.1 0.15 0.2 0.25 0.3 0.35 0.4
0 50 100 150 200 250 300 350 400
2001
2002
AOD
Day
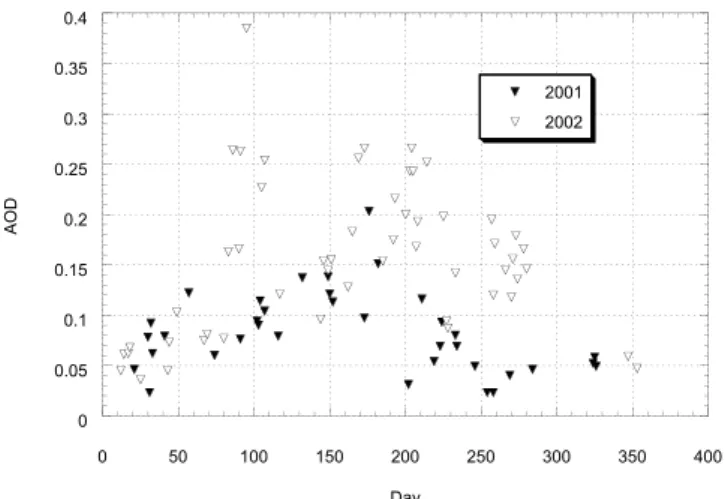
Fig. 5.Annual variation of average UV-A AOD for 2001 and 2002, from Fig. 2 in Lenoble et al. (2004).
Onτaerretrieved from Eq. (5), further uncertainties are added by the uncertainties onτRay, andτOz. We will try briefly to analyze these various causes of error.
The uncertainties on the measurements of either GLO or DIF have been discussed by several authors (Bernhard and Seckmeyer, 1999; Hou¨et, 2003; Webb et al., 1998). Roughly half of the uncertainty is due to the calibration itself, both to the lamp calibration uncertainty, and to the uncertainties during the calibration procedure. Another half of the error comes from the measure, as instrument noise, cosine error of the diffusor, wavelength shift non perfectly corrected. Hou¨et (2003) estimates the measurement uncertainty to about 4– 5% for a confidence interval of 95%. The error becomes larger when the signal is small, i.e. at short wavelengths, and when the sun is low on the horizon. On the direct irradiance DIR, a further error could come from the averaging process in Eq. (1); however, it is negligible for wavelengths larger than 310 nm, and SZA smaller than 60◦(Hou¨et, 2003). We
have limited our analysis to these conditions.
The different extraterrestrial spectra measured by various instruments (Cebula et al., 1999), differ by about 2–3%, which suggest a possible systematic error of about 2% on F0. From Eq. (7)
1τtot=0.055µ0, (8)
varying between 0.050 for a high sun to 0.025 for a sun at 60◦ from the zenith; actualy, the influence ofµ0in Eq. (8), can be partly compensated, because the measurement uncertainty increases for low sun, as mentionned above.
-5 -4 -3 -2 -1 0 1 2 3
0 50 100 150 200 250 300 350 400
2003 2004 2005
TOMS AEI
Day
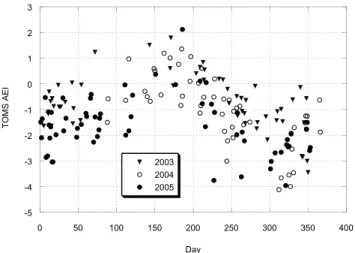
Fig. 6. TOMS Aerosol Index for cloudless days, in 2003, 2004, 2005.
surface pressure; these independent errors can be estimated respectively to about 2% and 1.5%, leading to
1τRay=0.025×τRay. (9)
For 320 nm, 1τRay=0.020; it decreases toward large wave-lengths to 0.008 at 400 nm.
Similarly onτOz, the uncertainty is due to the uncertainty on the ozone cross-sections (about 2%), and on the ozone total column amount evaluated to about 4% for TOMS data; this leads to
1τOz=0.045×τOz. (10)
This error increases sharply withτOz towards short wave-lengths, but it becomes completely negligible above 330 nm. This is a further reason to limit our analysis to a wave-length range with a lower limit between 310 and 330 nm.
Roughly, we estimate the uncertainty on AOD to be around 0.05, knowing that it slightly varies with wavelength and with SZA. For the small AOD observed in Brianc¸on (0.1–0.3), this means a large relative uncertainty, reaching 50% for the smallest values.
4 Results
Despite the correction of wavelength shift performed on the measured spectra, and the convolution of the high resolu-tion solar spectrum, the spectral variaresolu-tion of AOD shows strong rapid oscillations, obviously erratic, and it has been smoothed over 4 nm, either with a rectangular or with a tri-angular function. After smoothing, some large oscillations remain (Fig. 2); definitively, they are artefacts, and not real spectral variations. We did not find a satisfactory explanation for these oscillations, which are of the order of the expected error. The AOD slowly increases toward short wavelengths
-1 0 1 2 3 4 5
0 0.05 0.1 0.15 0.2 0.25 0.3 0.35
ALPHA
AOD (380)
Fig. 7.Angstr¨om parameterαversus AOD at 380 nm, for the three years 2003, 2004, 2005;αis estimated between 340 and 380 nm.
between 440 nm and 320 nm; as said before, the uncertainty becomes too large below 320 nm to allow analysis. When results are obtained from the two instruments on the same day, they always agree wihin±3%, that is better than the estimated uncertainty of±5%.
We have therefore decided to focus on analyzing time vari-ations, more precisely annual variations at 12:00 TU, which is not far (within about half an hour) from local noon, at two specific wavelengths. The wavelengths chosen are 340 nm and 380 nm, which correspond to the UV channels of the CIMEL sunphotometer of the AErosol RObotic NETwork (AERONET) (Holben et al., 1998).
4.1 Annual variations
Figure 3 presents the AOD annual variations at wavelength 340 nm obtained from both instruments for the three years 2003, 2004, and 2005.
A general behaviour appears for the three years, with low values, smaller than 0.1, in winter, and higher values, gen-erally around 0.2, in summer. Some much higher values, around 0.3–0.4, appear between mid-July to mid-September; they are much more numerous, and still appear late October, in 2003, which was characterized by a very hot summer. For all the three years, the increase after the low winter values begins in mid-February, and the decrease in mid-November. Even considering the large relative uncertainty mentionned above, the annual variation is significant.
The larger values observed during the hot summer 2003 are in agreement with the ongoing studies performed in the European project GEMS (Global Earth’s system Monitoring using in situ and Satellite data), which also find a higher tur-bidity during this 2003 heat wave.
pattern. The rather large std is due partly to the uncertainty and partly to real day to day variations.
As expected a similar behaviour is observed for 380 nm (Fig. 4), with values slightly smaller than at 340 nm.
We had previously analyzed the Bentham data for 2001 and 2002 (Lenoble et al., 2004), and presented an average AOD in the UV-A, whereas we present in this paper AODs at 340 and 380 nm. We have already stated that AOD varies only slowly in the wavelength range 320–400 nm. There-fore the previous results can be compared qualitatively to the present ones. In Fig. 5, we have reported the results from Fig. 2 in Lenoble et al. (2004); it confirms a similar pattern, with low winter values, and higher summer values in 2001 and 2002, as in 2003, 2004, and 2005. This behaviour seems typical of Brianc¸on site over five years.
4.2 Complementary analysis
The satellite instrument TOMS (McPeters et al., 1998) pro-vides regularly an aerosol index (AI), which is related to the aerosol optical depth and absorption in a rather complex way. The retrieval of AI from TOMS observations, and its anal-ysis in term of aerosol characteristics, have been described in several publications (Herman et al., 1997; Torres et al., 2002). We consider it here only as a qualitative parameter, and we present in Fig. 6, TOMS AI for the Brianc¸on site on the clear days of 2003, 2004, and 2005. Surprisingly or not, the AI annual variation shows some similarity with the AOD behaviour; positive AIs in summer could point to absorbing aerosols. Trying to push forward the comparison would be risky.
As we have seen (Fig. 2), the spectral variation ofτaeris weak, with oscillations, and we can look only for an approx-imate information on the general slope. We have chosen, as reference, an Angstr¨om parameterαdefined between 340 and 380 nm. Figure 7 showsα plotted versusτaer(380) for all the BE data. For small AODs, the average value ofαis 1.7, with a very large dispersion, mostly due to the uncertain-ties on AODs; whenτaerbecomes larger than 0.2,αtends to stabilize around 1.3, with a std of 0.35, suggesting that parti-cles could be larger and more homogeneous, when it is more turbid.
5 Discussion and conclusion
The main outcome of this work is an annual variation of AOD, with low winter values, around 0.1 or smaller, at 340 nm, and much larger summer values, reaching 0.3–0.4, with an average of 0.2, at 340 nm. This behaviour is ob-served at all wavelengths between 320–400 nm, the spectral variation being weak over this limited interval. It is observed for the five year period from 2001 to 2005, with the largest summer values in 2003, and it is definitively significant de-spite the large relative uncertainty.
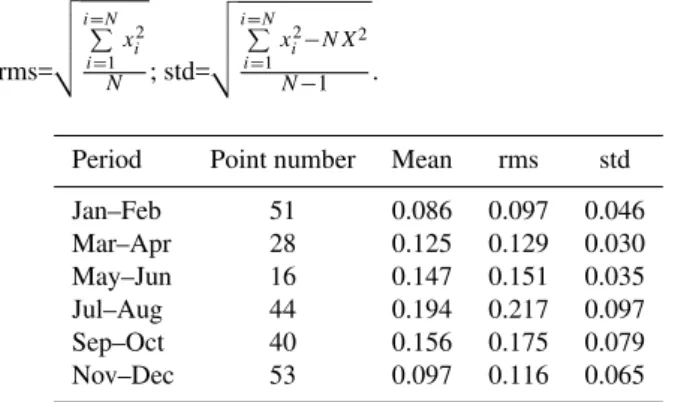
Table 1. Statistical results forτaer (340 nm), 3 Years, 2
Instru-ments. ForN measuresxi of a quantityx, mean=X=N1 i=N
P
i=1
xi;
rms=
v u u t
i=N
P
i=1
x2 i
N ; std=
v u u t
i=N
P
i=1
x2
i−N X2
N−1 .
Period Point number Mean rms std
Jan–Feb 51 0.086 0.097 0.046
Mar–Apr 28 0.125 0.129 0.030
May–Jun 16 0.147 0.151 0.035
Jul–Aug 44 0.194 0.217 0.097
Sep–Oct 40 0.156 0.175 0.079
Nov–Dec 53 0.097 0.116 0.065
The increase of turbidity in spring can be due to the vege-tation, pollen and other vegetal particles in summer. Another contribution can be dust particles, originating from the dry soil in summer, whereas the ground is generally covered with snow in winter.
The few cases with the highest turbidity, could have other more specific explanations, as an arrival of desert dust par-ticles, which sometimes reach the Alps, after crossing the Mediterranean Sea. Another source could be biomass burn-ing particles, from the frequent forest fires in the South of France. An analysis of these events and of the air mass tra-jectories would be necessary to check the above hypothesis. Acknowledgements. The authors acknowledge the help provided by the Director and the technicians of the CEMBREU.
Funding was provided by the European Union, under the three successive contracts SUVDAMA, EDUCE, and CUVRA.
Edited by: M. Blumthaler
References
Bernhard, G. and Seckmeyer, G.: Uncertainty of measurements of spectral solar UV irradiance, J. Geophys. Res., 104, 14 321– 14 345, 1999.
Bodhaine, B. A., Wood, N. B., Dutto, E. G., and Slusser, J. R.: On Rayleigh optical depth calculations, J. Atmos. Oceanic Technol., 16, 1854–1861, 1999.
Cebula, R. P., Thuillier, G. O., VanHoosier, M. E., Hilsenrath, E., Herse, M., Brueckner, G. E., and Simon, P. C.: Observa-tions of the solar irradiance in the 200–350 nm interval dur-ing the ATLAS-1 mission: a comparison among three sets of measurements-SSBUV, SOLSPEC, and SUSIM, Geophys. Res. Lett., 23, 2289–2292, 1996.
de La Casini`ere, A., Cachorro, V., Smolskaia, I., Lenoble, J., Sor-ribas, M., Massot, O., Anton, M., and Vilaplana, J. M.: Com-partive measurements of total ozone amount and aerosol optical depth during a campaign at El Arenosillo, Huelva, Spain, Ann. Geophys., 23, 3399–3406, 2005,
Gr¨obner, J., Albold, A., Blumthaler, M., Cabot, T., de La Casini`ere, A., Lenoble, J., Martin, T., Masserot, D., M¨uller, M., Philipona, R., Pichler, T., Pougatch, E., Rengarajan, G., Schmucki, D., Seckmeyer, G., Sergent, C., Tour´e, M. L., and Weihs, P.: Vari-ability of spectral solar ultraviolet irradiance in an Alpine envi-ronmennt, J. Geophys. Res., 105, 26 991–27 003, 2000. Guirado, F., Lenoble, J., de La Casini`ere, A., Cabot, T., and
Brog-niez, C.: The aerosol ultraviolet optical depth observed at a sta-tion in the French Southern Alps, Proceedings of SPIE, 5979, 59791L-1-L-10, 2005.
Herman, J. R., Bhartia, P. K., Torres, O., Hsu, C., Seftor, C., and Celerier, E.: Global distribution of UV-absorbing aerosols from Nimbus 7/TOMS data, J. Geophys. Res., 102, 16 911–16 922, 1997.
Holben, B. N., Eck, T. F., Slutsker, I., Tanr´e, D., Buis, J. P., Set-zer, A., Vermote, E., Reagan, J. A., Kaufman, Y., Nakajima, T., Lavenu, F., Jankowiak, I., and Smirnov, A.: AERONET A feder-ated instrument network and data archive for aerosol characteri-zation, Rem. Sens. Environ., 66, 1–16, 1998.
Hou¨et, M.: Spectroradiometrie du rayonnement solaire UV au sol: Am´eliorations apport´ees `a l’instrumentation et au traitement des mesures: Analyse pour l’´evaluation du contenu atmosph´erique en ozone et en a´erosols, PhD thesis Universit´e des Sciences et Technologies de Lille, 2003.
Lenoble, J., de La Casini`ere, A., and Cabot, T.: Analysis of direct solar ultraviolet irradiance measurements in the French Alps: Re-trieval of turbidity and ozone column amount, Appl. Optics, 43, 3133–3139, 2004.
Lenoble, J., Brogniez, C., Hou¨et, M., Legrand, M., de La Casini`ere, A., Cabot, T., and Guirado, F.: The French network for spec-tral measurement of solar UV irradiance, in: IRS 2004: Current Problems in Atmospheric Radiation, edited by: Fischer, H. and Sohn, B. J., 359–362, 2005.
McClatchey, R. A., Fenn, R. W., Selby, J. E. A., Volz, F. E., and Garing, J. S.: Optical properties of the atmosphere, ERP 411, AFCRL-72-0497, 1972.
McPeters, R., Barthia, P. K., Krueger, A. J., Herman, J. R., Welle-meyer, C. G., Seflor, C. J., Jarros, G., Torres, O., Moy, L., Labow, G., Byerly, W., Taylor, S. L., Swissler, T., and Cebula, R. P.: Earth Probe Total Ozone Mapping Spectrometer (TOMS) Data Products User’s Guide, NASA/TP-1998-206895, 1998. Masserot, D.: Spectroradiometrie du rayonnement solaire UV:
Mesures et analyses, PhD thesis Universit´e des Sciences et Tech-nologies de Lille, 2001.
Pachart, E.: Mesures et mod´elisation du rayonnement ultraviolet au sol, PhD thesis Universit´e des Sciences et Technologies de Lille, 1997.
Paur, R. J. and Bass, A. M.: The ultraviolet cross sections of ozone. II, Results and temperature dependence, in: Atmospheric Ozone, Proceedings of the Quadriennal Ozone Symposium, edited by: Zerefos, C. S. and Ghazi, A., 611–616, 1985.
Torres, O., Bhartia, P. K., Herman, J. R., Sinyuk, A., Ginoux, P., and Holben, B.: A long-term record of aerosol optical depth from TOMS observations and comparison to AERONET mea-surements, J. Atmos. Sci., 59, 398–413, 2002.
Van Hoosier, M. E.: The ATLAS-3 solar spectrum, available via: http://www.srrb.noaa.gov/pub/users/irina/OUT/UMKEHR/ STAS, 1996.