Article
J. Braz. Chem. Soc., Vol. 28, No. 1, 87-97, 2017. Printed in Brazil - ©2017 Sociedade Brasileira de Química 0103 - 5053 $6.00+0.00
*e-mail: [email protected]
Copper(II) Nitroaromatic Schiff Base Complexes: Synthesis, Biological Activity and
Their Interaction with DNA and Albumins
Darliane A. Martins,a Lucius F. Bomfim Filho,a Cleiton M. da Silva,a Ângelo de Fátima,a
Sonia R. W. Louro,b Denise G. J. Batista,c Maria de Nazaré C. Soeiro,c
João Ernesto de Carvalhod and Letícia R. Teixeira*,a
aDepartamento de Química, Universidade Federal de Minas Gerais,
31270-901 Belo Horizonte-MG, Brazil
bDepartamento de Física, Pontifícia Universidade Católica do Rio de Janeiro,
22653-900 Rio de Janeiro-RJ, Brazil
cLaboratório de Biologia Celular, Instituto Oswaldo Cruz, FIOCRUZ,
21040-360 Rio de Janeiro-RJ, Brazil
dCentro Pluridisciplinar de Pesquisas Químicas, Biológicas e Agrícolas, CPQBA,
Universidade Estadual de Campinas, 13083-790 Paulínia-SP, Brazil
Copper(II) complexes of the Schiff base ligands 2-((5-nitrofuran-2-yl)methyleneamino) phenol (HL1) and 2-(4-nitrobenzylideneamino)phenol (HL2) were prepared and characterized using physicochemical and spectroscopic techniques. In these complexes the Schiff base ligands acted as a bidentate donor bound to Cu2+ through the oxygen and nitrogen atoms in the deprotonated
form. The electron paramagnetic resonance spectra, carried out on [CuCl(L1)(phen)].0.5H2O
and [CuCl(L2)(phen)].2H2O complexes, showed the presence of only mononuclear forms. The
Cu2+ complexes and ligands were evaluated for their in vitro trypanocidal activity. The complex
[CuCl(L1)(phen)].0.5H2O was more active than the free Schiff base and also presented a superior
effect to benznidazole, the reference drug. The antiproliferative activity of the Schiff bases and Cu2+ complexes were evaluated for their effect on seven tumor cell lines and showed a cytostatic
and in some cases a cytotoxic effect. These compounds also presented binding properties to deoxyribonucleic acid (DNA) and moderate ability to quench the intrinsic fluorescence of albumins.
Keywords: Schiff base, copper(II) complexes, biological activity, DNA, albumin
Introduction
The aldimines, also known as Schiff bases, are characterized by the presence of a nitrogen which is double bonded to a carbon atom C=N–R (R = H, alkyl or aryl).1,2 The Schiff bases are widely used as pigments, colorants, catalysts, intermediates in organic synthesis and polymer stabilizers. They also exhibit a wide spectrum of biological activity, including antifungal, antiproliferative, anti-inflammatory, antiviral, antipyretic and antiparasitic.2 In this work we are interested in the antiparasitic and antiproliferative activities of the nitro-derivative Schiff bases 2-((5-nitrofuran-2-yl)methyleneamino)phenol (HL1) and 2-(4-nitrobenzylideneamino)phenol (HL2) which were
prepared using a microwave-assisted approach (Figure 1).3 Chagas disease is a neglected tropical illness caused by Trypanosoma cruzi which affects approximately 7 million people worldwide, representing a serious public health problem.4 The only two drugs used to treat this disease are the nitrofurane derivate nifurtimox (Nfx, 3-methyl-4-[(5-nitrofurfurylidene)amino]thiomorpholine-1,1-dioxide) and the nitroimidazole drug benznidazole (Bnz, 2-nitro-N -(phenylmethyl)-1H-imidazole-1-acetamide) (see Figure 1), both of which lead to severe side effects, require long term treatment and are of limited efficacy especially in the chronic phase of the disease. Therefore, the development of more potent and selective new anti-T. cruzi drugs candidates is irrefutable.
a nitrofurane derivative as is Nfx, thus we prepared the nitrobenzene derivative HL2 for comparison. We also prepared the Cu2+ complexes of both nitro derivatives, since the complex can be more active than the free ligand or the complex may activate the ligand as a cytotoxic agent and decrease the cell resistance to the drug. Some side effects caused by ligands can also be reduced by complexation.5 The 1,10-phenanthroline coligand was introduced since bidentate nitrogen donor ligands have proven to be more active than monodentate ligands like pyridine, against microorganisms.6
Metabolic pathways of kinetoplastid parasites, such as Trypanosoma, are similar to those present in tumor cells and produce a correlation between antitrypanosomal and anti-tumor activities.7 In addition, it has been proposed that compounds that efficiently interact with deoxyribonucleic acid (DNA) in an intercalative mode could also show antitrypanosomal activity.7 Thus, in this work, we also evaluated the antiproliferative activities of the Schiff base ligands and their Cu2+ complexes and studied their interaction with DNA and proteins, and the complexes’ ability to displace ethidium bromide (EB) from the DNA-EB complex.
The study of the interaction to DNA for anti-T. cruzi candidates is very important, since the mitochondrial and the nuclear DNA of the Tripanosoma are targets for anti-T. cruzi drugs.8 Furthermore, DNA are the most important target for antitumoral drugs, and different types of interactions between small molecules and DNA are possible: these can often cause DNA damage in cancer cells, blocking the division of cancer cells and resulting in cell death.9
The study of the interaction between small molecules and proteins reveals important information about the
binding mechanism, binding constant, mode and site.10,11 Serum albumin is one of the most studied proteins and is the most abundant in plasma, representing approximately 60% of the blood-plasma.12 Albumins have many physiological functions and the most important property of these proteins is the ability to deposit and transport many compounds.13
In this work, the binding properties of the free Schiff bases and their Cu2+ complexes to DNA and the competitive binding with ethidium bromide were investigated using ultraviolet-visible (UV-Vis) and fluorescence spectroscopy respectively, and the interaction of these complexes with bovine and human serum albumins (BSA and HSA) was also investigated, using the proteins’ intrinsic fluorescence.
Experimental
Materials and physical measurements
All reagents used in the experiments were obtained from commercial sources and used without purification. The reagents 4-nitrobenzaldehyde, 5-nitro-2-furaldehyde, 2-aminophenol, calf-thymus DNA (CT-DNA), ethidium bromide (EB) and [CuCl2(phen)] were purchased from Sigma-Aldrich.
The measurement of the free ligands melting point (uncorrected) was carried out using an MQAPF-302 apparatus. Infrared spectra were recorded on a PerkinElmer Spectrum One spectrophotometer. Nuclear magnetic resonance (NMR) spectra were recorded on a Bruker Avance DRX-200 spectrometer. Chemical shifts were reported in d units downfield from tetramethylsilane (TMS) and J values were given in Hz. Elemental analyses were performed using a CHN PerkinElmer 2400 apparatus.
performed on a CE Instruments model EA 1110. Molar conductivity measurements were performed in dimethylformamide (DMF) solutions, 1.0 × 10⁻³ mol L-1 concentration, using a Quimis conductivity meter (Q405M model). The infrared (IR) spectra were acquired on a Mattson Instruments Galaxy 3000 spectrophotometer using KBr pellets. X-band electron paramagnetic resonance (EPR) spectra were obtained with a Bruker ESP300E spectrometer with a modulation frequency of 100 kHz and a modulation amplitude of 1 mT. A frozen mixture of methanol and dimethyl sulfoxide (DMSO) solutions of the complexes (1 mmol L-1) were measured at liquid N
2 temperature (77 K) in Teflon tubes with a 3 mm internal diameter. A Hewlett Packard 8451-A UV-Vis spectrophotometer was used to obtain UV-Vis spectra with a 1.00 cm quartz cell. Steady state fluorescence measurements were performed on a Varian-Agilent Cary Eclipse spectrophotometer.
A DNA stock solution was prepared by diluting CT-DNA into a 20 mmol L-1 phosphate buffer at pH 7.4 as well as the ethidium bromide, BSA and HSA solutions. A 1.0 × 10⁻³ mol L-1 dimethyl sulfoxide (DMSO) solution of the Schiff bases and Cu2+ complexes were prepared and then diluted in a phosphate buffer at pH 7.4, thus the percentage of DMSO was equal to 1% (v/v) in solution.
Synthesis
Synthesis of the ligands
Schiff bases 2-((5-nitrofuran-2-yl)methyleneamino) phenol (HL1) and 2-(4-nitrobenzylideneamino)phenol (HL2) were obtained using microwave-assisted condensation on the corresponding aldehydes and aromatic amines. The reagents were dissolved in absolute ethanol and the resulting solutions were irradiated in a CEM Discover reactor for 2 minutes. After the reactions were completed, the products were isolated by recrystallization. The compounds were characterized by IR, NMR (1H and 13C), and elemental analysis. Although the structures of these ligands have been noted in the literature,3,14 a complete characterization of these cannot be found and so was described here and in the Supplementary Information section.
2-((5-Nitrofuran-2-yl)methyleneamino)phenol (HL1)
Yield: 84%;m.p.: 170 oC (dec); IR (KBr) ν / cm-1 3357, 3154, 1618, 1585, 1568, 1527, 1487, 1471, 1455, 1397, 1351, 1242, 1168, 1150, 1110, 1018, 971, 956, 941, 884, 821, 804, 760, 749, 739; 1H NMR (200 MHz, DMSO-d
6) 6.84 (t, 1H, J4,3, J4,5 7.8 Hz, H4), 6.94 (d, 1H, J6,5 7.8 Hz, H6), 7.14 (t, 1H, J5,4, J5,6 7.8 Hz, H5), 7.28 (d, 1H, J3,4 7.8 Hz, H3), 7.49 (d, 1H, J9,10 3.9 Hz, H9), 7.81 (d, 1H, J10,9 3.9 Hz, H10), 8.74 (s, 1H, H7), 9.50 (s, 1H, OH); 13C NMR (50 MHz,
DMSO-d6) 114.4, 116.6, 116.8 (C3, C9, C10), 119.6, 120.9 (C4, C6), 129.0 (C5), 136.4 (C2), 146.4 (C7), 151.7, 152.2, 153.7 (C1, C8, C11); elemental analysis for (C11H8N2O4) calcd. (%): C 56.90, H 3.47, N 12.06; found (%): C 56.90, H 3.60, N 12.10.
2-(4-Nitrobenzylideneamino)phenol(HL2)
Yield: 84%;m.p.: 159-160 oC; IR (KBr) ν / cm-1 3321, 1625, 1587, 1514, 1478, 1374, 1341, 1316, 1284, 1231, 1190, 1169, 1142, 1101, 1028, 1009, 965, 940, 849, 836, 787, 757, 730, 683, 671; 1H NMR (200 MHz, DMSO-d
6) 6.85 (t, 1H, J4,3, J4,5 7.5 Hz, H4), 6.94 (d, 1H, J6,5 8.1 Hz, H6), 7.14 (t, 1H, J5,4, J5,6 7.5 Hz, H5), 7.29 (d, 1H, J3,4 7.5 Hz, H3), 8.21-8.41 (m, 4H, H9, H10), 8.88 (s, 1H, H7), 9.26 (br, 1H, OH); 13C NMR (50 MHz, DMSO-d
6) 116.4 (C3), 119.3, 119.5 (C4, C6), 123.8 (C10), 128.6 (C5), 129.8 (C9), 136.9, 142.0 (C2, C8), 148.6, 151.9 (C1, C11), 156.9 (C7); elemental analysis for (C13H10N2O3) calcd. (%): C 64.46, H 4.16, N 11.56; found (%): C 64.50, H 4.20, N 11.60.
Synthesis of the complexes
The complexes were obtained by dissolving 0.31 mmol of the [CuCl2(phen)] in 50 mL of methanol together with gentle heating and stirring. After that 0.31 mmol of HL1 or HL2was added. The mixture was stirred at room temperature for 24 h. The solution volume was reduced using a rotational evaporator. The solids which precipitated were filtered and washed with diethyl ether and dried in vacuum.
[CuCl(L1)(phen)].0.5H2O (1)
Green solid; yield: 44%; elemental analysis for (C23H18ClCuN4O4.5) calcd. (%): C 53.0, H 3.3, N 10.8; found (%): C 52.6, H 3.1, N 10.7; molar conductivity (1 × 10⁻³ mol L-1, DMF): 47 µS cm-1; IR (KBr) ν / cm-1 1240 m ν(CO), 1582 s ν(C=N), 1516 m νas(NO2), 1348 m νs(NO2).
[CuCl(L2)(phen)].2H2O (2)
Green solid; yield: 41%; elemental analysis for (C25H22ClCuN4O5) calcd. (%): C 53.9, H 4.0, N 10.0; found (%): C 54.2, H 3.8, N 9.9; molar conductivity (1 × 10⁻³ mol L-1, DMF): 35 µS cm-1; IR (KBr) ν / cm-1 1224 w ν(CO), 1598 m ν(C=N), 1520 s νas(NO2), 1346 s νs(NO2).
Anti-Trypanosoma cruzi activity
Parasites
puncture from T. cruzi-infected Swiss mice at the peak of parasitemia.15 In order to carry out the trypanocidal analysis for the in vitro analysis on trypomastigotes, the parasites were incubated at 37 °C in the presence of increasing doses (0-200 µmol L-1) of each compound diluted in Dulbecco’s modified medium supplemented with 5% fetal bovine serum and 1 mmol L-1L-glutamine (DMES).16 After 24 h, death rates were determined by light microscopy through the direct quantification of live parasites using a Neubauer chamber, and the drug concentration value that reduces by 50% the number of live parasites (EC50) were then calculated as reported.17
Mammalian cell cultures and toxicity assays
Primary cultures of embryonic cardiomyocytes (CM) were obtained following the previously described method.18 After purification, the CM were seeded at a density of 0.1 × 10⁶ cells per well into 24-well culture plates, or 0.05 × 10⁶ cell per well into 96-well microplates, containing gelatin-coated cover slips and sustained in Dulbecco’s modified medium supplemented with 10% horse serum, 5% fetal bovine serum, 2.5 mM CaCl2, 1 mM
L-glutamine and 2% chicken embryo extract (DMEM). All procedures are in accordance with the guidelines established by the FIOCRUZ Committee of Ethics for the Use of Animals (License 0099/01). All the cultures were maintained at 37 °C in a 5% CO2 atmosphere, and the assays were run at least three times in duplicate. In order to rule out toxic effects of the compounds on mammalian host cells, uninfected CMs were incubated for 24 h at 37 °C in presence or absence of the compounds (up to 200 µmol L-1) diluted in DMEM, then their morphology evaluated by light microscopy and the cell viability measured by the 3-(4,5-dimethylthiazol-2-yl)-2,5-diphenyltetrazolium bromide (MTT) colorimetric assay.19 The absorbance was measured at 490 nm wavelength with a spectrophotometer (VersaMax tunable, Molecular Devices, USA) allowing the determination of the drug concentration value that reduces by 50% the cellular viability (LC50) and the respective selective indexes (SI = LC50/EC50).
Antproliferative activity
Human tumor cell lines U251 (glioma), MCF-7 (breast), NCI-ADR/RES (ovarian expressing a resistant phenotype to adryamycin), 786-0 (kidney), NCI-H460 (lung, non-small cells), PC-3 (prostate), HT-29 (colon), and the normal cell line HACaT were kindly provided by the Frederick Cancer Research & Development Center-the National Cancer Institute- Frederick, MA, USA. Stock cultures were grown in RPMI 1640 (GIBCO BRL, Life Technologies)
supplemented by 5% of fetal bovine serum, penicillin (final concentration of 1 mg mL-1) and streptomycin (final concentration of 200 U mL-1).20-22 Cells in 96-well plates (100 µL cells per well) were exposed to the Schiff bases and complexes (0.25-250 µg mL-1) for 48 h at 37 oC and 5% CO2. After this, cells were fixed with 50% trichloroacetic acid and submitted to sulforhodamine B assay for cell proliferation quantification at 540 nm.23 The compound concentration that inhibits cell growth by 50% (IC50) was determined through non-linear regression analysis using Origin 7.5 software (OriginLab Corporation). Doxorubicin was used as a reference drug. The results presented are from two independent experiments, each one carried out in triplicate.
DNA binding studies
The stock solution of CT-DNA gave a ratio of UV absorbance at 260 and 280 nm (A260/A280) of 1.82, indicating that DNA was sufficiently free of protein contamination.24 The DNA concentration was determined by the UV absorbance at λmax 260 nm after 1:20 dilution using e = 6,600 L mol-1 cm-1.25
The interaction of the complexes with CT-DNA was studied using UV spectroscopy in order to investigate the possible binding modes to CT-DNA and to calculate the binding constant (Kb). The spectra were recorded using a phosphate buffer and 1% DMSO (v/v) in the 200-800 nm range. In the UV titration experiments, the spectra of each compound, in the presence of CT-DNA, were recorded for a constant compound concentration in diverse [CT-DNA]/[compound] mixing ratio (r). The Kbvalues were obtained by monitoring absorbance changes in the compounds’ spectra at 307, 433, 269 and 436 nm, respectively, for HL1, HL2, complexes 1 and 2, with
increasing concentrations of CT-DNA, according to equation 1:26
[DNA]/(εa – εf) = [DNA]/(εb − εf) + 1/[Kb(εb − εf)] (1)
where [DNA] is the DNA concentration in base pairs, εa,
εf and εb correspond to the apparent, free, and fully bound complex absorption coefficients (no absorption change with further addition of DNA), respectively. Kb was calculated by the slope ratio to the y-intercept in plots [DNA]/(εa − εf)
versus [DNA].
phosphate buffer, pH 7.4. The influence of the addition of each compound to the CT-DNA-EB complex solution was obtained by monitoring the variation in the fluorescence emission spectra with λexc = 545 nm at 298 K. Each compound aliquot of 2.9 µmol L-1 was added separately to 3.00 mL of the CT-DNA-EB complex and the resulting fluorescence spectrum was recorded after 5 minutes of each addition. The CT-DNA-EB fluorescence quenching, in the presence of the Schiff bases and their copper(II) complexes, was analyzed according to the Stern-Volmer equation (equation 2):
Fo/F = 1 + KSV[Q] (2)
where F and F0 are the relative fluorescence intensities of DNA in the presence or absence of the quencher, respectively (F0 is taken to be always 100%), [Q] is the concentration of the quencher and Ksv is the Stern-Volmer quenching constant.
Albumin binding studies
Quenching measurements were taken in 3 mL of 2 × 10⁻⁶ mol L-1 BSA and HSA in a 20 mmol L-1 phosphate buffer at pH 7.4. The albumin solutions were titrated by successive additions of the ligands and complexes solutions. The fluorescence emission spectra were measured using an excitation wavelength of 285 and 280 nm, for BSA and HSA, respectively. Experiments were performed at 310 K and pH 7.4.
The albumins’ fluorescence quenching in the presence of the Schiff bases and their copper(II) complexes, at 310 K, was analyzed according to the Stern-Volmer equation (equation 2). Ksv is the Stern-Volmer quenching constant. It is related to the bimolecular quenching constant, kq, and the lifetime in the absence of the quencher, τ0, in the case of collisional quenching processes resulting from diffusive encounters between the fluorophore and the quencher during the lifetime of the excited state. In the case of static quenching (formation of a non-fluorescent ground-state complex) Ksv is the association constant.28
In case of collisional quenching, the bimolecular quenching rate constants (kq) are calculated using equation 3 and considering that the fluorescence lifetime of albumins (τo) are 10-8 s:29
KSV = kqτo (3)
It is important to have in mind that a kq near 1 × 10¹⁰ L mol-1 s-1 is the largest possible value in aqueous solution. The magnitude of KSV sometimes is used to show
that collisional quenching cannot account for the decrease in fluorescence intensity. This is the case if the apparent kq obtained from equation 3 is much greater than the diffusion limited value of 1 × 10¹⁰ L mol-1 s-1.
Results and Discussion
Microanalyses and molar conductivity studies
Microanalyses suggested the formation of [CuCl(L1)(phen)].0.5H2O (1) and [CuCl(L2)(phen)].2H2O (2), where L1 and L2 represents the deprotonated Schiff base ligands coordinated to Cu2+ in a bidentade mode and phen represents the 1,10-phenanthroline coligand. The molar conductivity data revealed that the complexes 1 and 2
were non electrolytes in accordance with the proposed formulations and the deprotonation of the ligands.
Infrared and electronic spectra
In the HL1 and HL2 infrared spectra an absorption band at 3357 and 3321 cm-1, respectively, attributed to the stretching of the phenolic ring OH bond was observed. In the spectra of the Cu2+ complexes an OH stretching band can also be observed due to the presence of the hydration water in the structure of the complexes. The band assigned to the CO stretching appeared at 1242 and 1231 cm-1 in the spectra of the free HL1 and HL2, respectively, and shifted to 1240 and 1224 cm-1 in the complexes 1 and 2 spectra, indicating that the oxygen was coordinated to the copper. Likewise, the band assigned to C=N stretching appeared at 1618 and 1625 cm-1 in the free HL1 and HL2spectra, respectively, and shifted to 1582 and 1598 cm-1 in the complexes 1 and 2 spectra, indicating the involvement of
the azomethine nitrogen in coordination.30 Two absorption bands were observed in 1527 and 1351 and 1514 and 1341 cm-1 in the HL1 and HL2spectra, respectively, and this was attributed to the asymmetric and symmetric stretching of NO2 group, respectively. In the Cu2+ complexes spectra these bands were observed at 1516 and 1348 cm-1 and 1520 and 1346 cm-1 for 1 and 2, respectively.
The 1,10-phenanthroline out-of-plane vibration of the heterocyclic ring hydrogen atoms, appeared at 856 and 740 cm-1 in the phen spectrum and could be identified at 856 and 752 cm-1 in the Cu2+ complexes spectra (see Supplementary Information section).31
Electronic spectra of HL1, HL2, complex 1 and 2
for complex 1 and 2, respectively, was observed. This was
associated to the charge transfer of the Cu2+-ligand. The d-d transition of Cu2+, initially observed at 747 nm for the [CuCl2(phen)] precursor, presented bathochromic shift after complexation, moving to 708 and 740 nm for complex 1
and 2, respectively, thus indicating greater complex stability
(see Supplementary Information section).
EPR spectra of the Cu2+ complexes
The EPR spectra of the complexes were obtained, at 77 K, in a 1:1 mixture of methanol and DMSO solutions to ensure the same solvent for both complexes since 1 is more
soluble in DMSO and 2 in MeOH. The complexes 1 and 2
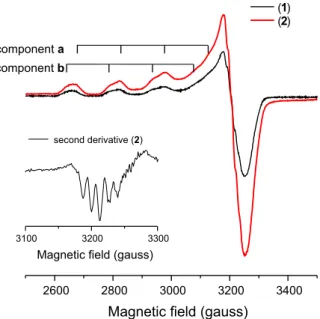
exhibited similar spectra characteristic of complexes with axial symmetry, and no indication of binuclear complex. The g
ll region clearly demonstrates the presence of two species, i.e., two different Cu2+ sites for both complexes. The two sets of hyperfine lines in the parallel region are indicated in Figure 2, and Table 1 also shows the EPR parameters of
these two species. It was observed that the complexes 1 and 2 exhibit the same EPR parameters in frozen solution.
Comparing the EPR parameters of the two species in Table 1, with those of the precursor [CuCl2(phen)], it is observed that one of the species has the same parameters as the precursor. This suggests that the complexes dissociated in solution forming a mixture of the precursor and the Schiff bases complexes.
The insert in Figure 2 shows the second derivative of the spectrum at the g
┴region. A 5-line superhyperfine structure
characteristic of the interaction with two equivalent nitrogen nuclei clearly appears. The superhyperfine splitting constant is equal to 13 gauss. Since the spectrum of [CuCl2(phen)] does not present a nitrogen resolved superhyperfine structure, this structure can be attributed to the second site, which corresponds to the Schiff base complexes.
Anti-Trypanosoma cruzi activity
The activity of the free Schiff bases, CuCl2.2H2O, [CuCl2(phen)] and Cu2+ complexes was assayed against bloodstream trypomastigotes of T. cruzi (Y strain). The EC50 values were determined and the results are presented in Table 2.
The Schiff bases, HL1 and HL2 and [CuCl2(phen)] presented a low to moderated effect on trypomastigotes of T. cruzi, showing EC50 values in the 7-40 µmol L-1 range. The association between Cu2+, phen and the Schiff base in complex 2 did not lead to increased activity.
However complex 1 showed an EC50 value equal to 0.94 ± 0.17 µmol L-1 being approximately 7-fold times more potent than the free phen and 13-fold times more potent than the free Schiff base HL1 and Bnz (the reference drug), thus exhibiting a promising characteristic in the search for Table 1. EPR parameters of the two components, a and b(see Figure 2),
of the Cu2+ complexes 1 and 2 in DMSO:MeOH, 1:1. The EPR parameters of the [CuCl2(phen)] precursor in DMSO are also listed for comparison
Solution (77 K) g┴ gІІ AII / gauss AN / gauss [CuCl2(phen)] 2.074 2.292 155
Component a 2.070 2.291 154
Component b 2.070 2.324 148 13
g┴ and gІІ: the perpendicular and parallel components of the axially
symmetric g tensor; AІІ: the parallel component of the hyperfine splitting
constant from the copper nucleus I = 3/2; AN: the hyperfine splitting constant from two equivalent nitrogen nucleus.
Figure 2. EPR spectra of the complexes 1 and 2 in a mixture of methanol and DMSO (ca. 10-3 mol L-1) at 77 K. Parameters of components a and b appear in Table 1.
Table 2. Activity (mean ± SD) and selectivity index (SI) of the compounds and benznidazole (Bnz) on bloodstream trypomastigotes (BT) forms of T. cruzi (Y strain), in vitro (24 h of incubation at 310 K)
Compound EC50 /
(µmol L-1)
Selectivity index (SI)
HL1 14 ± 5 0.7
HL2 40 ± 22 2.4
[CuCl(L1)(phen)].0.5H2O 0.94 ± 0.17 4
[CuCl(L2)(phen)].2H2O > 96 0.03
CuCl2.2H2O 82 ± 3 6
[CuCl2(phen)]6 7 ± 5 < 4
Bnz 13 ± 2 77
new drugs with anti-Trypanosoma cruzi activity. However, all studied compounds also presented a cytotoxic effect on mammalian cells, leading to a low selectivity index as compared to the reference drug.
Antiproliferative activity
The antiproliferative activity of the free Schiff bases, the copper(II) complexes and doxorubicin, the reference drug, was evaluated using seven tumor cell lines U251 (melanoma), MCF7 (breast cancer), NCI/ADR-RES (resistant ovarian), 786-0 (kidney), NCI-H460 (lung), PC-3 (prostate), HT29 (colorectal) and the normal cell line HaCaT (Table 3).
All analyzed compounds showed cytostatic activity and in some cases there was also cytotoxic activity. The Cu2+ complexes were more active than their respectively free Schiff bases. Although the copper(II) complexes were less potent than the reference drug doxorubicin, they were active in low concentrations (lower than 2 µg mL-1) and had a selective index higher than the reference drug in the majority of cells tested. Thus the studied complexes manifested antitumor potential and are therefore efficacious candidates for in vivo tests.
It is important to note that the anti-T. cruzi agent Nifurtimox has exhibited a promising antitumor effect on neuroblastoma32 and that other anti-T. cruzi candidates like the vanadyl complex, [VO(SO4)(H2O)2(dppz)].2H2O, that includes the bidentate polypyridyl DNA intercalator dipyrido[3,2-a:2’,3’-c]phenazine (dppz) has exhibited antitumor effects with EC50 values in the micromolar range.7
DNA binding studies
The intensity of the HL1, HL2, complexes 1 and 2
absorption bands, in the presence of CT-DNA, resulted in a hypochromic effect, which supported the compound
intercalation with CT-DNA.33 Figure 3 shows, as an example, the UV spectra of HL2 and complex 2, both in
the absence of CT-DNA and the presence of increasing amounts of the latter.
The binding constant (Kb) values obtained for HL1, HL2 and complexes 1 and 2 were in the 0.17-1.84 × 10⁴ L mol-1 range, suggesting moderate binding to CT-DNA, wherein complex 1 showed the higher Kb value (Table 4, Figure 3).12,34
The higher Kb value observed for complex 1 was in corroboration with its greater anti-T. cruzi and antiproliferative activities suggesting that DNA could be an important target for these two activities.
Fluorescence titration experiments were performed using ethidium bromide (EB) as a DNA-intercalator, thus forming the CT-DNA-EB complex, in order to provide more evidence for the interaction mode between HL1, HL2, 1
and 2 with CT-DNA.27 The fluorescence emission spectra
of the CT-DNA-EB complex was verified for an increase in compounds up to a 1:3 DNA:compound ratio. The addition of the Cu2+ complexes lead to an appreciable reduction in the CT-DNA-EB fluorescence absorption intensity, at
λem = 607 nm (Figure 4).
The Ksv values were calculated by the ratio of the slope to the intercept in a plot of I0/I versus compound concentration and showed that the quenching of CT-DNA-EB, by the compounds, was in agreement with the linear Stern-Volmer equation (equation 2), indicating that EB was replaced in the CT-DNA-EB complex by each compound resulting in a decrease in the fluorescence intensity. The results demonstrated that CT-DNA binding affinity was higher for compound 1, followed by 2, HL1 and HL2, which is
in agreement with the calculated Kb values (see Table 4).
Albumin binding studies
The fluorescence quenching spectra of bovine serum albumin (BSA) and human serum albumin (HSA) were Table 3. The effect of free Schiff bases, their copper(II) complexes, [CuCl2(phen)] and doxorubicin (the reference drug) on tumor cell lines (IC50, µg mL-1) and the selective index (SI) in parenthesis
IC50 (SI) / (µg mL-1)
Compound U251 MCF7 NCI/ADR-RES 786-0 NCI-H460 PC-3 HT29
HL1 2.4 (1.1) 3.0 (0.9) 3.1 (0.8) 20.30 (0.1) 3.3 (0.8) 2.5 (1.0) 1.5 (1.7)
HL2 9.2 (1.8) 3.1 (5.3) 17.1 (1.0) 25.0 (0.7) 16.7 (1.0) 24.1 (0.7) 4.4 (3.8)
1 0.2 (3.1) 0.5 (1.2) 1.3 (0.5) 1.573 (0.4) 0.29 (2.1) 0.26 (2.3) 0.50 (1.2)
2 0.5 (3.2) 1.9 (0.8) 1.6 (1.0) 1.495 (1.1) 0.3 (5.3) − 1.0 (1.6)
[CuCl2(phen)] 0.3 (0.2) 0.8 (0.6) 0.6 (0.4) 0.3 (0.2) 1.0 (0.8) 0.6 (0.4) 1.4 (1.0)
monitored in the presence of increasing amounts of the HL1, HL2, complexes 1 and 2. BSA had a strong fluorescence
emission peak at 342 nm after being excited at a wavelength of 285 nm, while HSA had a fluorescence emission peak at 334 nm after being excited at 280 nm.28 The fluorescence intensity of BSA and HSA decreased in the presence of the Schiff bases and their Cu2+ complexes. Upon addition of HL1, HL2, complexes 1 and 2 the fluorescence intensities of BSA
and HSA, taking into consideration a 2:1 compound:albumin
ratio, decreased by 4.42% (HL1:BSA), 29.3% (HL2:BSA), 18.3% (1:BSA), 13.3% (2:BSA), 8.3% (HL1:HSA), 6.8%
(HL2:HSA), 26.2% (1:HSA) and 8.9% (2:HSA). The results
suggested that all the studied compounds could interact with these proteins.31 Figure 5 shows, as an example, the BSA emission spectra in the presence of HL1 and complex 1,
while Figure 6 shows the Stern-Volmer plots for complexes 1
and 2 in the presence of BSA and HSA. The calculated KSV values are listed in Table 5.
The values of the interaction constants between the free Schiff bases and their Cu2+ complexes with BSA were in the 0.44-3.14 × 10⁵ L mol-1 range and with HSA were in the 0.18-2.43 × 10⁵ L mol-1 range, indicating a moderate interaction with BSA and HSA for all the studied compounds. The interaction between a drug and albumins can occur by a static or a dynamic process28 and one form of distinguishing between them is to calculate the bimolecular quenching rate constant, kq (equation 3). The kq values obtained for the free Schiff bases and their Cu2+ complexes were in the 1012-1013 L mol-1 s-1 range, which was far greater than the upper limit of 2.0 × 10¹⁰ L mol-1 s-1,28,35 suggesting that fluorescence quenching of the serum albumins by the Figure 3. The UV spectra in the absence (dashed lines) and presence of CT-DNA at increasing amounts and the [DNA]/(εa – εf) versus [DNA] plot for (a) HL2 and (b) complex 2 in a buffer solution of pH 7.4.
Table 4. The Kb (L mol-1) and the Ksv (L mol-1) values for the interaction between the Schiff bases and copper(II) complexes to CT-DNA and CT-DNA-EB
Compound Kb 104 /
(L mol-1) R2
Ksv 104 /
(L mol-1) R2
HL1 0.79 0.999 4.29 0.979
HL2 0.17 0.993 4.13 0.981
1 1.84 0.999 5.36 0.980
2 0.89 0.999 4.52 0.976
Schiff bases and Cu2+ complexes was predominantly a static process, which requires the quencher to bind to albumin near the Trp residues, with the resulting formation of a non-fluorescent compound.28
Conclusions
The nitroaromatic Schiff bases HL1 and HL2 coordinated to Cu2+ in a bidentate mode forming the monomeric pentacoordinated [CuCl(L1)(phen)].0.5H2O (1) and [CuCl(L2)(phen)].2H2O (2) complexes. Complex 1, which contains the nitrofuran derivative HL1, showed antichagasic activity while 2, which contained the
nitrobenzene derivative HL2, was not active. Complexes 1
and 2 also presented antiproliferative activities in
doses lower than 2 µg L-1, being more potent than their correspondent Schiff bases. The Schiff bases and their Cu2+ complexes could interact with CT-DNA and displace EB from the CT-DNA-EB complex, suggesting an intercalative mode of interaction. Complex 1, which was the most active
against T. cruzi and presented a good antiproliferative active, showed also the highest binding affinity with CT-DNA, suggesting that DNA can be an important target Figure 4. (a)The fluorescence spectra of CT-DNA-EB in the absence (dashed line) and presence of complex 1 in increasing amounts; (b)plot of CT-DNA-EB relative fluorescence intensity at λexc = 545 nm (%) versus r (r = [compound]/[CT-DNA]) in the presence of HL1, HL2, 1 and 2 (up to 52% of the initial CT-DNA-EB fluorescence intensity for HL1, 53% for HL2, 46% for 1 and 49% for 2), phosphate buffer at pH 7.4.
Table 5. The Ksv (L mol-1) values for the interaction between the Schiff bases and copper(II) complexes to albumins
Compound
BSA HSA
Ksv 105 /
(L mol-1) R2
Ksv 105 /
(L mol-1) R2
HL1 0.44 0.980 0.38 0.949
HL2 3.14 0.968 0.18 0.971
1 1.99 0.973 2.43 0.998
2 1.35 0.986 0.43 0.990
BSA: bovine serum albumins; HSA: and human serum albumins; HL1: 2-((5-nitrofuran-2-yl)methyleneamino)phenol; HL2: 2-(4-nitro-benzylideneamino)phenol.
for anti-T. cruzi and antiproliferative activities. All the studied compounds presented moderate binding properties to albumins.
Supplementary Information
Supplementary data are available free of charge at http://jbcs.sbq.org.br as PDF file.
Acknowledgments
The present study was supported by Fundação de Amparo à Pesquisa do Estado de Minas Gerais (FAPEMIG), Fundação Carlos Chagas Filho de Amparo à Pesquisa do Estado do Rio de Janeiro (FAPERJ), FIOCRUZ and Conselho Nacional de Desenvolvimento Científico e Tecnológico (CNPq). The EPR spectrometer from Centro Brasileiro de Pesquisas Físicas (CBPF) was used in this research.
References
1. Sabolová, D.; Kozurkova, M.; Plichta, T.; Ondruzova, Z.; Hudecova, D.; Int. J. Biol. Macromol. 2011, 48, 319. 2. da Silva, C. M.; da Silva, D. L.; Modolo, L. V.; Alves, R. B.;
Martins, C. V. B.; de Resende, M. A.; de Fátima, A.; J. Adv. Res. 2011, 2, 1.
3. Magalhães, T. F. F.; da Silva, C. M.; de Fátima, A.; da Silva, D. L.; Modolo, L. V.; Martins, C. V. B.; Alves, R. B.; Ruiz, A. L. T. G.; Longato, G. B.; de Carvalho, J. E.; de Resende-Stoianoff, M. A.; Lett. Appl. Microbiol.2013, 57, 137.
4. http://www.who.int/mediacentre/factsheets/fs340/en, accessed in May 2016.
5. Conceição Filho, J. C.; Sarria, A. L. F.; Becceneri, A. B.; Fuzer, A. M.; Batalhão, J. R.; da Silva, C. M. P.; Carlos, R. M.; Vieira, P. C.; Fernandes, J. B.; Cominetti, M. R.; PloS One2014,
9, 1.
6. Martins, D. A.; Gouvea, L. R.; Batista, D. G. J.; Silva, P. B.; Soeiro, M. N. C.; Louro, S. R. W.; Teixeira, L. R.; BioMetals
2012, 25, 951.
Lorenzo, J.; Avilés, F. X.; Garat, B.; Gambino, D.; J. Inorg. Biochem.2009, 3, 1386.
8. Gouvea, L. R.; Martins, D. A.; Batista, D. G. J.; Soeiro, M. N. C.; Louro, S. R. W.; Barbeira, P. J. S.; Teixeira, L. R.; BioMetals2013, 26, 813.
9. Yin, H.; Liu, H.; Hong, M.; J. Organomet. Chem.2012, 11, 713.
10. Zhang, G.; Zhao, N.; Hu, X.; Tian, J.; Spectrochim. Acta, Part A
2010, 76, 410.
11. Alvim, H. G. O.; Fagg, E. L.; Oliveira, A. L.; Oliveira, H. C. B.; Freitas, S. M.; Xavier, M. A.; Soares, T. A.; Gomes, A. F.; Gozzo, F. C.; Silva, W. A.; Neto, B. A. D.; Org. Biomol. Chem.
2013, 11, 4764.
12. Khan, A. B.; Khan, J. M.; Ali, M. S.; Khan, R. H.; Kabir-Ud-Din; Spectrochim. Acta, Part A2012, 97, 119.
13. Wang, Y. Q.; Zhang, H. M.; Zhang, G. C.; Tao, W. H.; Tang, S. H.; J. Lumin. 2007, 126, 211.
14. Takebayashi, T.; Iwasawa, N.; Mukaiama, T.; Bull. Chem. Soc. Jpn.1983, 56, 1107.
15. Meirelles, M. N.; Araujo-Jorge, T. C.; Souza, W.; Z. Parasitenkd.
1982, 7, 68.
16. Batista, D. G. J.; Pacheco, M. G. O.; Kumar. A.; Branowska, D.; Ismail, M. A.; Hu, L.; Boykin, D. W.; Soeiro, M. N. C.; Parasitology2010, 137, 251.
17. Daliry, A.; Silva, P. B.; Silva, C. F.; Meuser, M. B.; de Castro, S. L.; Tidwell, R. R.; Soeiro, M. N. C.; J. Antimicrob. Chemother.2009, 64, 747.
18. Meirelles, M. N.; de Araujo-Jorge, T. C.; Miranda, C. F.; Eur. J. Cell Biol. 1986,41, 198.
19. Mosmann, T.; J. Immunol. Methods1983,65, 55.
20. Euzébio, F. P. G.; dos Santos, F. J. L.; Piló-Veloso, D.; Alcântara, A. F. C.; Ruiz, A. L. T. G.; de Carvalho, J. E.; Flogio, M. A.; Ferreira-Alves, D. L.; de Fátima, A.; Bioorg. Med. Chem. 2010, 18, 8172.
21. Euzébio, F. P. G.; dos Santos, F. J. L.; Piló-Veloso, D.; Ruiz, A. L. T. G.; de Carvalho, J. E.; Ferreira-Alves, D. L.; de Fátima, A.; Bioorg. Chem.2009,37, 96.
22. Marquissolo, C.; de Fátima, A.; Ruiz, A. L. T. G.; de Carvalho, J. E.; Pilli, R. A.; Bioorg. Chem. 2009, 37, 52.
23. Monks, A.; Scudiero, D.; Skehan, P.; Shoemaker, R.; Paull, K.; Vistica, D.; Hose, C.; Langley, J.; Cronise. P.; Vaigro-Wolff, A.; Gray-Goodrich, M.; Campbell, H.; Mayo, J.; Boyd, M.; J. Natl. Cancer Inst. 1991, 83, 757.
24. Marmur, J.; J. Mol. Biol.1961, 3, 208.
25. Reichmann, M. E.; Rice, S. A.; Thomas, C. A.; Doty, P.; J. Am. Chem. Soc.1954, 76, 3047.
26. Pyle, A. M.; Rehmann, J. P.; Meshoyrer, R.; Kumar, C. V.; Turro, N. J.; Barton, J. K.; J. Am. Chem. Soc. 1989, 111, 3051. 27. Zampakou, M.; Akrivou, M.; Andreadou, E. G.; Raptopoulou,
C. P.; Psycharis, V.; Pantazaki, A. A.; Psomas, G.; J. Inorg. Biochem.2013, 121, 88.
28. Lakowicz, J. R.; Principles of Fluorescence Spectroscopy, 3rd ed.; Springer: New York, 2006.
29. Togashi, D. M.; Ryder, A. G.; J. Fluoresc. 2008, 18, 519. 30. Barbosa, L. C. A.; Espectroscopia no Infravermelho na
Caracterização de Compostos Orgânicos, 1a ed.; Editora UFV:
Viçosa, 2008.
31. Begum, A. B.; Rekha, N. D.; Kumar, B. C. V.; Ranganatha, V. L.; Khanum, S. A.; Bioorg. Med. Chem. Lett. 2014, 24, 3559. 32. Živec, P.; Perdih, F.; Turel, I.; Giester, G.; Psomas, G.; J. Inorg.
Chem.2012, 117, 35.
33. Sholler, G. L. S.; Kalkunte, S.; Greenlaw, C.; McCarten, K.; Forman, E.; J. Pediatr. Hematol./Oncol. 2006, 28, 693. 34. Chao, H.; Mei, W.; Huang, Q.; Ji, L.; J. Inorg. Biochem. 2002,
92, 165.
35. Ware, W. R.; J. Phys. Chem. 1962, 66, 455.
Submitted: March 2, 2016
Published online: May 11, 2016

![Table 3. The effect of free Schiff bases, their copper(II) complexes, [CuCl 2 (phen)] and doxorubicin (the reference drug) on tumor cell lines (IC 50 , µg mL -1 ) and the selective index (SI) in parenthesis](https://thumb-eu.123doks.com/thumbv2/123dok_br/19001436.463876/7.892.92.825.166.316/table-effect-schiff-complexes-doxorubicin-reference-selective-parenthesis.webp)
![Figure 3. The UV spectra in the absence (dashed lines) and presence of CT-DNA at increasing amounts and the [DNA]/(ε a – ε f ) versus [DNA] plot for (a) HL2 and (b) complex 2 in a buffer solution of pH 7.4.](https://thumb-eu.123doks.com/thumbv2/123dok_br/19001436.463876/8.892.89.781.97.615/figure-spectra-absence-presence-increasing-amounts-complex-solution.webp)
![Figure 4. (a) The fluorescence spectra of CT-DNA-EB in the absence (dashed line) and presence of complex 1 in increasing amounts; (b) plot of CT- CT-DNA-EB relative fluorescence intensity at λ exc = 545 nm (%) versus r (r = [compound]/[CT-DNA]) in the pre](https://thumb-eu.123doks.com/thumbv2/123dok_br/19001436.463876/9.892.118.802.109.390/figure-fluorescence-presence-increasing-relative-fluorescence-intensity-compound.webp)
![Figure 6. Stern-Volmer plots of (F 0 /F)-1 versus [Q] for the fluorescent titration of complex 1 and 2 to 2.0 × 10 -6 mol L -1 of BSA and HSA, 310 K](https://thumb-eu.123doks.com/thumbv2/123dok_br/19001436.463876/10.892.90.779.107.629/figure-stern-volmer-plots-versus-fluorescent-titration-complex.webp)
