http://dx.doi.org/10.1590/S1982-21702014000100001
IMPROVING EGM2008 BY GPS AND LEVELING DATA AT
LOCAL SCALE
Melhoria do EGM2008 em escala local através de dados de nivelamento e GPS
METIN SOYCAN
Yıldız Technical University
Civil Engineering Faculty, Geomatics Engineering Division Istanbul-Turkey
ABSTRACT
The development of the Earth Gravitational Model 2008 (EGM2008) model is a significant contribution for modeling the Earth’s gravity and geoid. Recently, it can be confidently used versus geometric models following a simple refinement procedure. Several studies show that, EGM2008 can reach the accuracy of regional or local geoid models after modeling the differences between the GPS-leveling geoid heights and EGM2008 derived geoid heights at identified control points. The study focuses on a corrector surface fitting (CSF) approach based on radial basis functions (RBF) as improvement procedure for EGM2008. A detailed mathematical model and solution algorithm of the proposed model is given, and it has been applied in different test areas covering the city borders of Bursa, Konya, Denizli and Gaziantep in Turkey. Accuracy of the improved model was evaluated in scattered check points within test regions. The geoid heights of all check points obtained by GPS-leveling measurements were compared with the geoid heights obtained from improved model. The discrepancies between the calculated and measured geoid heights were analyzed and discussed.
Keywords: Geoid; GNSS; Leveling; GPS; EGM2008.
RESUMO
mostram que o EGM2008 pode alcançar a acurácia dos modelos geoidais regionais ou locais após modelar as diferenças entre as alturas geoidais do GPS-nivelamento e as alturas geoidais derivadas do EGM2008 em pontos de controle apropriadamente selecionados. O estudo centra-se no ajuste de uma superfície de correção (CSF- Corrector Surface Fitting) baseada em funções de base radial (RBF - Radial Basis Functions) como procedimento de melhoria para o EGM2008. Nesse artigo são apresentados o modelo matemático detalhado e o algoritmo de solução do modelo proposto, aplicados em diferentes áreas de teste, abrangendo as fronteiras das cidades de Bursa, Konya, Denizli e Gaziantep, na Turquia. A acurácia do modelo melhorado foi avaliada em pontos de verificação dispersos nas regiões de teste. As alturas do geoide de todos os pontos de verificação obtidos por medições de GPS-nivelamento foram comparados com as alturas geoidais obtidas do modelo melhorado. As discrepâncias entre as alturas geoidais calculadas e medidas foram analisadas e discutidas.
Palavras-Chave: Geoide; GNSS; Nivelamento; GPS; EGM2008.
1. INTRODUCTION
As geoid is a function of density and mass distribution, data used in geoid determination represents the mass-density distribution of the Earth (MORITZ, 1980; TORGE 1980). The geoid surface can be defined using the data obtained via applying different measuring techniques to the Earth in general or to a specific region. Geoid can be considered as a point, a profile or a surface. Users need for precise local geoid to detect of short and ultra-short wavelength components. Several approaches are used to establish such a geoid in practice. In recent applications, approaches were adopted to determine long wavelength effects utilizing the earth’s potential coefficients, medium wave length effects utilizing gravity, and short and ultra-short wavelength effects utilizing combined methods (KIAMEHR, and SJOBERG 2005, BENAHMED DAHOA et al 2006; FEATHERSTONE and SPROULE, 2006; KOTSAKIS and KATSAMBALOS, 2010)
because they are incorporating the best quality data available for the whole Earth (CORCHETE 2010). EGM2008 was published by the National Geospatial-Intelligence Agency (NGA). It replaced the Earth Gravitational Model 1996 (EGM96) (LEMOINE et al 1998) model which had been the default global geoid since its publication in 1996. The official Earth Gravitational Model EGM2008 has been publicly released by the NGA EGM development team. This gravitational model is complete to spherical harmonic degree and order 2159, and contains additional coefficients extending to degree 2190 and order 2159. The model was computed from a global 5 arc-minute grid of gravity anomalies from land and satellite based sources. The model is provided complete to spherical harmonic degree and order 2159, which equates to a grid size of approximately 6.5 km. EGM2008 is available from the NGA website. It is provided in terms of spherical harmonic coefficients which generally need to be converted into a grid of geoid undulations before they can be used (http://earth-info.nga.mil/GandG/wgs84/ gravitymod/egm2008/). The geoid heights with respect to WGS 84 are computed using the EGM2008 Tide Free Model and its associated height anomaly to geoid heights correction model plus a zero-degree term for the height anomaly equal to 41 cm. The zero degree term, which is due to the difference between the GM-values of the EGM2008 and that of the reference elliposoid. In this study, EGM2008 Tide Free Model with zero-degree term correction were used to achieve EGM2008 derived quantities by using a calculation service that is provided by ICGEM (International Centre of Global Earth Models at GFZ (component of IGFS)).
As a result of our previously investigation, the consistency of the EGM2008 geoid with GPS-leveling data is approximately 10 cm in many countries. Due to the lack of Turkish proprietary gravity and GPS/leveling data in the EGM2008 computations, direct use of EGM2008 does not guarantee an accurate transformation of the ellipsoidal heights to the orthometric heights in an absolute form. In a study conducted by Kilicoglu et al (2009), the EGM2008-derived geoid heights were compared with the GPS/leveling geoid heights, and existing GPS/leveling fitted regional quasi-geoid model of TURKEY (TG03), The mean value and standard deviation (STD) of the differences between EGM08 derived and observed quantities are found to be -0.888 m and 0.242 m for GPS/leveling height anomalies, 0.271 m and 0.753 m for TG03 quasi-geoid heights. It is easily recognized that, there is an inconsistency between the geoid heights of the EGM2008 model and the GPS/leveling geoid heights or TG03. The discrepancies resulting from the bias, tilt and shift, have to be corrected for the use of EGM2008 in practice for TURKEY and surrounding areas if the constructed geoid model is mainly used for GPS leveling.
studies; there are several methods available, such as least squares adjustment with a four, five or seven parameter transformation model, least squares or robust estimations with polynomial models, least squares collocation, finite element method (FEM), the Fourier series, the continuous curvature splines in tension and other interpolation methods. A number of simpler interpolation algorithms, such as inverse distance weighting, bilinear interpolation, polynomial regression, triangulation, RBF and nearest-neighbor interpolation, were already well known methods. The diversity of methods leads to the conclusion that no method is better or worse than another. However they may differ from each other when considering the application area, surface features, data, accuracy and ease of calculation.
RBFs are the popular approach, with their widespread applications in many areas. One of the advantages of the model is its flexibility within the single RBF. The RBF methods are modern ways to approximate multivariate functions. RBF method has also been used to interpolate irregularly spaced data, which computes the signed distance function prior to generating the RBF interpolant. Different type functions can be used as the depending on the surface and data characteristic.The most useful RBF, which provides good accurate approximations, is multiquadrics (MQ). The MQ is an effective tool for scattered data interpolation problems. Many scientific researches show that the MQ function can be applied confidently in most cases (HARDY AND GOFERT 1975; POTTMANN AND ECK, 1990; FOGEL AND TINNEY,1996; LAZZARO AND MONTEFUSCO, 2002; SOYCAN and SOYCAN, 2003; SOYCAN and SOYCAN, 2009; SOYCAN, 2010). The MQ has been applied in the prediction of gravity anomalies, distortion modeling. It seems to be a very powerful tool for the improvement of a EGM2008 geoid with GPS and leveling data to reduce the large systematic errors, longh wavelenght effects of the global model and other effects. In this study, we probe into RBF with MQs versus parametric models namely single bias parameter with a constant offset (SBP), four-parameter model (FPM) and seven-four-parameter model (SPM).
2. AN IMPROVEMENT PROCEDURE FOR EGM2008
CSF technique based on RBF with MQs was worked through as improvement procedure for EGM2008. A short review of the mathematical background of proposed model is given, in following section. As mentioned previously, the differences between the GPS-leveling geoid heights and EGM2008 geoid heights reflect datum inconsistencies between the available height data, long wavelength geoid errors and GPS and leveling errors included in the ellipsoidal and orthometric heights.The improvement of EGM2008 with GPS-leveling data is based on modeling and interpolation of the differences between the GPS-leveling geoid heights and EGM2008 geoid heights at identified control points.
The CSF algorithm with RBF’s defined below with the following equilibrium constraints as (FOGEL and TINNEY 1996, SOYCAN and SOYCAN 2009, SOYCAN, 2010);
, . . . ∑ .
. ! " (2)
∑ ∑ . ∑ . 0 (3)
In equation 2, the first three terms indicate a trend surface with the simple planar surface, a0,a1,a2 are the coefficients of the planar trend surface; φ, λ are the
elipsoidal geographic coordinates of control points; ∆N is the differences between the GPS-leveling geoid height and EGM2008 geoid height; c is the surface coefficients. Di is anisotropically rescaled, relative distance from a control point (φi,
λi) to the other control point (φj, λj) for all i and j (i, j=1, 2,..., n). aiT is the transpose of the design matrix, x is the unknown parameter and vi is the residual vector for matrix solution for Eq(2). A generelized solution algorithm of the method used in study can be illustrated in Figure 1 and given as follows:
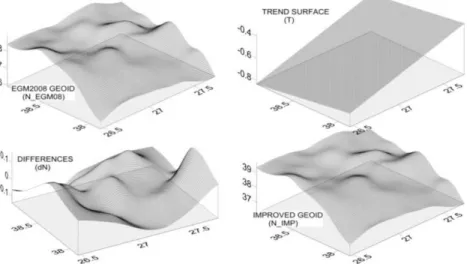
I. Firstly, a trend surface is fitted to the application of method by
using control points. Trend surface may be fitted by polynomial, harmonic series or trigonometric functions. According to our previous experiences, usage of the first or second degree polynomial functions can be sufficient in practice. Determination of the improved model was carried out through 3 parameter trend solution according to the first order polynomial.
. . $ (4)
II. The trend values calculated for each point then dN values were calculated by subtracting the geoid height differences.
% (5)
III. Subsequently, dN values were modeled by least squares fitting with a suitable surface. For this purposes, the RBF algorithm with MQs were used. Thus, dN values were calculated for the corners of the defined grid.
IV. Finally, the improved geoid height value at any point can be calculated by adding the trend value (T), and the difference value (dN) to known EGM2008 geoid height as follows.
Figure 1 - Representation of improvement procedure.
3. THE NUMERICAL STUDY ON REAL DATA SET
In this section, the accuracy of EGM2008 model was tested at regional and local level in terms of performance of each improved model. For this purpose, several test regions with sufficiently and homogenously distributed GPS-leveling check points were considered on the different part of Turkey (Figure 2).
In principle, test regions were selected in coastal, center, corners and edges of the Turkey due to fact that, the accuracy of the improved geoid model depends on the size, topographic variations and changes in the geoid height and the geometry of the control points. In the test regions, hundreds of points with GPS derived ellipsoidal heights and orthometric heights determined by geometrical leveling can be available. The GPS networks were created based on Turkey's National Fundamental GPS Network (TUTGA) and it was calculated in ITRF96 datum, 2005 epoch. The final positions were obtained as latitude, longitude, and ellipsoidal height components by GPS Network adjustment. The leveling network was created based on Turkey's National Vertical Control Network (TUDKA). The orthometric heights were determined as the result of the adjustments to the leveling network by similar way (TUTGA-99A, 1999).
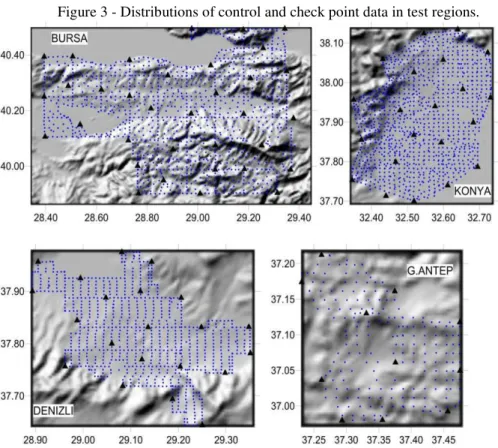
Consequently, the geographical locations, ellipsoidal and orthometric heights of all the geoid reference points, which were established and calculated, using GPS and leveling networks separately, were accurately known in the borders of test regions. The number of the GPS-leveling control points and their distribution is excellent and that can correct the inconsistencies between GPS-leveling and EGM2008 geoid heights. A limited number of them were chosen as control point. The control points were selected as homogeneous as possible in adequate frequency and proper distribution. The improved geoids were determined with the help of 34, 21, 21 and 11 control points (shown as triangle in Figure 3) in Bursa, Konya, Denizli and GaziAntep cities respectively. The remainder points (shown as dot in Figure 3) were considered as check points to check the results of calculations. A great number of check points (Table 1) were used all section over the test regions. The fitting were performed by using SBP, FPM, SPM and CSF methods. Then, the EGM2008 geoid surface of the four test areas were transformed into the GPS-leveling datum.
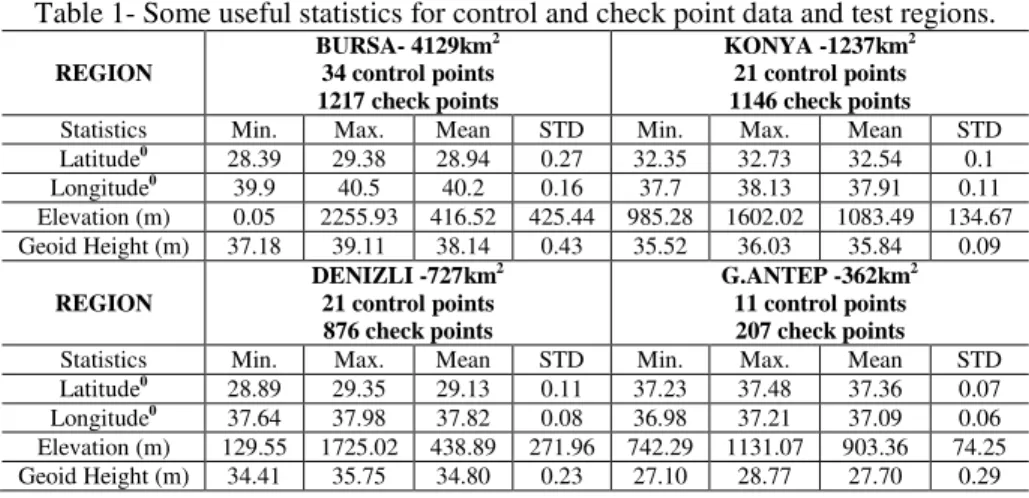
Table 1- Some useful statistics for control and check point data and test regions.
REGION
BURSA- 4129km2
34 control points 1217 check points
KONYA -1237km2
21 control points 1146 check points Statistics Min. Max. Mean STD Min. Max. Mean STD Latitude0 28.39 29.38 28.94 0.27 32.35 32.73 32.54 0.1
Longitude0 39.9 40.5 40.2 0.16 37.7 38.13 37.91 0.11
Elevation (m) 0.05 2255.93 416.52 425.44 985.28 1602.02 1083.49 134.67 Geoid Height (m) 37.18 39.11 38.14 0.43 35.52 36.03 35.84 0.09
REGION
DENIZLI -727km2
21 control points 876 check points
G.ANTEP -362km2
11 control points 207 check points Statistics Min. Max. Mean STD Min. Max. Mean STD Latitude0 28.89 29.35 29.13 0.11 37.23 37.48 37.36 0.07
Longitude0 37.64 37.98 37.82 0.08 36.98 37.21 37.09 0.06
Figure 3 - Distributions of control and check point data in test regions.
4. ANALYSIS OF RESULTS
In order to determine the quality of applied models, it was examined the
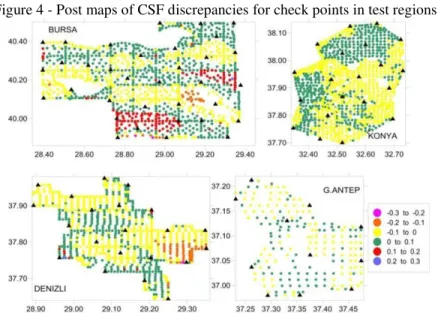
Figure 4 - Post maps of CSF discrepancies for check points in test regions.
Table 2 - Classification of CSF discrepancies.
Interval(m) BURSA KONYA DENIZLI GAZIANTEP
Max. Min % # % # % # % #
-0.3 -0.2 0.2 3 0 0 0.1 1 0 0
-0.2 -0.1 2.3 28 0 0 6.4 56 0 0
-0.1 0. 35 426 53.3 611 53 464 54.6 113
0. 0.1 50.6 615 46.7 535 39.1 343 45.4 94
0.1 0.2 11.6 141 0 0 0.9 8 0 0
0.2 0.3 0.3 4 0 0 0.5 4 0 0
Denizli. The discrepancies varied between -0.313m and -0.439m, the mean is 0.027, the STD is 0.087m and the RMS is 0.090m for Bursa. For the Denizli test regions the RMS error obtained as 0.070 in the range of 0.340 to -0.283 maximum and minimum values with 0.069 STD and -0.014m mean.
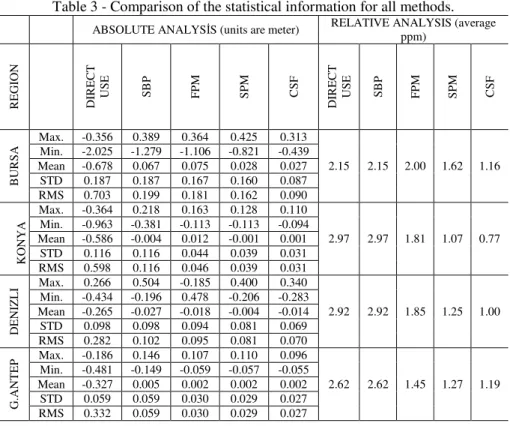
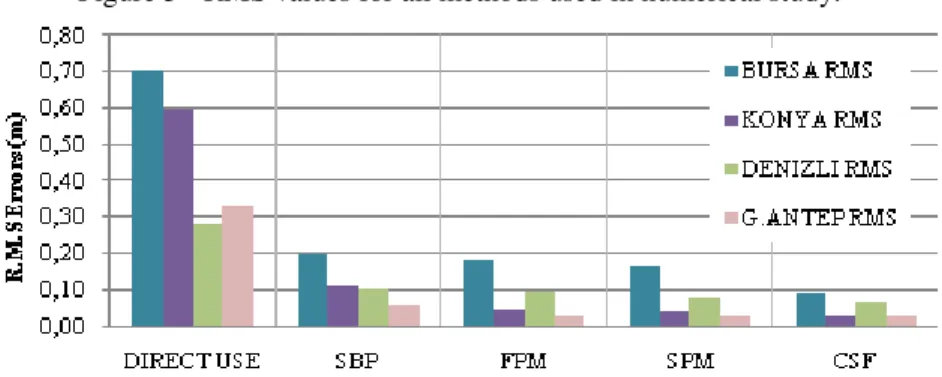
It is clear that, the systematic biases and unsystematic deviations in the differences between global geoid models derived geoid height from a geopotential model and GPS/levelling data cause some inconsistencies for fitting. CSF with MQ produces a smooth surface, the resulting surface pass exactly through the data points. Thus, the used reference points do not contain any residuals after modeling. This is an important advantage. It is understood that CSF method is more consistent than the others in terms of standard deviation and RMS in Table 3. Because, the high frequency distortions were extracted by CSF model, thus the major part of inconsistencies can be minimized. The absolute accuracy of EGM2008 (direct use) cannot yet satisfy mm or cm level accuracy requirements but it provides an option for determination of orthometric height differences by GPS leveling in relative sense. The use of improved model (SBP, FPM, SPM or CSF) provides significant improvement over the all test regions (Table 3).
Table 3 - Comparison of the statistical information for all methods. ABSOLUTE ANALYSİS (units are meter) RELATIVE ANALYSIS (average ppm)
R E G IO N D IR E C T U S E S B P F P M S P M C S F D IR E C T U S E S B P F P M S P M C S F B U R S A
Max. -0.356 0.389 0.364 0.425 0.313
2.15 2.15 2.00 1.62 1.16 Min. -2.025 -1.279 -1.106 -0.821 -0.439
Mean -0.678 0.067 0.075 0.028 0.027 STD 0.187 0.187 0.167 0.160 0.087 RMS 0.703 0.199 0.181 0.162 0.090
K
O
N
Y
A
Max. -0.364 0.218 0.163 0.128 0.110
2.97 2.97 1.81 1.07 0.77 Min. -0.963 -0.381 -0.113 -0.113 -0.094
Mean -0.586 -0.004 0.012 -0.001 0.001 STD 0.116 0.116 0.044 0.039 0.031 RMS 0.598 0.116 0.046 0.039 0.031
D
E
N
IZ
L
I Max. 0.266 0.504 -0.185 0.400 0.340
2.92 2.92 1.85 1.25 1.00 Min. -0.434 -0.196 0.478 -0.206 -0.283
Mean -0.265 -0.027 -0.018 -0.004 -0.014 STD 0.098 0.098 0.094 0.081 0.069 RMS 0.282 0.102 0.095 0.081 0.070
G
.A
N
T
E
P Max. -0.186 0.146 0.107 0.110 0.096
2.62 2.62 1.45 1.27 1.19 Min. -0.481 -0.149 -0.059 -0.057 -0.055
In terms of relative geoid accuracy, the improved EGM2008 models showed suitable results for relative accuracy over all baseline classes that were considered in this study. Although large relative errors were released in short baselines (up to 10 km), ppm (parts per million) values decreases rapidly for baselines ranging from 10 km to 50 km. It provides an average of 1 ppm (0-1 baseline range were omitted) accuracy for all selected baselines (Table 4).
Table 4 - Statistics about relative accuracy for CSF model in different baseline range.
BURSA KONYA
Baseline
(km) #
Baseline
PPM
Max. Min. Mean
0-1 185 482.34 0.03 23.05 1-10 45878 43.28 0.00 2.71 10-20 111943 16.33 0.00 1.61 20-30 144086 7.01 0.00 0.96 30-40 144996 4.95 0.00 0.69 40-50 125100 3.53 0.00 0.57 50-100 168966 3.34 0.00 0.41
Overall 1.16
Baseline
(km) #
Baseline
PPM Max. Min. Mean 0-1 931 364.79 0.00 8.73 1-10 123926 35.31 0.00 2.47 10-20 240961 4.74 0.00 0.65 20-30 195432 2.15 0.00 0.35 30-40 81005 1.38 0.00 0.21 40-50 13830 1.02 0.00 0.17
50-100 - - - -
Overall 0.77
DENIZLI G.ANTEP
Baseline
(km) #
Baseline
PPM
Max. Min. Mean
0-1 1321 456.97 0.00 11.57 0-10 101451 59.36 0.00 2.66 10-20 168324 13.58 0.00 1.25 20-30 90014 5.42 0.00 0.92 30-40 20898 4.84 0.00 0.70 40-50 1242 1.75 0.00 0.48
50-100 - - - -
Overall 383250 1.00
Baseline
(km) #
Baseline
PPM
Max. Min. Mean
0-1 76 227.295 0.675 20.285 1-10 8806 35.28 0 2.05 10-20 10417 5.98 0 1.07 20-30 2022 2.925 0 0.46
30-40 - - - -
40-50 - - - -
50-100 - - - -
Overall 21321 1.19
5. COMPARISON OF THE MODELS WITH NATIONAL GEOID
In this section, it was compared the proposed model with the TG03 national model conducted by the General Command of Mapping within the borders of Turkey. TG03 was computed in 2003 with heterogeneous data (gravity, topography and geoid heights) were used by Least Squares Collocation (LSC) in a remove-restore procedure. EGM96 was used as the reference model of the Earth’s geopotential model. The data used consist of surface gravity anomalies (on ~ 65000 stations), gravity anomalies derived from ERS1, ERS2 and TOPEX/POSEIDON altimetry data (on~ 20000 stations), gravity anomalies derived from ship observations (on ~ 10000 stations), GPS/leveling geoid heights (on 197 stations) and topographic heights. The absolute accuracy of TG03 is given to be 0.088 m in the national report of Turkish National Union of Geodesy and Geophysics.
The geoid heights from improved EGM2008 and TG03 were compared at 0.005o×0.005 o grid nodes (Figure 6). Table 5 shows the statistics of the differences.
Table 5 - Summary of the statistical information for comparison with TG03 and CSF.
BURSA KONYA DENIZLI G.ANTEP
Number of Grid Points 28767 7371 6555 2601
Grid Size0 0.005 0.005 0.005 0.005
Min. -0.909 -0.283 -0.429 0.005
Max. 0.278 0.259 0.345 0.128
Mean. 0.083 0.064 0.087 0.075
STD 0.144 0.101 0.093 0.022
RMS 0.166 0.119 0.127 0.078
*Units are meter
As a result of the investigation of the geoid height discrepancies; it is varying between -0.909m and 0.345m, the mean is varying between -0.083m to 0.087, the STD is varying between 0.022m to 0.144m, and the RMS error is varying between 0.078m to 0.166m for all test regions. It is easily recognized that, there is a small bias (approximately 0.08 m) between the geoid heights of the TG03 model and the improved EGM2008 models. The consistency of our local models with TG03 is around ±0.10m.
6. RESULTS
The following results can be listed from the investigations:
• The absolute consistency (RMS) of the EGM2008 geoid (direct use) with GPS/leveling data is not satisfactory for test regions, i.e., 0.703 m for Bursa and 0.598 m for Konya, 0.332 m for Gaziantep and 0.282 m for Denizli.
• Although, the first version of improved EGM2008 geoid (SBP) consistence with GPS/leveling data for Gaziantep areas with 0.059 m RMS, the other regions still need improvement.
• The consistencies are adequate and it also similar for FPM and SPM in Konya, Denizli and Gaziantep. However, the consistency of Bursa a little bit larger than the previous ones, i.e., 0.162 m for Bursa, 0.039 m for Konya, and 0.081 m for Denizli and 0.029 m for Gaziantep.
• The consistency of the improved geoid model (CSF) with the GPS/leveling data at the checkpoints is 0.090, 0.031, 0.070 and 0.027 m respectively for Bursa, Konya, Denizli and Gaziantep.
• The proposed refinement method improved the SPM consistencies from 0.199 m to 0.090 m by 55% for Bursa, from 0.116 m to 0.031 m by 73% for Konya, from 0.102 m to 0.070 m by 31% for Denizli and from 0.059 m to 0.027 m by 53% for Gaziantep.
• On the other hand, improvement of the relative consistencies is also significant. The relative accuracies are improved from ~2.5 ppm to ~1 ppm by 60% for overall.
• These results indicate that the proposed method (CSF) works well and can significantly improve the accuracy of EGM2008 global geoid for Turkey. • Based on the above information, one could say that the improved geoids
offer about ±0.04-0.05 m accuracy.
• As for relative accuracy, it may be obtained higher than this value. The mean ppm value shows that, our local model can recover orthometric height differences with a precision of about ~1-2 ppm (mm/km).
7. CONCLUSION
acceptable accuracy. Successful improvement of the global geoid model at local scales depends on the elemination of systematic biases in the differences between the geoid heights. The accuracy and the distrubition of the control points, topographical changes and geoid height variations are important factors. All examination and evaluations show that fitting of the differences between the GPS-leveling and EGM2008 geoid heights by using parametric models may not supply accurate solutions. The magnitude of the discrepancies and the large RMS values for the check points show that some factors cause systematic effects and elimination of this effects by using parametric models is not possible for the large area with topographic changes and variations in geoid heights. It can be easily seen from the evaluation and examination that the accuracy and capacity of parametric models are not sufficient for Bursa and Denizli cities. In such circumstances, a model that minimizes inconsistency should be used instead of parametric models. However, according to the results of evaluations made, it is seen that the CSF, one of the alternative methods, yields rather suitable results in check points.
To use GPS in an effective manner in determining orthometric heights, EGM2008 should be calibrated using base points with 15-20 km frequencies or with more frequent spaces in mountainous, hilly and rugged region with GPS and leveling data. As a rule, at least four points up to 200 km, in addition to this, appropriate scattered points are determined for every 200 km. Despite the fact that, GPS-leveling geoids have great significance for more accurate height transformation of GPS derived ellipsoidal heights for practical geodetic applications until the late 2000s,today, also the improved global and regional geoid models can be used for GPS-leveling in local level. In the near future, it is expected that global geoid models will be improved as achievable accuracy (a few cm) via new satellite gravity missions and other sources of Earth’s gravity field.
REFERENCES
ABBAK R.A., SJÖBERG L.E., ELLMANN A., USTUN A., 2012. “A precise gravimetric geoid model in a mountainous area with scarce gravity data: a case study in central Turkey”. Studia Geophysica et Geodaetica, Vol.56, Issue 4, pp 909-927.
BENAHMED DAHOA, S.A., FAIRHEAD, J.D. 2007. Accuracy assessment of the available geoid models in Algeria. Computers & Geosciences 33, 76–82. BENAHMED DAHOA, S.A., KAHLOUCHEA, S., FAIRHEAD, J.D., 2006. A
procedure for modeling the differences between the gravimetric geoid model and GPS/leveling data with an example in the north part of Algeria. Computers & Geosciences 32, 1733–1745.
CORCHETE ,V., 2010. The high-resolution gravimetric geoid of Italy: ITG2009. Journal of African Earth Sciences. Vol.58, Issue 3, 580–584
FEATHERSTONE, W. E., SPROULE, D. M., 2006. Fitting Ausgeoid98 to the Australian height datum using GPS-leveling and least squares collocation: application of a cross-validation technique. Survey Review 38-301, 574-582. FEATHERSTONE, W.E., 2001. Absolute and relative testing of gravimetric geoid
models using Global Positioning System and orthometric height data. Computers & Geosciences 27, 807–814.
FOGEL D.N, TINNEY L.R (1996). Image Registration using Multiquadric Functions, the Finite Element Method, Bivariate Mapping Polynomials and Thin Plate Spline. National Center for Geographic Information and Analysis. Technical Report 96-1.
HARDY, R. L. AND W. M. GOFERT 1975. Least squares prediction of gravity anomalies, geoidal undulations, and deflections of the vertical multiquadric harmonic functions, Geophysical Research Letters, 2, 423-426.
IAG (International Association of Geodesy). 1995. New Geoids in the world. Bulletin d’information N.77. Iges Bulletin N.4 Special Issue.
KIAMEHR, R. and SJOBERG, L.E., 2005. Comparison of the qualities of recent global and local gravimetric geoid model in Iran. Studia Geophysica et Geodaetica, 49: 289-304.
KILICOGLU A., DIRENC A., SIMAV M., LENK O., AKTUG B., YILDIZ H.,2009. Evaluation of the Earth Gravitational Model 2008 in Turkey. Bureau Gravimétrique International. International Geoid Service Joint Bulletin (Newton’s Bulletin). External Quality Evaluation Reports of EGM08. pp. 164-171.
KOTSAKIS, C., KATSAMBALOS, K., 2010. Quality analysis of global geopotential models at 1542 GPS/leveling benchmarks over the Hellenic mainland. Survey Review 42-318, 327-344.
LAZZARO D, MONTEFUSCO L.B, (2002). Radial basis functions for the multivariate interpolation of large scattered data sets. Journal of Computational and Applied Mathematics. (140): 521-536
LEMOINE, F. G., S. C. KENYON, J. K. FACTOR, R. G. TRIMMER, N. K. PAVLIS, D. S. CHINN, C. M. COX, S. M. KLOSKO, S. B. LUTHCKE, M. H. TORRENCE, Y. M. WANG, R. G. WILLIAMSON, E. C. PAVLIS, R. H. RAPP, AND T. R. OLSON, (1998). The development of the joint NASA GSFC and the National Imagery and Mapping Agency (NIMA) geopotential model EGM96, NASA Technical Paper NASA/TP-1998-206861, Goddard Space Flight Center, Greenbelt.
MORITZ, H.,1980. Advanced Physical Geodesy. Herbert Wichmann Verlag, Karlsruhe. 500 pages.
OLLIKAINEN, M., 1997. Determination of Orthometric Heights Using GPS Leveling. Publications of the Finnish Geodetic Institute. Kirkkonummi. PAVLIS, N. K., S. A. HOLMES, S. C. KENYON, AND J. K. FACTOR, 2012. The
PAVLIS, N.K, S.A. HOLMES, S.C. KENYON, J.K. FACTOR, 2008. An earth gravitational model to degree 2160. Geophysic Res (Abstract 10, EGU2008-A-01891, 2008, Ref ID: 1607-7962/gra/EGU2008-A-EGU2008-A-01891, EGU General Assembly).
POTTMANN, H. AND M. ECK 1990. Modified multiquadric methods for scattered data interpolation over a sphere, Computer Aided Design, 7, 313-321.
SOYCAN A., 2010. Digital cameras derived raster image transformation of old map sheets, Scientific Research and Essays, Vol. 5, Issue 24, pp. 4011-4017. SOYCAN A., SOYCAN M., 2009. Digital Elevation Model Production from
Scanned Topographic Contour Maps via Thin Plate Spline Interpolation, Arabian Journal for Science and Engineering, Vol. 34, Issue 1, pp. 121-134. SOYCAN, M., 2006. Determination of Geoid Heights by GPS and Precise
Trigonometric Leveling. Survey Review 38-299, 387-396.
SOYCAN, M., SOYCAN A., 2003. Surface Modeling for GPS-Leveling Geoid Determination. International Geoid Service 1-1, 41-51.
TORGE, W., 1980. Geodesy. Walter de Gruyter, Berlin New York, 134–137. TUTGA-99A (Turkish National Fundamental GPS Network-1999A). General
Command of Mapping. Harita Dergisi. Special Issue. No: 16.
[http://earth-info.nga.mil/GandG/wgs84/gravitymod/egm2008/]- Access date: 10-10-2012.
[http://icgem.gfz-potsdam.de/ICGEM/]- Access date: 10-10-2012.