http://dx.doi.org/10.1590/S1982-21702014000100009
ANALYTICAL QUALITY ASSESSMENT OF ITERATIVELY
REWEIGHTED LEAST-SQUARES (IRLS) METHOD
Avaliação da qualidade analítica do métdo dos mínimos quadrados interativo com a atribuição de novos pesos
JIANFENG GUO
Info Engineering University
62 Kexuedadao Rd, P.O. Box 2201-160, Zhengzhou, 450001, China [email protected]
ABSTRACT
The iteratively reweighted least-squares (IRLS) technique has been widely employed in geodetic and geophysical literature. The reliability measures are important diagnostic tools for inferring the strength of the model validation. An exact analytical method is adopted to obtain insights on how much iterative reweighting can affect the quality indicators. Theoretical analyses and numerical results show that, when the downweighting procedure is performed, (1) the precision, all kinds of dilution of precision (DOP) metrics and the minimal detectable bias (MDB) will become larger; (2) the variations of the bias-to-noise ratio (BNR) are involved, and (3) all these results coincide with those obtained by the first-order approximation method.
Keywords: IRLS; Outlier; DOP; MDB; BNR.
RESUMO
Todos os resultados coincidirão com aqueles obtidos com o método de aproximação de primeira ordem.
Palavras-chave: IRLS; Outlier; DOP; MDB; BNR.
1. INTRODUCTION
Least-squares (LS) method exhibits a poor performance in the presence of outliers. A reliable alternative to LS is given by the robust regression techniques. Iteratively updating the weights yields the iteratively reweighted least squares (IRLS) algorithm, which is the most common method for computing M-estimates (HUBER 1981, HUBER and RONCHETTI 2009). In fact, IRLS has been extensively employed in geodetic and geophysical literature (CHANG and GUO 2005, RANGELOVA et al. 2009, GUO et al. 2010, COLLILIEUX et al. 2012).
Under the assumption of only one outlier exists, Baarda (1968) developed his famous testing procedure in the framework of mean-shift outlier model (GUO 2013), which ultimately led to the reliability theory. Extension of reliability measures for correlated observations was discussed by Wang and Chen (1994), Schaffrin (1997) and Ou (1999). Generalized measures of reliability in the presence of multiple outliers were addressed by Knight et al. (2010).
There are two types of reliability measures: internal and external. Both of them are important diagnostic tools for inferring the strength of the model validation (cf. TEUNISSEN 1985, VERHAGEN 2002, LEICK 2004). By using the first-order approximation, Guo et al. (2011) investigated the variation characteristics of minimal detectable bias (MDB) and the bias-to-noise ratio (BNR) measures for an iterative robust M-estimator. This contribution serves a twofold purpose: (1) to evaluate the impact of iterative reweighting on the quality indicators by using an exact analytical method, and (2) to assess the adequacy of the first order approximation method.
2. ITERATIVELY REWEIGHTED LEAST-SQUARES (IRLS) Consider the linear model (KOCH 1999)
( )
E
=
AX
L
(1)where
A
is then u
×
design matrix with full column rank,X
theu
×
1
vector of unknowns, andL
then
×
1
vector of independent and normally distributed observations with null mean vector and covariance matrix2 1 2
0 0
diag
(1
p
i)
σ
P
−=
σ
.merely deleted. Therefore, the IRLS algorithm is robust and the efficiency can be retained (HUBER 1981, CHANG and GUO 2005, HUBER and RONCHETTI 2009).
By choosing the a-priori weight matrix
P
as the initial weight matrixP
(0), the IRLS scheme can be performed. Denoting the updated weight matrix with thek
-th iteration by ( )k
(
( )k)
idiag p
=
P
, the estimate of unknowns is given by( )k
=
( )k T ( )kX
S
A P
L
(2)with
S
( )k=
(
A P
T ( )kA
)
−1.The corresponding residual vector is readily obtained as
( )k
= −
( )k=
( )kV
L
AX
R
L
(3)where ( )k
= −
( )k T ( )kR
I
AS
A P
is the reliability matrix or residual matrix (SCHAFFRIN 1997, GUO et al. 2007, 2011). It can be seen that ( )kR
is idempotent and thus, the sum of its diagonal elements ( )kii
r
is equal to the degree of freedomn
−
u
. For uncorrelated observations, ( )k iir
is called redundancy number and it holds that (SCHAFFRIN 1997, LEICK 2004)( )
0
k1
ii
r
≤
≤
(i
=
1
,
2
,
L
,
n
) (4)3. VARIATION OF PRECISION AND DILUTION OF PRECISION METRICS
Without loss of generality, suppose the
i
1-th, thei
2-th,K
, and them
i
-th observations be them
(
< − −
n u
1)
observations with reduced weights at thek
-th step of -the iteration. LetD
m be anm m
×
diagonal matrix whose diagonal entries are given by( 1) ( )
j j
k k
j i i
d
=
p
−−
p
,j
=
1,2, ,
K
m
(5)then we have
( )k (k 1) T m m m
−
=
−
P
P
H D H
(6) with1 2
( ,
,
,
)
m
m
=
i i iwhere
h
i represents thei
-thn
×
1
canonical unit vector with 1 in thei
-th entry and zeros elsewhere. With the definition, it can be seen that the diagonal matrixD
m is positive-definite.With Sherman-Morrison-Woodbury-Schur formula (STRANG and BORRE 1997) and denoting T
m
=
mA
H A
, we have( ) ( 1) 1
( 1) ( 1) 1 ( 1) 1 ( 1)
( 1) ( 1) ( 1)
(
)
(
)
k T k T
m m m
k k T k T k
m m m m m
k k T k
m m m
− − − − − − − − − − −
=
−
=
+
−
=
+
S
A P
A
A D A
S
S
A
D
A S
A
A S
S
S
A B A S
(7)
where
1 ( 1) 1
( 1) 1
( )
(
)
(
)
k T
m m m m
T k T T
m m m m m m m m
k T
m m m m m
− − −
− −
=
−
=
+
−
=
+
B
D
A S
A
D
D A
A P
A
A D A
A D
D
D A S
A D
(8)
Obviously,
B
m is symmetric and positive-definite, since bothD
m andS
( )k are symmetric and positive-definite.The expression Eq. (7) shows the apparent decrease in precision when the downweighting procedure is performed. Moreover, all kinds of dilution of precision (DOP) metrics (STRANG and BORRE 1997) will become worse, but more realistic since
[
( )k]
[
(k 1)]
ii ii
−
≥
S
S
(i
=
1, 2, ,
L
n
).4. VARIATION OF MDB MEASURES
In reliability theory, MDB measures are used to describe the size of model errors that can be detected by simply using the appropriate test statistics (BAARDA 1968, TEUNISSEN 1985, VERHAGEN 2002, LEICK 2004). With Eq. (8), it can be verified that
1 ( 1)
(
k T)
m m m m m m
− −
⋅
−
⋅
=
B
D
A S
A
D
D
(9)which multiplies out to give
(k 1) T
m m m m m m
−
=
+
B
D
B A S
A D
(10) and(k 1) T
m m m m m m
−
=
+
B
D
D A S
A B
. (11)( ) ( 1) ( 1) ( 1)
( 1) ( 1)
( 1)
[
]
(
)
k T T k k T k T T
m m m m m m m m m
k T k T T
m m m m m m m
k T T
m m m
− − − − − −
⋅
=
+
=
+
=
AS
A
H D H
A S
S
A B A S
A D H
AS
A
D
B A S
A D
H
AS
A B H
(12)
and
( ) ( ) ( 1) ( )
( 1) ( 1) ( 1) ( 1) ( 1)
( 1) ( 1) ( 1)
k k T k k T T
m m m
k k T k T k k T T
m m m m m m
k k T T k
m m m
− − − − − − − − −
= −
⋅
+
⋅
=
−
+
=
+
⋅
R
I
AS
A
P
AS
A
H D H
R
AS
A B A S
A P
AS
A B H
R
AS
A B H
R
(13)
Taking Eq. (11) into account, one can obtain
( ) ( 1) ( 1) ( 1)
( 1) ( 1)
( 1)
(
)
T k T k T k T T k
m m m m m m m m m m m m
k T T k
m m m m m m m
T k m m m
− − − − − −
⋅
=
⋅
+
⋅
=
+
=
H D H
R
H D H
R
H D H
AS
A B H R
H
D
D A S
A B
H R
H B H R
(14)
which, in combination with Eq. (13) yields
( ) ( ) ( 1) ( )
( 1) ( 1) ( 1) ( 1) ( 1) ( 1)
( 1) ( 1) ( 1) ( 1)
(
)
(
)
k k k T k
m m m
k k k k T T k T k
m m m m m m
k k k T T k
m m m
− − − − − − − − − − −
=
−
⋅
=
⋅
+
⋅
−
=
−
P
R
P
H D H
R
P
R
P
AS
A B H R
H B H R
P
R
R
H B H R
(15)
This exact closed-form expression gives the relationship between ( )k ( )k
P
R
and (k−1) (k−1)P
R
.With noncentrality parameter
λ
0 (ibid), it follows from Eq. (15) that0 0
0
(
(k 1) (k 1))
0(
( )k ( )k)
ii ii
λ
λ
σ
− −≤
σ
P
R
P
R
, (i
1
,
2
,
,
n
L
=
,k
=
1,2, .
L
) (16)It can be seen that, all the MDB measures become larger and larger after performing the iterative reweighting procedure. These results coincide with those obtained using the first-order approximation method (GUO et al. 2011).
5. VARIATION OF BNR MEASURES
relevant than internal reliability (BAARDA 1968, TEUNISSEN 1985, VERHAGEN 2002, LEICK 2004).
The bias-to-noise ratio (BNR) measure is one of two scalar external reliability measures. Under the diagonality assumption of the weight matrix, the
i
-th BNR measure with thek
-th iteration is defined as (BAARDA 1968, TEUNISSEN 1985,VERHAGEN 2002, LEICK 2004)
( ) 0
BNR
(1
k1)
i
=
λ
r
ii−
(17)Suppose the relationship between the weight elements ( )k i
p
and (k 1) ip
− is as follows( )k (k 1)
i i i
p
=
f p
− (18)in which the factor
f
i (0
< ≤
f
i1
) is the function of thei
-th (standardized) residual obtained in the(
k
−
1)
th-iteration. Determination off
i is termed as downweighting strategy, which has attracted a great deal of attention both in statistical and geodetic literature (HUBER 1981, CHANG and GUO 2005, HUBER and RONCHETTI 2009, GUO et al. 2010, 2011).With Eq. (16), if ( )k (k 1)
i i
p
=
p
− , then( )k (k 1) ii ii
r
≤
r
− (19)For the subsequent discussions we introduce the following theorem:
Theorem: Assume that both
M
andN
aren n
×
symmetric positive definite matrices, thenM
−
N
is positive semi-definite if and only ifN
−1−
M
−1 is positive semi-definite.For the proof of this theorem, the reader is referred to Horn and Johnson (1985, p 471).
In case of j
min
i if
=
f
, then[
f
jS
( ) 1k] [
−−
S
( 1) 1k− −]
=
A
Tdiag f
((
i−
f p
j)
i( 1)k−)
A
f
jis positive semi-definite. According to the above theorem, one can conclude that
(k 1) ( )k j
f
−−
S
S
is also positive semi-definite and thus( ) ( 1) ( ) ( ) ( 1) ( 1)
( 1) ( ) ( 1)
[1
] [1
]
(
)
0
k k T k T k T k T k
jj jj j j j j
T k k T k
j j j j
r
r
f
p
− − −
− −
−
= −
− −
=
−
⋅
≥
h AS
A P
h
h AS
A P
h
However, if
min
i j1
i
f
<
f
<
, the sign of the expression( )k (k 1) jj jj
r
−
r
− is ambiguous.Therefore, at any two consecutive iteration steps, (1) the BNR measures of observations whose weights keep unchanged become larger; (2) the BNR measure of the observation with maximum absolute standardized residual decreases, whereas the BNR measures of other observations with reduced weights may become larger or smaller. These results also coincide with those obtained by the first order approximation method (GUO et al. 2011).
6. A NUMERICAL EXAMPLE
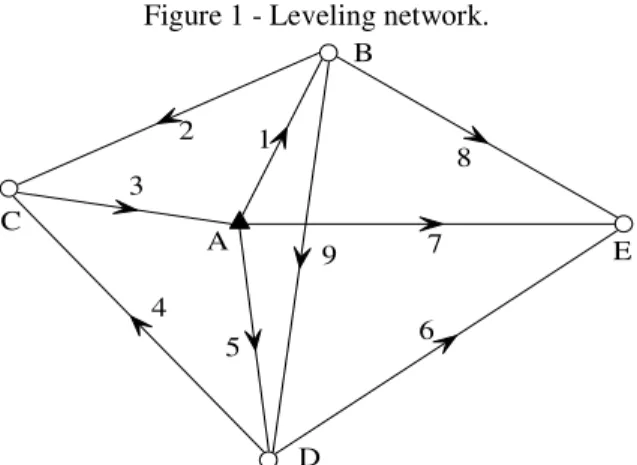
A simulated geodetic leveling network as shown in Figure 1 was taken as a test example. The elevation of station A is 168.0000 m. The simulated observations and their weights are listed in Table 1.
Figure 1 - Leveling network.
D B
A
4
6 3
5 1 2
C
8
7 E
9
Table 1 -. Simulated leveling network. Line Leveling difference (m) Relative weight
1 5.7886 1
2 -14.4582 2
3 8.6681 2
4 -12.3387 1
5 3.6702 2
6 -14.3008 1
7 10.6318 2
8 -16.4200 1
For purpose of illustration, two artificial outliers,
−
0.08
and+
0.06
(m) are added to the third and the ninth observation, respectively. The damping factors can be determined as follows (GUO et al. 2011)2
1,
(
) ,
i i
i i
v
c
f
c v
v
c
≤
=
>
%
%
%
, (i
1
,
2
,
,
n
L
=
) (21)where
v
%
i is thei
th standardized LS residual and the constantc
is usually taken from the interval[
1
.
5
,
2
.
0
]
(KOCH 1999, CHANG and GUO 2005). If the difference between the estimated unknowns at two consecutive iterations is less than a positive constant, or the number of iterations surpasses a preset threshold number, then the iteration process should be stopped.The median absolute deviation (MAD) estimate is the candidate for being the “most robust estimate of scale” (HUBER 1981). However, in order to make MAD consistent at the normal distribution, we must multiply it by 1.4826. Therefore, the scale factor involved in
v
%
i can be replaced by its normalized MAD estimate (ROUSSEEUW and LEROY 1987; GUO et al. 2010, 2011).In geodetic applications (BAARDA 1968), the significance level and the detection power are commonly set at 0.001 and 0.80, respectively. This results in a noncentrality parameter
λ
0=
4.13
. The parameterσ
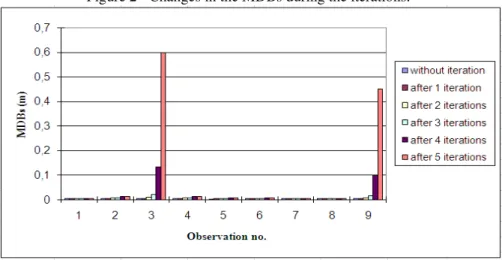
0 used in the MDB and BNR measures is taken as 0.001 m. The aforementioned convergence criterion meets after five iterations. As expected, all the MDB measures become larger and larger during the iteration procedure (cf. Figure 2).When the stopping criterion meets, the BNR measures corresponding to the two outlying observations are considerably small (see Figure 3).
Figure 3 - Variation of the BNRs over the five iterations.
These results can be used to explain how the IRLS technique resists the presence of outliers and mitigate their impact on the final estimated parameter.
7. CONCLUSIONS
The IRLS technique has been extensively employed in geodetic and geophysical literature. To gain insight into the IRLS method, an exact and direct analytical method is presented to obtain insights on how much the iterative reweighting can impair the quality indicators. Theoretical analyses and numerical results show that, when the downweighting procedure is performed, (1) the precision, all kinds of DOP metrics and MDB measures will become larger; (2) the variations of BNR measures are ambiguous, and (3) all these results coincide with those obtained by the first-order approximation method (GUO et al. 2011).
ACKNOWLEDGEMENTS
This research was sponsored by National Key Basic Research Program of China (2012CB825604), and the Natural Science Foundation of China (Grant Nos. 41374041 and 40874007). The author is also supported by the China Scholarship Council (File No. 2011317045).
REFERENCES
CHANG X.; GUO Y. Huber’s M-estimation in relative GPS positioning: computational aspects. Journal of Geodesy, 79(6-7): 351-362, 2005.
COLLILIEUX X.; VAN DAM T.; RAY J.; COULOT D.; MÉTIVIER L.; ALTAMIMI Z. Strategies to mitigate aliasing of loading signals while estimating GPS frame parameters. Journal of Geodesy, 86(1): 1-14, 2012.
GUO J. The case-deletion and mean-shift outlier models: equivalence and beyond.
Acta Geod. Geophys., 48(2): 191-197, 2013.
GUO J.; OU J.; WANG H. Quasi-accurate detection of outliers for correlated observations. Journal of Surveying Engineering, 133(3): 129-133, 2007.
GUO J.; OU J.; WANG H. Robust estimation for correlated observations: two local sensitivity-based downweighting strategies. Journal of Geodesy, 84(4): 243-250, 2010.
GUO J.; OU J.; YUAN Y. Reliability analysis for a robust M-estimator. Journal of Surveying Engineering, 137(1): 9-13, 2011.
HORN R. A.; JOHNSON C. R. Matrix Analysis. Cambridge Univ. Press, Cambridge, UK, 1985.
HUBER P. J. Robust statistics, Wiley, New York, 1981.
HUBER P. J.; RONCHETTI E. M. Robust statistics, 2nd Ed., Wiley, New York, 2009.
KNIGHT N. L.; WANG J.; RIZOS C. Generalised measures of reliability for multiple outliers. Journal of Geodesy, 84(10): 625-635, 2010.
KOCH K. R. Parameter estimation and hypothesis testing in linear models, 2nd Ed., Springer, Berlin, 1999.
LEICK A. GPS satellite surveying. 3rd Ed., Wiley, New York, 2004.
OU J. On the reliability for the situation of correlated observations. Acta Geodaet. et Cartograph. Sinica, English Edition, 9-17, 1999.
RANGELOVA E.; FOTOPOULOS G.; SIDERIS M. G. On the use of iterative re-weighting least-squares outlier detection for empirically modelling rates of vertical displacement. Journal of Geodesy, 83(6): 523-535, 2009.
ROUSSEEUW P. J.; LEROY A. M. Robust regression and outlier detection. Wiley, New York, 1987.
SCHAFFRIN B. Reliability measures for correlated observations. Journal of Surveying Engineering, 123(3): 126-137, 1997.
STRANG G.; BORRE K. Linear algebra, geodesy, and GPS. Wellesley-Cambridge Press, Wellesley, 1997.
TEUNISSEN P. J. G. Quality control in geodetic networks. In: Optimization and design of geodetic networks, E. W. Grafarend and F. Sanso, eds., Springer, Berlin, 526-547, 1985.
VERHAGEN S. Studying the performance of Global Navigation Satellite Systems: A new software tool. GPS World, 13(6): 60-65, 2002.
WANG J.; CHEN Y. On the reliability measure of observations. Acta Geodaet. et Cartograph. Sinica, English Edition, 42-51, 1994.