Nota Técnica
*e-mail: [email protected]
COMPARISON OF USEPA 3050B AND ISO 14869-1:2001 DIGESTION METHODS FOR SEDIMENT ANALYSIS BY USING FAAS AND ICP-OES QUANTIFICATION TECHNIQUES
Elvira Maria Galí Navarro
Centro de Investigación y Desarrollo Técnico, El Trigal, Boyeros, CP 8011, La Habana, Cuba Margarita Edelia Villanueva Tagle
Departamento de Química General, Facultad de Química, Universidad de la Habana, CP 10400, La Habana, Cuba Maria Teresa Larrea Marín
Centro Nacional de Investigaciones Metalúrgicas, 28040 Madrid, España Mario Simeón Pomares Alfonso*
Instituto de Ciencia y Tecnología de Materiales, Universidad de La Habana, CP 10400, La Habana, Cuba
Recebido em 19/7/10; aceito em 25/2/11; publicado na web em 5/5/11
A study of the partial USEPA 3050B and total ISO 14869-1:2001 digestion methods of sediments was performed. USEPA 3050B was recommended as the simpler method with less operational risk. However, the extraction ability of the method should be taken in account for the best environmental interpretation of the results. FAAS was used to quantify metal concentrations in sediment solutions. The alternative use of ICP-OES quantiication should be conditioned by a previous detailed investigation and eventual correction of the matrix effect. For the irst time, the EID method was employed for the detection and correction of the matrix effect in sediment ICP-OES analysis. Finally, some considerations were made about the level of metal contamination in the area under study. Keywords: sediment digestion methods; ICP–OES and FAAS; matrix effect.
INTRODUCTION
A notable deterioration of the environmental quality of the Havana Bay ecosystem has been observed because of the presence of both organic and inorganic contaminants.1 The high concentrations of Cu, Ni, Pb and Zn in sediments have conirmed the urban and industrial character of the pollution.2, 3
Sediments are ones of the most useful samples for metal con-tamination assessment.4 Both of the techniques, Flame Atomic Absorption Spectrometry (FAAS) and Inductively Coupled Plasma Optical Emission Spectrometry (ICP-OES), are the most employed for the determination of metals in sediments and both techniques require the extraction of metals into solution. USEPA 3050B method is an internationally recognized guideline norm to digest sediments.5 Samples are not always put into solution entirely because the rea-gents used may not dissolve some of sediment fractions. Apparent contradictions and scarce information concerning the amount of the metal fraction extracted, emerged from the literature. For example, Burton et al. assumed, with poor evidences, that the whole content of Cu, Pb and Zn was taken out.6 However, Sastre et al.7 reported that just a part of Zn was extracted; while Cd, Cu and Pb were totally removed from the sediment. In another report, it was showed that the extraction of metals varied in the increasing order: Se (3.4%), Ni (21.1%), Cr (30.3%) and As (70%).8 In other authors, for example Cobb GP et al.,9 no considerations have been made as to the amount of metal extracted.
It is important to know the amount of metal extracted by the digestion method as part of the characterization of the complete analytical procedure (digestion method + quantiication technique). In this way, a more complete environmental interpretation of the inal
analytical results can be achieved. The extraction ability of USEPA 3050B method is deined by the working conditions selected by the analyst, within the diapason of possibilities given.5 For instance, the total amount of HNO3 and H2O2 added. Moreover, even if the operational conditions were ixed then, the metal fraction extracted could depend on the element and sediment composition as well. In contrast, the ISO 14869-1:2001 digestion method employed a more aggressive combination of acids (HNO3/HF/HClO4) in order to achieve a complete digestion of all phases of the sediment. Thus, once the performance parameters of this method are established, the total content of metals determined can be used as reference value to evaluate the extraction capacity of the partial USEPA method.
On the other hand, ICP-OES has been selected in many labora-tories, when many samples have to be analyzed, as usually occurs during environmental studies. Nevertheless, special attention should be addressed to ICP-OES non-spectral interferences, which are cons-tituted by agroup of phenomena related to the sample introduction system and transport of sample to the plasma; the excitation mechanis-ms of atomechanis-ms and ions in the plasma. This kind of interferences should be reduced or corrected, if they are present. Otherwise, the accuracy of analysis can be notably affected.10 Accuracy is one of the principal performance parameters to be evaluated during the implementation of an analytical procedure and it is an essential requirement for the quality control of measurements in environmental chemistry.
Accuracy is frequently evaluated with a Certiied Reference Material (CRM). However, few CRMs have been elaborated for extractable fraction of metals as, for example, the sediment reference material No. 601.11 No CRM exists for extractable fraction of metals by using USEPA 3050B method. Therefore, the accuracy of the entire analytical procedure (USEPA 3050B + ICP-OES) must be assessed without CRMs.
kno-wn, special attention should be paid to the detection and correction for non-spectral interferences of the technique employed to quantify. Different methods have been proposed for this purpose.12-15 In parti-cular, the Extrapolation to Ininite Dilution (EID) method was tested with good results in the ICP-OES and FAAS analysis of synthetic solutions, which simulated digested plants.12 More recently, it was applied to the determination of impurities in ceramic materials.15 The EID method has not been tested so far for detection and correction of interferences in sediments ICP-OES analysis.
Therefore, the principal goal of the present work was to compare the partial USEPA 3050B and the total ISO 14869-1:2001digestion methods for Co, Cu, Ni, Pb and Zn in sediments from Atares inlet (Havana Bay). The second goal was to apply the EID method for the detection and correction for non-spectral interferences of the sediment ICP-OES analysis. Finally, some considerations were made about the actual level of metal contamination of sediments under study. EXPERIMENTAL
Sampling sites and sample preparation
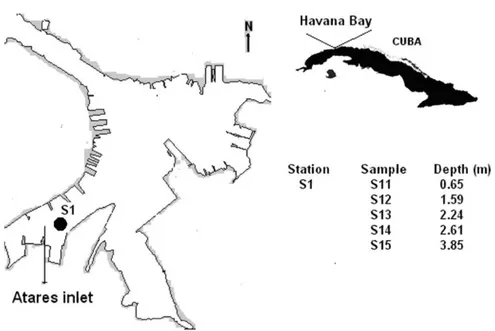
Sampling site (Figure 1S) was located at the Atares inlet, the more deteriorated zone of the Havana Bay. Five samples, S11, S12, S13, S14 and S15, were taken with a gravity dredge at Station S1 at depths of 0.65, 1.59, 2.24, 2.61 and 3.85 m, respectively. Sediments were carefully screened for determining the presence of animals and detritus, put in polyethylene containers and stored at ~4 oC. Before analysis, samples were lyophilized, homogenized and sieved with a plastic sieve to select the sediment fraction with particle diameter less than 63 µm. As known, metals are concentrated in this sediment fraction, which has been regularly used in previous studies of the Havana Bay. Thus, the present results can be fully compared with those previously obtained. Test portions of the selected fraction were digested as follow below, according to USEPA 3050B5 and ISO 14869-1:200116 guidelines.
USEPA 3050B method
Approximately 1 g sample were accurately weighed in a 250 mL Pyrex Erlenmeyer lask and 10 mL of 8.5 M HNO3 were added. The solution was heated on a hot plate to ~95 oC without boiling and this temperature was maintained for 15 min. After cooling to less than 70 oC, 5 mL of 17 M HNO
3 were added and the sample was reluxed for 30 min at ~95 oC without boiling. This step was repeated a sec-ond time. Thereafter, the sample was evaporated to ~5 mL without boiling. After cooling to less than 70 oC, 2 mL of water were added followed by the slow addition of 3 mL of 8.8 M H2O2. The solution was then heated until effervescence subsided. Later, 8 mL more of 8.8 M H2O2 in 1-mL aliquots were added and solution reluxed. After cooling to less than 70 oC, 10 mL of 12 M HCl were added and the sample was reluxed for 15 min. without boiling. After cooling to room temperature, the sample was iltered and diluted to 100 mL with double distilled water.
ISO 14869-1:2001 method
Approximately 0.250 g sample were accurately weighed in a 250 mL polytetraluoroethylene Erlenmeyer lask and 5 mL of 8.5 M HNO3 were added. The solution was heated on a hot plate without boiling until the volume was reduced to 1 mL and then sample was cooled. This step was repeated two more times until a total amount of 15 mL of 8.5 M HNO3 was added. After cooling, 5 mL of HF and 1.5 mL of HClO4 were added and the sample was reluxed. A second portion of 5 mL of HF and 1.5 mL of HClO4 were added one more time and the sample was keep overnight at room temperature, after
which, the volume was reduced again up to 1mL by reluxing. After cooling, 5 mL of double distilled water plus 2 mL HCl conc. were added with a light heating to dissolve the residue. After cooling to room temperature, the sample was iltered and diluted to 50 mL with double distilled water.
A blank sample was prepared for each sample digestion bath. Instrumentation
Concentration of elements was quantiied in sediment solution by using two different instrumental systems:
1. Pye Unicam 9100 (Philips, Holland) atomic absorption spec-trometer with stoichiometric acetylene/air (1.5 L min-1/5.0 L min-1) lame and slit width of 0.2 nm was used. The measured absorption lines were Cu 324.8 nm, Co 240.7 nm, Ni 232.0 nm, Pb 217.0 nm and Zn 213.9 nm. For all the analytes, the compromise observation height was set at 10 mm. The intensity of the current was 4, 15, 12, 12 and 8 mA for Cu, Co, Ni, Pb and Zn lamp, respectively.
2. ICP-OES sequential spectrolame spectrometer (Spectro, Germany) with radial view mode, semi demountable torch, cross-low nebulizer, Scott type spray chamber and generator frequency of 27 MHz, was employed. Analysis was performed by using the compromise operational parameters recommended by the manufac-turer to obtain better detection limits. These ixed parameters were incident power of 1.2 kW; plasma, nebulizer and auxiliary argon low rates of 20, 1.0 and 1 L.min-1, respectively, and observation plasma height of 15 mm above the induction coil. The measured emission lines were Al(I) 167.080 nm, As(I) 188.979 nm, Ca(II) 317.933 nm, Co(II) 228.6 nm, Cr(I) 267.716 nm, Cu(I) 324.8 nm, Fe(II) 259.940 nm, K(I) 766.480 nm, Mn(II) 257.61 nm, Na(I) 558.995 nm, Ni(II) 231.604 nm, Pb(II) 220.4 nm, Ti(II) 334.941 nm, Zn(I) 213.9 nm and V(II) 309.311nm.
Reagents and reference solutions
Calibration solutions were prepared by dilution of 1000 mg L-1 (Spectrosol, BDH, England) unielemental standards solutions. For FAAS analysis, calibration solutions of each analyte were 10% (v/v) in 37% HCl ac. (Merck, Germany); while multielemental calibration solutions were 1% (v/v) in the same acid for ICP-OES analysis. Double distilled water (Aquatron A4D, J. Vivi Science Products Limited, Germany) was used for all preparations of the solutions. Calibration solutions were checked by analyzing a traceable to NIST Quality Certiied Standard QCS-19, under both experimental con-ditions selected for FAAS and ICP-OES analysis. For all elements of interest, the measured concentration was in the ± 5% range of certiied concentration.
Evaluation of performance parameters
Performance parameters were assessed according to Eurachem guidelines.17 Detection limit, quantiication limit, precision and accuracy were calculated for both the employed digestion methods USEPA 3050B and ISO 14869-1:2001 by using FAAS as quantii-cation technique.
Precision was evaluated as relative standard deviation of the average concentration of 4 digestion replicates of samples S12, S14 collected at 1.59 and 2.61 of depth, respectively, and of a mix of samples S13 + S15, all taken as examples, according to the available amount of sediments collected. The last mentioned mix of samples will be further called sample M in this work.
The known amount of analyte was spiked before the digestion of the sample, as recommended in the used guidelines, 7 and after digestion of the sample in two parallel experiments for purposes of compari-son. Additionally, accuracy of the ISO method was also checked for Pb and Ni by comparison with certiied concentrations in sediment CRM IAEA-405.
Extraction ability of the USEPA 3050B method was calculated for each element as the quotient, in percent, of the extracted concentration respect to the total concentration of element in sample.
For USEPA 3050B digestion method with ICP-OES detection technique, precision was evaluated for four digestion replicates of the CRM PACS-1. PACS-1 is sea sediment collected in the Esquimalt harbor, BC, by Dobrocky Seatech Ltd., Sidney, BC. It was prepared under the Canadian National Research Council, Division of Chemis-try, Marine Analytical Chemistry Program, 1990.18 Two analysts made digestion replicates: 2 replicates, each one, at different days. Each digestion solution was measured twice. Concentration was measured directly in the digestion solution, except for major elements Al, Ca, Fe, Na and Ti. The high concentrations of those major elements produced too high signals, which saturated the detector. Consequently, CRM PACS-1 digestion solution was diluted 15.6 times for Al and 2.5 times for the rest of major elements. Precision was also evaluated with three digestion replicates of sediment S11. In this case, the concentration was measured directly in the digestion solution, except for major elements, which were measured in the 2.5 diluted digestion solution. Accuracy of analysis of the USEPA 3050B digestion method with ICP-OES detection technique was evaluated by comparing the measured concentration with the known certiied concentration in the CRM PACS-1 digestion solution. Accuracy was also revaluated in sediment S11 by using the EID method.
Extrapolation to ininite dilution method
This method is based on the known fact that successive dilutions of the sediment solution lead to the decrease of concentrations of all the elements present in the solution including, of course, the major elements. Therefore, reduction and even total elimination of any in-terference can be reached when the concentration of major elements has been lowered enough, by means of the successive dilutions.
Thus, the apparent concentration (Capi) of element to be deter-mined in the i-dilution is calculated by the following equation: Capi = Ci x DFi; where Ci is the concentration of analyte measured in the i-solution and DFi the corresponding dilution factor. The real con-centration of analyte, without any interference, is the intercept of the function itted to the Capi vs 1/DFi relationship for n dilutions. The existence of a linear relationship19 between Cap
i (y) and 1/DFi (x) was established previously by means of the statistical signiicance of the correlation coeficient R through the t-student test for n -2 degrees of freedom and conidence level (α) of 0.05.
In the present study, two test portions (~ 2 g) of CRM PACS-1 and S11 sediment were digested by USEPA 3050B method. The ex-traction solutions were successively diluted by 2.5, 6.25, 16, 39 and
98 times in 1% (v/v) 68-71% HNO3. All the solutions were measured by ICP-OES under the operational conditions previously described. Average apparent concentration (Capi) of the two replicates for each dilution was calculated.
RESULTS AND DISCUSSION
Study of ISO 14869-1:2001 and USEPA 3050B digestion methods with FAAS detection
Quantiication and detection limits (Table 1) did not differ sig-niicantly for both the digestion methods under consideration. The order of magnitude was the same, except for the detection limit of Zn, which was ~ 10 times higher by USEPA 3050B (36 mg kg-1) than the detection limit obtained by ISO 14869-1:2001 method (3 mg kg-1). This difference could be caused by some non-controlled contamina-tion, occurring throughout the experiment carried out with USEPA 3050B, for example, some amount of Zn from the atmospheric dust of the laboratory environment.
Precision (Table 2) varied with the element between 2-11% and 1-12% for USEPA 3050B and ISO methods, respectively.
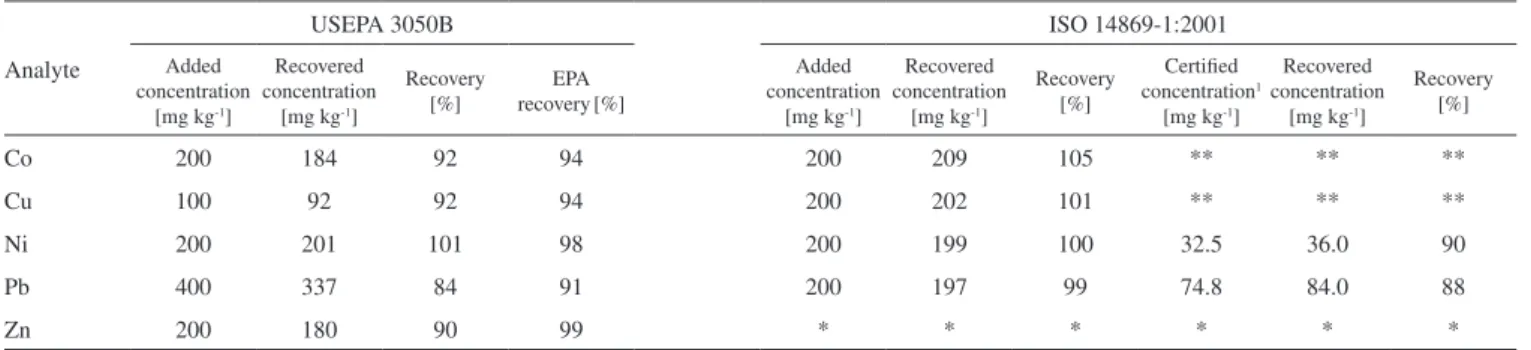
Recovery study of USEPA 3050B and ISO 14869-1:2001 methods with FAAS detection is showed in Table 3. Recovery was between ~90 and 105% for all the analytes and both studied digestion methods, except for Pb (84%) extracted by USEPA 3050B. The lower recovery of Pb can be associated only with the digestion method and not with the instrumental quantiication technique, because the recovery incre-ased (107%), when Pb was added into the sediment solution after the digestion step. To conirm this particular behavior of Pb, the recovery study was also carried out on samples S12 and S14 by spiking a known concentration of Pb before and after digestion of the samples. The recoveries were 81 and 79% before, and 109 and 107% after digestion of samples S12 and S14, respectively. Furthermore, it should be noted that, the recovery obtained for USEPA 3050B method, when elements were spiked before digestion, coincided with the recovery reported inUSEPA 3050B guidelines,5 except for Pb. Without doubt, the low recovery of Pb was associated with the digestion method and it can be explained by some loss of Pb by volatilization during digestion of the sample or by a strong linking of some amount of Pb to a non-dissolved fraction of sediment. A inal elucidation of this result is out the objectives of this study.
Extraction ability of USEPA 3050B is showed in Table 2. For all the studied samples, Ni and Cu were wholly extracted (92-100%) wi-thin the limits of experimental error. In contrast, the extracted amount of Zn was ~ 80% for all samples, the extraction of Pb depended on sample (from 81 to 85% for samples S12 and S14, respectively up to 100% for sample M); and, inally, low extraction (60-70%) of Co was observed in S12 and S14 samples.
As can be expected, the amount of metal extracted by USEPA 3050B method depended on the sample and the metal determined. A full explanation of this behavior is beyond the scope of the present work. However, the reason of the low extraction (60-70%) of Co
Table 1. Detection and quantiication limits of USEPA 3050B and ISO 14869-1:2001 methods with FAAS detection
Analyte USEPA 3050B ISO 14869-1:2001
Detection limit [mg kg-1] Quantiication limit [mg kg-1] Detection limit [mg kg-1] Quantiication limit m [mg kg-1]
Co 5 20 8 34
Cu 1 6 2 12
Ni 10 35 8 32
Pb 3 39 2 58
could be surely associated with the increment of the analysis error when the measured concentrations, 23.9 and 27.9 mg kg-1 for S12 and S14, respectively (Table 2), are close to the quantiication limit, 20 mg kg-1, of the method (Table 1). Therefore, the Co concentra-tions determined in those samples should be considered only as an approximate result.
According to our results, the selection of one of the two digestion methods studied should be carefully dictated by the inal purposes of the analysis. The ISO 14869-1:2001 method is useful for the deter-mination of the total content of Cu, Ni, Pb and Zn in the sediments under study. However, the use of the EPA 3050B method should be considered because of its simplicity and lower risk. The ISO 14869-1:2001 method employs the most dangerous HF and HClO4acids. On the other hand, the low extraction ability (~80%) of EPA 3050B method for Pb and Zn from some sediment should be considered non-important, when the purpose of the analysis is to determine the bioavailability of the element in natural environmental conditions. It is highly probable that the amount of Pb and Zn not extracted by the relatively strong action of the HNO3 and H2O2 oxidant agents used by the EPA 3050B method will not be easily removed by any natural events. Thus, the non-extracted fraction will not be liberated to the ecosystem. Taking into account this last consideration, the USEPA 3050B method was further used in this work.
Quantiication of metal sediments by ICP-OES
Taking advantage of the multielemental character of the ICP-OES technique, major (Al, Ca, Fe, K, Na, Ti) and minor (As, Cr, Mn, V) elements were also included in this study together with Co, Cu, Ni, Pb and Zn, previously quantiied by FAAS. CRM PACS-1 and sediment S11 samples were digested by USEPA 3050B method and elements were quantiied directly on solution digestion by ICP-OES.
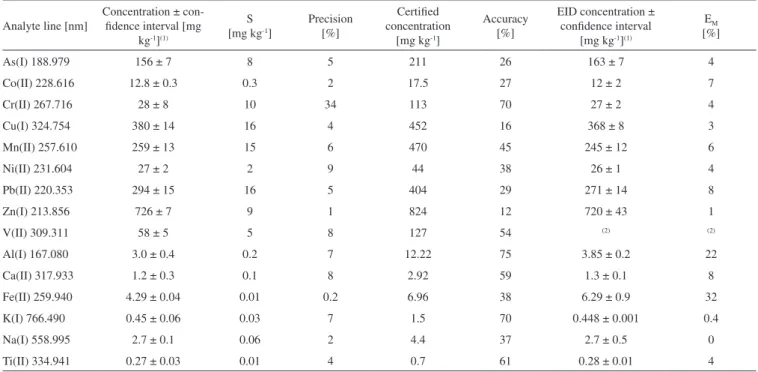
Precision and accuracy of ICP-OES analysis are shown in Tables 4 and 5. Precision was close to or below 10% for all the analytes in both the CRM PACS-1 (Table 4) and sediment S11 (Table 5), except for Cr (34%) in CRM PACS-1. This exception could be caused by a non-reproducible extraction of Cr. Accuracy of ICP-OES analysis evaluated with CRM PACS-1 (Table 4) varied from 12% for Zn up 75% for Al. In general, the low measured concentration respect to the certiied one can be associated with one or both of the two steps of the analytical procedure: a poor extraction ability of analytes by the USEPA 3050B method and/or the presence of some non-spectral interference during the instrumental measurement. It should be noted that the sediment solution could contain signiicant amounts of major elements (matrix) of the sediment, which are put in solution together with the analytes of interest.
Table 2. Extraction ability of USEPA 3050B method and precision of analysis by using USEPA 3050B and ISO 14869-1:2001 methods in combination with
FAAS detection
Sample Analyte USEPA 3050B ISO 14869-1:2001 EPA extraction ability [%]
Concentration [mg kg-1] Precision [%] Concentration [mg kg-1] Precision [%]
S12 Co 23.9 3 40 5 60
Cu 122 8 127 1 96
Ni 50 11 53 4 94
Pb 141 3 166 3 85
Zn 204 5 319 3 64
S14 Co 27.9 3 40 5 70
Cu 97 3 102 1 95
Ni 51 9 53 7 96
Pb 96 3 118 8 81
Zn 153 2 183 5 84
M Co 20 8 21 12 95
Cu 76 6 83 5 92
Ni 17 10 17 8 100
Pb 57 9 55 8 104
Zn 118 7 147 9 80
Table 3. Recovery study of USEPA 3050B and ISO 14869-1:2001 methods with FAAS detection
Analyte
USEPA 3050B ISO 14869-1:2001
Added concentration
[mg kg-1]
Recovered concentration
[mg kg-1]
Recovery [%]
EPA
recovery[%]
Added concentration
[mg kg-1]
Recovered concentration
[mg kg-1]
Recovery [%]
Certiied
concentration1
[mg kg-1]
Recovered concentration
[mg kg-1]
Recovery [%]
Co 200 184 92 94 200 209 105 ** ** **
Cu 100 92 92 94 200 202 101 ** ** **
Ni 200 201 101 98 200 199 100 32.5 36.0 90
Pb 400 337 84 91 200 197 99 74.8 84.0 88
Zn 200 180 90 99 * * * * * *
Application of the extrapolation to ininite dilution method
Evaluation of the matrix interferences in the ICP-OES analysis of sediments
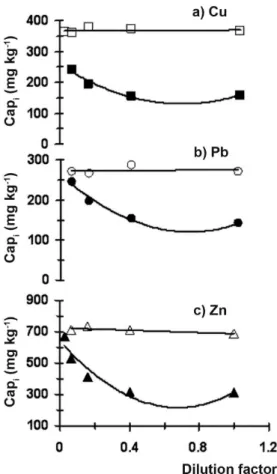
Successive dilutions of the original CRM PACS-1 and S11 solutions were made according to the description given in Section 3.2. Apparent concentration (Capi) of most analytes determined in CRM PACS-1 was invariable within the experimental error for all the dilutions tested. As example, the variation of Cu, Pb and Zn apparent concentrations for CRM PACS-1 are described by empty symbols
linked with a continuous line in Figure 1. This result indicated the absence of matrix effect in the ICP-OES analysis of CRM PACS-1 digestion solution.
In contrast, apparent concentration of most analytes measured in sediment S11 solution noticeably increased with the increment of the dilution factor. As example, Cu, Pb and Zn are shown in Figure 1 by illed symbols linked with a continuous line. Undoubtedly, the intensity of lines decreases in presence of the matrix for sediment S11.
The absence of matrix inluence in the ICP-OES analysis of CRM PACS-1 and the presence of it in sediment S11 was very probably
Table 4. Performance parameters of the USEPA 3050B + ICP-OES method estimated on sediment CRM PACS-1 and results of EID method application
Analyte line [nm]
Concentration ± con-idence interval [mg
kg-1](1)
S [mg kg-1]
Precision [%]
Certiied concentration
[mg kg-1]
Accuracy [%]
EID concentration ± conidence interval
[mg kg-1](1)
EM [%]
As(I) 188.979 156 ± 7 8 5 211 26 163 ± 7 4
Co(II) 228.616 12.8 ± 0.3 0.3 2 17.5 27 12 ± 2 7
Cr(II) 267.716 28 ± 8 10 34 113 70 27 ± 2 4
Cu(I) 324.754 380 ± 14 16 4 452 16 368 ± 8 3
Mn(II) 257.610 259 ± 13 15 6 470 45 245 ± 12 6
Ni(II) 231.604 27 ± 2 2 9 44 38 26 ± 1 4
Pb(II) 220.353 294 ± 15 16 5 404 29 271 ± 14 8
Zn(I) 213.856 726 ± 7 9 1 824 12 720 ± 43 1
V(II) 309.311 58 ± 5 5 8 127 54 (2) (2)
Al(I) 167.080 3.0 ± 0.4 0.2 7 12.22 75 3.85 ± 0.2 22
Ca(II) 317.933 1.2 ± 0.3 0.1 8 2.92 59 1.3 ± 0.1 8
Fe(II) 259.940 4.29 ± 0.04 0.01 0.2 6.96 38 6.29 ± 0.9 32
K(I) 766.490 0.45 ± 0.06 0.03 7 1.5 70 0.448 ± 0.001 0.4
Na(I) 558.995 2.7 ± 0.1 0.06 2 4.4 37 2.7 ± 0.5 0
Ti(II) 334.941 0.27 ± 0.03 0.01 4 0.7 61 0.28 ± 0.01 4
S: absolute standard deviation; (1): Al, Ca, Fe, K, Na and Ti given as oxide in % (w/w); (2): EID method was not applied; E
M: deined in text.
Table 5. Performance parameters experimentally estimated of the USEPA 3050B + ICP-OES method on sediment S11
Analyte line [nm]
Concentration ± conidence interval
[mg kg-1](1)
S [mg kg-1]
Precision [%]
EID concentration [mg kg-1]
S [mg kg-1]
Precision [%]
EM [%]
As(I) 188.979 6.5 ± 0.9 0.4 6 (2) (2) (2) (2)
Co(II) 228.616 8.6 ± 0.8 0.3 4 (2) (2) (2) (2)
Cr(II) 267.716 26 ± 3 1 4 28 1 5 7
Cu(I) 324.754 160 ± 5 2 1 257 16 6 38
Mn(II) 257.610 433 ± 31 12 3 1106 101 9 61
Ni(II) 231.604 27 ± 2 0.9 3 31 2 5 13
Pb(II) 220.353 140 ± 11 5 3 262 14 5 47
Zn(I) 213.856 287 ± 28 11 4 642 54 8 55
V(II) 309.311 131 ± 19 8 6 (2) (2) (2) (2)
Al(lI) 167.080 15 ± 2 1 7 16.7 0.51 3 10
Ca(II) 317.933 (3) (3) (3) 41.7 0.1 0.2 (3)
Fe(II) 259.940 5.6 ± 0.7 0.3 5 12.0 0.6 5 53
K(I) 766.490 0.97 ± 0.02 0.01 1 2.17 0.1 5 55
Na(I) 558.995 1.9 ± 0.5 0.2 11 4.82 0.2 4 61
Ti(II) 334.941 0.067 ± 0.006 0.002 3 1.78 0.01 0.6 96
Figure 1. Variation of the Cu (3a), Pb (3b) and Zn (3c) apparent concentration with the dilution factor for sediment S11 (illed symbols) and CRM PACS1 (empty symbols)
gations of the presence of matrix effect for the speciic sediments and analytes under study. As was demonstrated, the matrix effect in ICP-OES analysis may appear to depend on the sediment and analyte to be determined. This interference could not be present for the selected sediment CRM, as was shown for CRM PACS-1, while the interference does exist in the sediment under study.
By considering the relatively small number of samples and of the analytes used as indicators of contamination (Cu, Ni, Pb and Zn) to be assessed in this work, we decided to use the USEPA 3050B digestion in combination with FAAS as a detection method. As it was demonstrated in the corresponding section, acceptable performance parameters were achieved and no need for special investigation of the matrix effect was required.
Evaluation of the content of Cu, Ni, Pb and Zn in sediments from Atares inlet
The concentration of Ni was close to the average concentration of this metal on the surface of the earth.20 Moreover, the Ni content remained approximately constant within all the samples collected at different depths at Station S1. Both facts suggested that the Ni is not accumulated on the sediment surface. Contrastingly, the increase of Cu, Pb and Zn toward the surface of sediment was a categorical indicator21 of the inluence of human activity on the ecosystem. By considering the concentrations of Cu (52.7 mg kg-1), Pb (44 mg kg-1), and Zn (83.3 mg kg-1) in sediment S15 at the depth of 3.85 m as the blank concentrations, the enrichment factors (EF) are 3.2, 4.8 and 2.8 for Cu, Pb and Zn respectively. In contrast, the EF for Ni is 1.33.
There is not a Cuban regulatory guideline for the assessment of the contamination level of metals in sediments. For that reason, two different approaches were used. At irst, the concentrations of metals determined in surface sediment S11 were compared with the concentrations reported before.2, 3 Secondly, the Sediment Quality Assessment Guidelines was used to evaluate the biological effect of determined metals.22
Content of Cu (171 mg kg-1), Pb (213 mg kg-1) and Zn (325 mg kg-1) in surface sediment S11 was in the concentration range reported previously for Habana Bay,2, 3 which suggested that the high level of pollution in this bay has been kept stable. On the other hand, those high concentrations can produce adverse biological effects in the ecosystem, because they exceeded 1.6, 1.9 and 1.2 respectively, the probable effects level,22 corresponding for each metal. Even in the case of a possible underestimation of the content of Pb due to some loss by volatilization as described in Section 4.1, theses conclusions are correct, because the real concentration of Pb would be higher, which reinforce the conclusions on the relatively high contamination level of Pb. Thus, the anthropic impact on the Atares inlet was clearly appreciated from the obtained results.
CONCLUSIONS
USEPA 3050B method is a quite simple procedure for the eva-luation of the content of Cu, Ni, Pb and Zn in studied sediments. USEPA 3050B digestion method in combination with FAAS detection showed good performance parameters. Attention should be paid to the relatively low extraction ability of Pb and Zn (~ 80%), which has to be taken into account during the environmental interpretation of the analytical results.
The existence of the matrix effect on the ICP-OES analysis of the USEPA 3050B-extraction solution of surface sediment was demons-trated. This effect produced a signiicant deviation of the measured concentration of the analyte from its true value. For the irst time, the EID method was employed for the detection and correction of due to differences in the content of major elements present in the
digestion solutions of the samples. Determination of element concentration
The concentration of elements (called EID concentration in Table 4) was calculated as the average of Capi for all the dilutions made for CRM PACS-1. Obviously, the low (4-8%) deviation (EM) between EID concentration and concentration directly measured in the origi-nal sediment solution without dilution corresponded to the absence of matrix effect in the ICP-OES determination of most analytes in CRM PACS-1 solution. Therefore, it can be concluded that, the low accuracy (12-75%) obtained for CRM PACS-1 was principally due to the poor extraction ability of the USEPA 3050B digestion method. As expected, a signiicant correlation between Capi and 1/DFi was observed for most of the studied elements in sediment S11. Exceptions were for V and Cr because Capi of Cr was similar in all the dilutions made and a complex Capivs.1/DFi relationship for V did not permit to it a function. Furthermore, the EID method was not applied for As and Co because of their low concentration, which conditioned a very low signal. For the rest of analytes, a polynomial function was itted and the free of interference concentration of the element (cal-led EID concentration in Table 5) was calculated as the intercept of the itted function. Then, EID concentrationcan be used as the best estimation of the real concentration of analytes in digestion solution for sediment S11. The deviation (EM) between free of interference concentration calculated by EID methodand concentration directly measured in sediment solution without previous dilution (column 2 in Table 5) was a measure of matrix effect. It varied in a wide interval with the element determined.
investi-the matrix effect in sediment ICP-OES analysis. Thus, investi-the accurate determination of Cu, Mn, Ni, Pb, Zn and other elements in the se-diment solution was improved. The matrix effect was not observed for the sediment CRM PACS-1. Thus, a bad selection of CRM might lead to an erroneous evaluation of the accuracy of ICP-OES analysis for sediments under study. Alternatively, the EID method can be used. The application of EID method does not require any previous knowledge of sediment composition.
The high contents of Cu, Pb and Zn in sediments from Atares inlet were evidence of the negative inluence of the human activity over Havana Bay.
SUPPLEMENTARY MATERIAL
Available at http://quimicanova.sbq.org.br, in PDF ile, with free access. Geographical localization of samples sites and depth in which samples were collected are shown in Figure 1S. The variation of the content of Cu, Ni, Pb and Zn with depth in sediments collected at Station S1 is shown in Figure 2S.
ACKNOWLEDGEMENTS
This work has been principally supported by the National Program of Science and Technological Innovations of Cuba ‘‘New and Advanced Materials’’ (Project B7), the 2005 Higher Education Ministry of Cuba Convocation (Project 6.144) and the Program of Distinguished Visitors and Foreign Researchers of the UCM-Grupo Santander, 2008 Convocation. The authors wish to thank J. Beltrán and M. Ra. Sasco from Centro de Ingeniería y Manejo Ambiental de Bahías y Costas, La Habana, Cuba for the samples supplied. REFERENCES
1. Simeón Negrín, R. E.; Rey Santos, O.; La Bahía de la Habana y sus cuencas tributarias: atenuación de su contaminación y remediación. Resultados y perspectivas, Ministerio de Ciencia Tecnología y Medio Ambiente de Cuba; http://webapps01.un.org/dsd/caseStudy/public/ displayDetailsAction. do;jsessionid=5A499B1B2B9F23A950B3DA2 EBA4564D1?code=362, accessed March, 2010.
2. González, H.; Lera, L.; Torres, I. In Heavy metals in the environment: International Conference; Lekkas, T. D., ed.; Athens, Greek, September 1985, vol. 2, p. 424.
3. González, H.; Biogeochemistry1991, 14, 113.
4. Bubb, J. M.; Lester, J. N.; Water, Air, Soil Pollut. 1994,78, 279. 5. USEPA - United State Environmental Protection Agency; USEPA
3050B, Method 3050B. Acid Digestion of Sediments, Sludges and Soils, http://www.epa.gov/waste/hazard/testmethods/sw846/ pdfs/3050b.pdf, accessed June, 2010.
6. Burton, E. D.; Phillips, I. R.; Hawker, D. W.; J. Environ. Qual. 2005, 34, 263.
7. Sastre, J.; Sahuquillo, A.; Vidal Rauret, M. G.; Anal. Chim. Acta2002, 462, 59.
8. Kimberly, R. P.; Steven, S.; Kaplan, D. I.; Interim Report. WSRC-TR-2001-00574, 2001, http://sti.srs.gov/fulltext/tr2001574/tr2001574. html, accessed March, 2010.
9. Cobb, G. P.; Abel, M. T.; Rainwater, T. R.; Austin, G. P.; Cox, S. B.; Kendall, R. J.; Marsland, E. J.; Anderson, T. A.; Leftwich, B. D.; Zack, J. C.; Presley, S. M.; Environ Sci Technol.2006, 40, 4571.
10. Mermet, J. M.; J. Anal. At. Spectrom.2005, 20, 11.
11. European Commission; BCR Information Reference Materials, 1997, p. 51.
12. Thompson, M.; Ramsey, M. H.; J. Anal. At. Spectrom.1990, 5, 701. 13. Villanueva, M.; Catasús, M.; Salin, E. D.; Pomares, M.; J. Anal. At.
Spectrom.2000, 15, 877.
14. Villanueva, M.; Pomares, M., Catasús, M.; Díaz, J.; Química Analítica (Barcelona) 2000, 19, 39.
15. Mosqueda, Y.; Pomares-Alfonso, M.; Pérez-Cappe, E. L.; Fariñas, J. C.; Miranda, A.; Larrea, M. T.; Anal. Bioanal. Chem.2006, 386, 1855. 16. ISO (International Standard Organization); Soil quality – Dissolution
for the determination of total element content – Part 1: Dissolution with hydroluoric and perchloric acids, ISO 14869-1:2001 (2001). 17. EURACHEM-Guide; The Fitness for Purpose of Analytical Methods. A
Laboratory Guide to Method Validation and Related Topics, 1998, LGC (Teddington) Ltd: United Kingdom.
18. National Research Council, Canada, Division of Chemistry; Marine Analytical Chemistry Standards Program, 1990.
19. The Decision Sciences Journal of Innovative Education, T. C Krehbiel 2004, 2, 97, http://www.iso.org/iso/catalogue_detail. htm?csnumber=28454, accessed June 2010.
20. Wedepohl, K. H.; Geochim. Cosmochim. Acta 1995, 59, 1217. 21. Sánchez Urias, J. E.; Sanz Medel, A.; Talanta1998, 47, 509.
Supplementary Material
*e-mail: [email protected]
COMPARISON OF USEPA 3050B AND ISO 14869-1:2001 DIGESTION METHODS FOR SEDIMENT ANALYSIS BY USING FAAS AND ICP-OES QUANTIFICATION TECHNIQUES
Elvira Maria Galí Navarro
Centro de Investigación y Desarrollo Técnico, El Trigal, Boyeros, CP 8011, La Habana, Cuba Margarita Edelia Villanueva Tagle
Departamento de Química General, Facultad de Química, Universidad de la Habana, CP 10400, La Habana, Cuba Maria Teresa Larrea Marín
Centro Nacional de Investigaciones Metalúrgicas, 28040 Madrid, España Mario Simeón Pomares Alfonso*
Instituto de Ciencia y Tecnología de Materiales, Universidad de La Habana, CP 10400, La Habana, Cuba
Figure 1S. Geographical localization of samples sites and depth in which samples were collected