Sho
rt
R
ep
or
t
*e-mail: [email protected]
A Microdigestion Procedure Directly Performed in the Autosampler Cups
for the Determination of Trace Elements in Biological Samples by GF AAS
Reinaldo C. Campos,*,a Sergio F. Jerez Vegueria,a,b
Rodrigo A. Gonçalvesa and Ângela L. R. Wagenera
aDepartamento de Química, Pontifícia Universidade Católica do Rio de Janeiro,
CP 38097, 22453-900 Rio de Janeiro-RJ, Brazil
bInstituto de Química, Universidade Federal Fluminense, 24020-150 Niterói-RJ, Brazil
Um procedimento de microdigestão para a determinação de Cd e Cu em amostras biológicas por espectrometria de absorção atômica em forno de graite (GF AAS) é descrito. Massas de até 5 mg são pesadas diretamente na cubeta do amostrador automático e 100 µL de solução digestora (HNO3-H2SO4 1:1 v/v ou HNO3 concentrado) são adicionados. As cubetas são fechadas e a digestão é realizada a 60 oC, por 12 h, em um bloco de digestão especialmente desenhado;
seguem-se a adição de 900 µL de água ultrapura, a homogeneização e transferência das cubetas ao amostrador automático. O ambiente fechado e o uso de apenas um único frasco durante todo o processo minimizam os riscos de contaminação e perdas. Curvas analíticas externas, no mesmo meio do branco, mostraram-se adequadas para a calibração. A análise de nove diferentes materiais de referência certiicados permitiu a avaliação da exatidão do procedimento. Os limites de quantiicação na amostra original (5 mg), calculados a partir de dez sucessivas medições do branco (k = 10) foram 0,07 e 1,7 ou 0,02 e 0,3 µg g-1 para Cd e Cu, respectivamente, usando cada
uma das misturas. O procedimento foi utilizado, com sucesso, para a determinação de Cu em amostras de biópsia de fígado humano.
A microdigestion procedure for the determination of Cd and Cu in biological samples by graphite furnace atomic absorption spectrometry (GF AAS) is described. Masses up to 5 mg are directly weighed in the autosampler cup and 100 µL of the digestion solution (1:1 v/v HNO3 -H2SO4 or concentrated HNO3) are added. The cups are closed and the digestion is performed, at 60 oC overnight in a specially designed digestion block. After cooling, 900 µL of ultrapure water
is added, the solution is homogenized and the cups are transferred to the autosampler tray. Since the digestion is performed in a sealed environment and the whole procedure uses only one lask, the risks of contamination and losses are minimized. Calibration was performed with external calibration curves, in the same medium as the reagents blank. The analysis of nine different standard reference materials permitted the assessment to the accuracy of the procedure. Considering a 5 mg sample mass, the limits of quantiication in the original samples calculated from ten successive measurements of the blank solution (k=10) were 0.07 and 1.7 and 0.02 and 0.3 µg g-1 for Cd and
Cu respectively, using the HNO3-H2SO4 mixture or concentrated HNO3 for the digestion. The procedure was used for the determination of Cu in human liver biopsy samples.
Keywords: microdigestion procedure, trace analysis, graphite furnace atomic absorption
spectrometry
Introduction
The sample dissolution or digestion is still the most common sample pre-treatment in total trace analysis, since a low viscosity liquid (preferably an aqueous solution) is
the more adequate way for presenting samples to most available instrumentation.1 The introduction of liquid
from 10 to 100 mL. Solid sampling (SS) is an alternative and techniques such as solid sampling electrothermal vaporization associated to inductively coupled plasma mass spectrometry (SS-ETV-ICP-MS) or solid sampling graphite furnace atomic absorption spectrometry (SS-GF
AAS) are examples of such possibility.2,3 Solid sampling
is claimed to avoid the risks of contamination and losses that are related to sample digestion, and since no dilution occurs, excellent limits of detection in the original samples can be obtained. However, typical problems related to solid sampling still impair the spread of its acceptance in routine analysis: Due to the small sample masses usually used 4,5 problems related to sample non-homogeneity
may be experienced; since the use of aqueous calibration solutions is not always possible, calibration problems may also be observed.
An alternative for dealing with small sample masses are
microdigestion procedures.6-19 They can be performed by
direct acid addition or vapor phase digestion.7-10,12,14,15,19-25
Contamination risks can be minimized if a single vessel is used for the whole procedure.6,8,11,15,19-23,25-30
For instance, Sperling has proposed a microdigestion procedure for the determination of Cd in environmental samples.31 He used 50 µL of a 1+4 v/v H
2SO4:HNO3
mixture to digest 5 mg of biological materials in 1.5 mL polypropylene (eppendorf) vials. The solution was then made up to 1 mL with deionized water before ammonium pyrrolidinedithiocarbamate (APDC) extraction and GF AAS determination in the organic extract. Later on, Campos et al.32 have used the same
strategy as a comparison procedure for the analysis of small masses of solid powdered vegetable samples, but the GF AAS determination was performed directly in the aqueous solution derived from the acid digestion. An interesting variation was presented by Flores and co-workers, who determined As in 10 mg hair samples, after microwave-assisted digestion in 1.5 mL polypropylene vials; determination was performed by hydride generation atomic absorption spectrometry, and the digestion lask was used as reduction vessel, as
well.33 However, if GF AAS is to be used, as in the former
cases, the inal sample solution has still to be transferred to the autosampler cups. Thus, in order to overcome this step, the present work proposes and investigates the direct weighing and digestion of biological samples in the autosampler cups of the GF AAS instrument itself. The digestion was performed in a sealed system using a specially designed digestion block, avoiding any sample transference, aiming at minimizing contact with exogenous surfaces.
Experimental
Instrumental
The GF AAS measurements were performed in a model ZEEnit 60 (Analytik Jena, Jena, Germany) atomic absorption spectrometer, equipped with a transversally heated graphite atomizer, and an AS-52 autosampler. Cadmium and Cu hollow cathode lamps (Analytik Jena) operated at 228.8 and 324.8 nm were respectively used as line sources. The lamp currents and slits were those recommended by the manufacturer. Pin platform pyrolitically coated graphite tubes were used, as well as Zeeman effect based background correction with the 2-ield mode at 0.8 T. Measurements were performed in peak area, and were the average of at least 3 replicates. The injected volumes were always 10 µL. An AD-4 microbalance (Perkin Elmer, Bodenseewerk, Germany, Part No. C655-001, 0.1 µg sensitive) was used for the sample weighing. For the digestion, a specially designed cylindrical aluminum digestion block (Ø = 140 mm; h = 40 mm), with 18 drilled holes (Ø = 14 mm) were used. The cups stoppers were kept in place during the digestion by an aluminum cover (Ø = 140 mm; h = 12 mm), tightened by three screw-nuts (Figure 1). The autosampler cups (Sarstedt, Numbrecht, Germany, part number 73.641) are made of polystyrene, and the stoppers (Sarstedt, part number 65.649) are made of low density polyethylene.
Materials, reagents, solutions, certiied reference materials and samples
Argon 99.99% (AGA, Rio de Janeiro, Brazil) was used as a protective and carrier gas. Ultra pure water, obtained from a Gehaka Master System apparatus (Gehaka, Sao Paulo, Brazil) was used throughout. Analytical grade
HNO3 (Vetec, Rio de Janeiro, Brazil) was puriied by sub
boiling distillation using a telonR sub boiler apparatus (Hans
Kuerner, Rosenheim, Germany). Sulfuric acid (Merck, Rio de Janeiro, Brazil) was of analytical reagent grade and
1000 mg L-1 Cd and Cu stock solutions were respectively
prepared by adequate dilution of Titrisol ampoules (Merck,
Darmstadt, Germany) with 0.2% v/v HNO3. Calibration
solutions were prepared by further convenient dilutions of the stock solutions in the same acid concentration as the digestion blanks. Two digestion solutions were used:
1+1 v/v HNO3:H2SO4 and concentrated HNO3. Palladium
nitrate (10000 mg L-1) and Mg(NO
3)2 (10000 mg L-1),
both from Merck were used for preparing the modiier solution. A series of certiied reference materials (CRMs) was analyzed and they are listed throughout the work. Two biopsy human liver samples were also analyzed. All plastic ware was washed with tap water, immersed in 10% v/v neutral Extran solution (48 h), rinsed in sequence with
tap and deionized water, and immersed in 20% v/v HNO3
for, at least, 24 h. Before handling, these materials were thoroughly rinsed with ultrapure water and oven dried at 40 oC, avoiding any contact with metallic surfaces and dust
contamination. Contamination was always checked up by a strict blank control.
Proposed procedure
Sample aliquots weighing between 0.5 and 5 mg were directly weighed in the autosampler vials (conical bottom). The acid digestion solution (100 µL) was then added to the vials. The cups were tightly closed with the plastic stoppers and placed in the digestion block. The cover of the digestion block was then screwed on the body of the block, pressing the stoppers and sealing the cups. The digestion block was transferred to an oven, and heated to 60 oC
remaining at this temperature overnight. All the digestion was performed in a hood; afterwards, the digestion block was let to cool down to the room temperature, the cover of the digestion block was removed and the cups (still closed) were removed from the block. In this way, no oxidation of the block was observed along the experiments. The cups were opened, and 900 µL of ultrapure water was added to each vial. Homogenization was achieved by aspirating/ dispensing the solution in the vials many times. This operation was manually performed with the micropipette used for adding the ultrapure water, using a unique tip for each cup. The vials were then transferred to the autosampler tray and the GF AAS analysis was performed according to the optimized graphite furnace programs displayed in Table 1. Cadmium determination was performed with the aid of Pd and Pd+Mg as modiiers. The modiier masses dispensed onto the platform were 10 µg (Pd) and 10 + 15 µg
(Pd+Mg(NO3)2) and the injected volumes (sample and
modiier solutions) were 10 µL. Palladium alone was used for the samples digested with the acid mixture; Pd+Mg
when only HNO3 was used. The modiier was injected in
the conventional way that is after the sample solution and before the drying steps. The water contents of the CRM samples were determined in separate aliquotes, by heating
them at 105 oC overnight. The calculations took the water
content into consideration.
Results and Discussion
Temperature program optimization
Optimum pyrolysis and atomization temperatures were obtained from pyrolysis and atomization temperatures curves performed in the blanks, prepared by the 1+9 (v/v)
dilution of the digestion solutions (1+1 v/v HNO3:H2SO4
andconcentrated HNO3). They are displayed in Table 1 as
well as other temperature programs parameters. Before the determinations, the vicinities (± 100 oC) of the pyrolysis and
atomization temperatures chosen were investigated for both the calibration solutions and each kind of sample solution. This was due to the possibility of differences between set and real temperatures. This also permitted to verify the adequacy of the pyrolysis and atomization temperatures to the real samples.
Calibration and igures of merit
External calibration was performed with aqueous calibration solutions prepared using the same media as the blanks. No statistically signiicant difference was observed between the slopes derived from these calibration curves and those obtained from analyte addition curves, for the various matrices and the two elements studied. Correlation coefficients were always better than 0.99 and typical coeficients of variation between 1 and 3% were observed
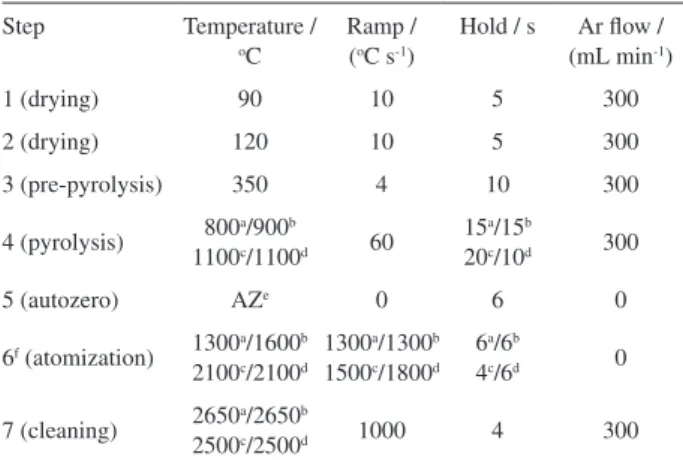
Table 1. GF AAS temperature programs
Step Temperature /
oC
Ramp / (oC s-1)
Hold / s Ar low / (mL min-1)
1 (drying) 90 10 5 300
2 (drying) 120 10 5 300
3 (pre-pyrolysis) 350 4 10 300
4 (pyrolysis) 800a/900b 1100c/1100d 60
15a/15b
20c/10d 300
5 (autozero) AZe 0 6 0
6f (atomization) 1300a/1600b
2100c/2100d
1300a/1300b
1500c/1800d
6a/6b
4c/6d 0
7 (cleaning) 2650a/2650b
2500c/2500d 1000 4 300
aCd, after 1+1 HNO
3+H2SO4 digestion; bCd, after HNO3 digestion; cCu,
after 1+1 HNO3+H2SO4 digestion; dCu, after HNO
3 digestion; eautozero
if the same sample solution was analyzed in sequence (n = 5). The limits of detection (LODs) were calculated from 10 successive measurements of the blank solutions (k = 3) as recommended by IUPAC. They were 0.1 and 2.5 µg L-1, for Cd and Cu respectively, if the acid mixture
had been used for the digestion. For the digestion with
HNO3, they were 0.03 and 0.5 µg L-1. Considering sample
masses of 5 mg, the limits of quantiication in the original samples were 0.07 and 1.7 µg g-1 using the digestion
mixture, and 0.02 and 0.3 µg g-1 using the concentrated
HNO3, for Cd and Cu, respectively.
Accuracy
Accuracy was assessed by the analysis of certified reference materials. They are listed in Tables 2 and 3, as well as their respective certiied values and conidence ranges. Table 2 also shows the results, and their respective conidence ranges, obtained after digestion with the 1+1 v/v HNO3:H2SO4 mixture, while Table 3 refers to the HNO3 digestion. In relation to Cd, the digestion with the 1+1 v/v HNO3:H2SO4 solution (Table 2) led to good agreement between found and certiied values for the four CRMs that showed Cd values above the limit of quantiication of the procedure. Cd values in Dogish Muscle, Non Fat Milk Powder, Peach, Citrus and Apple Leaves were below this limit. For Cu, its content in only one CRM was below the limit of quantiication (Non Fat Milk Powder). For all other CRMs, good agreement between found and certiied values was observed. For the digestion with concentrated HNO3 only (Table 3), better limits of quantiication could be observed due to the lower
blanks obtained. The concentrated HNO3 was puriied by sub
boiling distillation while this puriication procedure proved to be ineffective for H2SO4. The lower blanks permitted the determination of Cd in two of the CRMs (Peach Leaves and
Citrus Leaves) that were below the limit of quantiication using the previous digestion mixture. Acceptable agreement between found and certiied values was veriied, especially considering that their values are very close to the limit of quantiication. On the other hand, low Cd recovery was now observed for Dogish Muscle. In contrast, for Cu, a good agreement was observed in all cases, and the new limit of quantiication was low enough to permit the Cu determination even in the Non Fat Milk Powder CRM.
Conidence ranges of the found values larger than those correspondent to the certiied values can be explained by the small sample masses used in the proposed procedure in comparison to those used in the certiication of these materials. However, even in these cases the coeficients of variation of the proposed procedure are adequate for trace analysis. Note that in Tables 2 and 3 the n = 5 value is related to the number of independent analysis performed for the same sample, which includes the sample weighing. As expected, a tendency to larger coeficients of variation was observed in the cases which concentration values were close to the limits of quantiication.
Application
A signiicant application for the proposed procedure arose when two liver biopsy samples came to the laboratory in order to be investigated for their Cu content, for a possible Wilson disease diagnostic. They were presented in small pieces about 2 mm3 in size, implicating that
any physical pre-treatment (grinding, homogenization) would be technically dificult and lead to prohibitive mass losses. Their very small masses also impaired the use of conventional digestion procedures. The use of direct solid sampling GF AAS would imply cutting the samples in even smaller pieces, a dificulty and risky operation, due to the
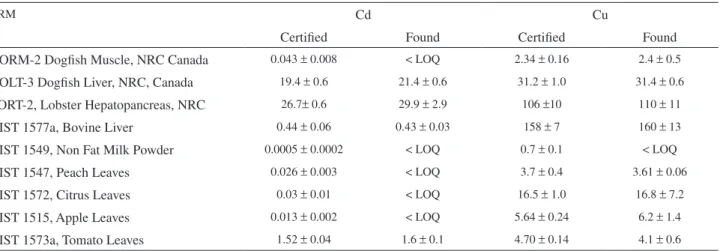
Table 2. Cd and Cu determination in CRMs by the proposed procedure using the 1+1 v/v H2SO4:HNO3 solution for the sample digestion: Found (n = 5) and certiied values in µg g-1. Uncertainties are 95% conidence intervals
CRM Cd Cu
Certiied Found Certiied Found
DORM-2 Dogish Muscle, NRC Canada 0.043 ± 0.008 < LOQ 2.34 ± 0.16 2.4 ± 0.5
DOLT-3 Dogish Liver, NRC, Canada 19.4 ± 0.6 21.4 ± 0.6 31.2 ± 1.0 31.4 ± 0.6
TORT-2, Lobster Hepatopancreas, NRC 26.7± 0.6 29.9 ± 2.9 106 ±10 110 ± 11
NIST 1577a, Bovine Liver 0.44 ± 0.06 0.43 ± 0.03 158 ± 7 160 ± 13
NIST 1549, Non Fat Milk Powder 0.0005 ± 0.0002 < LOQ 0.7 ± 0.1 < LOQ
NIST 1547, Peach Leaves 0.026 ± 0.003 < LOQ 3.7 ± 0.4 3.61 ± 0.06
NIST 1572, Citrus Leaves 0.03 ± 0.01 < LOQ 16.5 ± 1.0 16.8 ± 7.2
NIST 1515, Apple Leaves 0.013 ± 0.002 < LOQ 5.64 ± 0.24 6.2 ± 1.4
very small sample size. Thus, the samples were analyzed as they were received: Each small piece was directly introduced and weighed in the cup for digestion. They weighed 5.222 and 5.960 mg (wet weight), respectively. They were submitted to the proposed microdigestion
procedure, using the 1+1 v/v HNO3:H2SO4 acid mixture,
and Cu values of 11 and 38 µg g-1, wet weight were found
in the two biopsy samples, respectively. A parallel Bovine Liver CRM analysis was run, for quality assurance leading to good agreement between the found and certiied value.
Conclusions
The proposed method proved to be feasible for the digestion of different kinds of biological samples. Good agreement between found and certiied values using the
1+1 v/v HNO3:H2SO4 digestion mixture was observed in
the determination of Cd in those investigated CRMs that presented Cd values above the limit of quantiication. The
digestion with concentrated HNO3 alone led to poorer Cd
recoveries in the analysis of Dogish Muscle. However, it permitted the assessment of less concentrated CRMs due to lower limit of quantiication found in this case, a consequence of the lower blank. For Cu, good agreement between found and the certiied values was observed in all investigated CRMs by both digestion procedures. However,
the digestion with HNO3 also permitted the assessment to
lower concentrations due to the lower blanks observed. These results underline the importance of a detailed optimization of the digestion mixture composition for a full exploitation of the proposed procedure. Concerning the background attenuation, it was always comfortably in the range of the background corrector.
The proposed digestion procedure is simple, performed in a closed environment, and actually uses only one vessel from
weighing till the instrumental measurement, minimizing the risks of contamination or losses. The small size of the digestion vessel (the autosampler cup, itself) makes it possible to design small heating blocks with a large number of places. These blocks are easy to handle, heat in normal ovens, and cool down in a short time, due to their relatively small mass. The inal sample solution homogenization is easily performed with the same automatic pipette used for making up the inal volume, and the cups are ready to be transferred to the autosampler tray. The temperature of the digestion procedure could not be increased, otherwise the autosampler cups would deform, impairing their proper adjustment in the autosampler tray. This led to a somewhat large digestion time. However, the possibility of batches with a large number of places can compensate for this disadvantage if a large number of samples are to be analyzed. The investigation of other digestion mixtures may also enlarge the applicability of the method. The limits of quantiication were low enough to permit Cu determination in all samples and Cd determination in all but two CRMs. To the best of our knowledge, this is the irst really one vessel digestion-instrumental determination procedure described for GFAAS in the literature. The method also aligns itself
with the principles of a green analytical methodology.34,35
It is important to note that certiied values and their ranges in certiied reference materials are calculated for sample masses much larger than those used in the present work. Thus one can expect that an important contribution to the coeficients of variation presently found is related to the sample non homogeneity, due to the small masses used. However, even with such low masses, the investigated CRMs have shown themselves suficient homogeneous to permit acceptable coeficient of variations in trace analysis. This is also observed in other micro sampling techniques, such as
solid sampling GF AAS.36-42
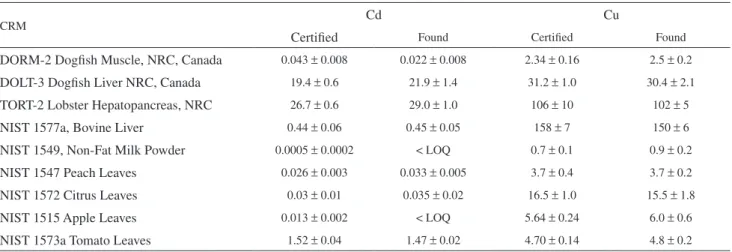
Table 3. Cd and Cu determination in CRMs by the proposed procedure using concentrated HNO3 for the sample digestion: Found (n = 5) and certiied values in µg g-1. Uncertainties are 95% conidence intervals
CRM Cd Cu
Certiied Found Certiied Found
DORM-2 Dogish Muscle, NRC, Canada 0.043 ± 0.008 0.022 ± 0.008 2.34 ± 0.16 2.5 ± 0.2
DOLT-3 Dogish Liver NRC, Canada 19.4 ± 0.6 21.9 ± 1.4 31.2 ± 1.0 30.4 ± 2.1
TORT-2 Lobster Hepatopancreas, NRC 26.7 ± 0.6 29.0 ± 1.0 106 ± 10 102 ± 5
NIST 1577a, Bovine Liver 0.44 ± 0.06 0.45 ± 0.05 158 ± 7 150 ± 6
NIST 1549, Non-Fat Milk Powder 0.0005 ± 0.0002 < LOQ 0.7 ± 0.1 0.9 ± 0.2
NIST 1547 Peach Leaves 0.026 ± 0.003 0.033 ± 0.005 3.7 ± 0.4 3.7 ± 0.2
NIST 1572 Citrus Leaves 0.03 ± 0.01 0.035 ± 0.02 16.5 ± 1.0 15.5 ± 1.8
NIST 1515 Apple Leaves 0.013 ± 0.002 < LOQ 5.64 ± 0.24 6.0 ± 0.6
References
1. Butler, O. T.; Cook, J. M.; Harrington, C. F.; Hill, S. J.; Rieuwerts, J.; Miles, D. L.; J. Anal. At. Spectrom.2006, 21, 217.
2. Resano, M.; Aramendia, M.; Devos, W.; Vanhaecke, F.; J. Anal.
At. Spectrom. 2006, 21, 891.
3. Vale, M. G. R.; Oleszczuk, N.; dos Santos, W. N. L.; Appl.
Spectrosc. Rev.2006, 41, 377.
4. Kurfürst, U.; Appl. Spectrosc. Rev. 1991, 63, 1205.
5. Belarra, M. A.; Resano M.; Castillo, J. R.; J. Anal. At. Spectrom.
1998, 13, 489.
6. Croteau, M.; Hare, L; Tessier, A.; Can. J. Fish. Aquat. Sci. 2001,
58, 1737.
7. Barkacs, K.; Varga, A.; Gál-Solynos, Zaray, G.; J. Anal. At.
Spectrom. 1999, 14, 577.
8. Araújo, G. C. L.; Nogueira, A. R.; Nóbrega, J. A.; Microchim. Acta
2004, 144, 81.
9. Dash, K; Thangavel, S.; Dhavile, S. M.; Rao, S. V.; Chaurasia, S. C.; Arunachalam; Anal. Chim. Acta2005, 546, 229.
10. Amarasiriwardena, D.; Analyst1994, 119, 1017
11. Nieuwenhuize, J.; Poley-Vos, C. H.; Goud, A.; Hemminga, M. A.;
At. Spectrosc.1988, 9, 204.
12. Dombovári, J.; Becker, J. S.; Dietze, H. J.; FreseniusJ. Anal. Chem. 2000, 367, 407.
13. Anderson, K.; At. Spectrosc.1996, 17, 30.
14. Krushevska, A.; Waheed, S.; Nóbrega, J. A.; Amarisiriwardena, D.; Barnes, R. M.; Appl. Spectrosc. 1998, 52, 205.
15. Bohlen, A.; Klockenkamper, R.; Messerschimidt, J.; Alt, F.; Anal.
Chim. Acta2002, 451, 279.
16. Silva, M. M.; Vale, M. G. R.; Damin, I. C. F.; Welz, B.; Mandaji, M.; Fett, J. P.; Anal. Bioanal. Chem. 2003, 377, 165.
17. Marcó, L. M; Capote, T.; Hernández, C.; Greaves, E. D.;
Spectrochim. Acta2001, 56B, 2187.
18. Cain, D. J.; Buchwalter, D. B.; Luoma, S. N.; Environ. Toxicol. Chem. 2006, 25, 1042.
19. Araújo, G. C. L.; Nogueira, A. R. A.; Nóbrega, J. A.; Analyst 2000,
125, 1861.
20. Dash, K.; Thangevel, S.; Dhavile, S. M.; Chandrasekaran, K; Chaurasia, S. C.; At. Spectrosc. 2003, 24,143.
21. Eilola, K.; Peramaki, P.; Analyst2003, 128, 194.
22. Czégény, Z.; Berente, B.; Óvári, M.; Tapia, M. T.; Záray. G.;
Microchem. J. 1998, 59, 100.
23. Eilola, K.; Peramaki, P.; Fresenius J. Anal. Chem. 2001, 369, 107. 24. Nóbrega, J. A.; Trevizan, L. C.; Araújo, G. C. L.; Nogueira, A. R.
A.; Spectrochim. Acta 2002,57B,1855.
25. Niemela, M.; Kola, H.; Eilola, K.; Peramaki, P.; J. Pharm. Biomed. Anal. 2004, 35, 33.
26. Silva, W. G. P.; Campos, R. C., Miekeley, N.; Anal. Lett. 1998, 31,
1061.
27. Momen, A.; Zachariadis, G. A.; Anthemidis, A. N.; Stratis, J. A.;
Anal. Chim. Acta2006, 565, 81.
28. Dhindsa, H. S.; Battle, A. R.; Mierzwa, J.; Fresenius J. Anal. Chem.
1998, 362, 374.
29. Padilla, L. K.; Anderson, K. A.; Chemosphere2004, 49, 575.
30. Dierenfeld, E. S.; tkinson, S.; Craig, M.; Walker, K. C.; Strich, W. J.; Clauss, M.; Zoo Biol.2005, 24, 51.
31. Sperling, K. R. In Fortschiritte in der Atomspektrometrischen
Spurenanalytik; Welz, B., ed., VCH: Weiheim, Germany, 1984,
p. 385.
32. Campos, R. C.; Curtius, A. J.; Berndt, H.; J. Braz. Chem. Soc.
1990, 1, 66.
33. Flores, E. M. M.; Saidelles, A. P.; Barin, J. S. ; Mortari, S. R.; Martins, A. F.; J. Anal. At. Spectrom. 2001, 16, 1419.
34. Lawrence, H. K.; Gron, L.U.; Young, J. L.; Chem. Rev. 2007, 107,
2695.
35. Armenta, S.; Garrigues, S.; de la Guardia, M.; Trends Anal. Chem.
2008, 27, 197.
36. Nowka, R.; Müller, H.; Fresenius J. Anal. Chem. 1997, 359, 132.
37. Silva, M. M.; Vale, M. G. R.; Damin, I. C. F.; Welz, B.; Mandaji, M.; Fett, J. P.; Anal. Bioanal. Chem. 2003, 377, 165.
38. Resano, M.; Garcia-Ruiz, E.; Vanhaecke, F.; Crespoband, C.; Belarra, M. A.; J. Anal. At. Spectrom.2004, 19, 958.
39. Kurfurst, U.; Rehnert, A.; Muntau, H.; Spectrochim. Acta1996,
57B, 229.
40. Ribeiro, A. S.; Vieira, M. A.; da Silva, A. F.; Borges, D. L. G.; Welz, B.; Heitmann, U.; Curtius, A. J.; Spectrochim. Acta2005,
60B, 693.
41. Resano, M.; Briceno, J.; Aramend, M.; Belarra, M. A.; Anal. Chim. Acta2007, 582, 214.