THIS DOCUMENT IS NOT AN INVESTMENT RECOMMENDATION AND SHALL BE USED EXCLUSIVELY FOR ACADEMIC PURPOSES (SEE DISCLOSURES AND DISCLAIMERS AT END OF DOCUMENT)
See more information at WWW.NOVASBE.PT Page 1/32
M
ASTERS IN
F
INANCE
E
QUITY
R
ESEARCH
We initiate our coverage with a price target of €8,57 for end of 2012, meaning an impressive upside potential of 97,5% relative to today’s price of €4,39. Our recommendation stands for BUY.
Macro concerns do not provide a positive outlook for PT’s
domestic business; in particular, we expect mobile’s impressive EBITDA margin to start declining with the increased pressure on ARPUs (led by the increasing penetration of tribal plans) and further cuts on MTRs. For FY 2011, we estimate mobile revenues of €1236 mn in FY 2011 and €1159 mn in FY 2012.
The wireline business has shown to be extremely resilient to the crisis but we do not expect an upgrade of the triple-play plans in the short term. Heavy domestic investments in new generation networks, namely in FTTH and LTE, may take longer time than expected to monetize as costumers will cut on high-end offers but the success of triple-play is expected to continue to “offset” a decrease in revenues from enterprises. We estimated wireline revenues of €1827 mn for FY 2011 and €1805 mn for FY 2012.
Oi’s turnaround is still an uncertainty. We do not expect a recovery in short term as fixed-mobile substitution effect is sticky and competition in mobile is extremely intense. We forecast revenue growth to reach -6% in FY 2011 and -1% in FY 2012. Company description
Portugal Telecom is the leading telecommunications operator in Portugal, covering all the segments of the sector: fixed, mobile, data and corporate solutions. The company is also present in Brazil, mainly through a stake in Oi, as well as in several other countries of Africa and Asia.
P
ORTUGAL
T
ELECOM
C
OMPANY
R
EPORT
T
ELECOM 06JANUARY 2012S
TUDENT:
J
OÃOP
EREIRA DOSS
ANTOS[email protected]
Not Everything is Falling
Domestic business will suffer but wireline has shown
resilience
Recommendation: BUY
Price Target FY12: 8,57 €
Price (as of 6-Jan-12) 4,39 €
Reuters: PTC.LS, Bloomberg: PTC.PL
52-week range (€) 4,40-8,85
Market Cap (€m) 3.935,7
Outstanding Shares (m) 896.512,5
Source: Bloomberg
Source: Bloomberg
(Values in € millions) 2010 2011E 2012E Revenues 3742 6080 6573 EBITDA 1492 2275 2488 Net Profit 5672 453 606
EPS 6,48 0,52 0,69
PER 1,29 8,56 12,40 Source: Bloomberg, analyst estimates
50 100 150 05 -0 7-20 11 19 -0 7-20 11 02 -0 8-20 11 16 -0 8-20 11 30 -0 8-20 11 13 -0 9-20 11 27 -0 9-20 11 11 -1 0-20 11 25 -1 0-20 11 08 -1 1-20 11 22 -1 1-20 11 06 -1 2-20 11 20 -1 2-20 11 03 -0 1-20 12
PT vs PSI-20
PORTUGAL TELECOM COMPANY REPORT
THIS DOCUMENT IS NOT AN INVESTMENT RECOMMENDATION AND SHALL BE USED EXCLUSIVELY FOR ACADEMIC PURPOSES (SEE DISCLOSURES AND DISCLAIMERS AT END OF DOCUMENT)
PAGE 2/32
Table of Contents
Executive summary ...3
Valuation ...4
Company overview ...6
Company description……….6
Shareholder structure………7
Business Description ... 729 Portugal - Wireline ... 7
Portugal - Mobile ... 17
Brazil - Oi ... 24
Conclusion ...29
Summary Tables ...30
PORTUGAL TELECOM COMPANY REPORT
THIS DOCUMENT IS NOT AN INVESTMENT RECOMMENDATION AND SHALL BE USED EXCLUSIVELY FOR ACADEMIC PURPOSES (SEE DISCLOSURES AND DISCLAIMERS AT END OF DOCUMENT)
PAGE 3/32
Executive summary
Our valuation implies an upside potential of 95,3% relative to current price of €4,39. We valued PT with a sum of the parts approach, using a DCF for the main businesses: Wireline (Portugal), Mobile (Portugal) and Oi (Brazil).
In Portugal, the macro downturn is expected to be even worse in 20111 and both the fixed and the mobile businesses will struggle. We expect Meo to keep offsetting the decline in the enterprise business2 but, although fiber accesses should increase significantly, triple-play offers will not be upgraded in the short-term not allowing for a rapid monetization of last three years’ heavy Capex levels3. We forecast wireline revenues to decline to €1827 mn in 2011 and €1805
mn in 2012. Mobile consumer revenues should keep decreasing as a consequence of the increasing penetration of tribal plans, pushing down ARPUs. Besides this, the outlook for MTRs remains negative, with Anacom’s announcement that further cuts are expected to occur over this year. Regarding data revenues, we see positive signs for an increase penetration of mobile broadband in Portugal but, just as in fixed, value added services will have to wait for their opportunity. TMN revenues are expected to decline by -11% in 2011 to
€1236 mn and to decrease further -6% in 2012 to €1159 mn. Moreover, considering TMN’s best in class cost-efficiency, we are expecting that the pressure on revenues will push down EBITDA margins from 45.4% in FY 2011 to 43.6% in FY 2012 and 42.6% in FY 2013.
In Brazil, Oi faces a very intense competition and the turnaround is expected to be extremely difficult. With its larger exposure to the fixed market, Oi is hoping that multiple-play play offers will fight the current fixed line loss (the partnership with PT may be positive in this sense). The company’s low income costumer base should challenge the success of this strategy but the emerging nature of this economy may also bring some surprises and the pay-TV is starting to grow. In the mobile, Oi’s competitive position (4th in market share) and Oi’s large pre-paid customer base (about 83% of total) do not provide good expectations for the short term. We believe that revenues (in Brazilian real) will have a negative growth of 5,9% in 2011 and negative 0,8% in 2012.
1
Our estimates appoint for a negative real growth of GDP of 3,5% compared to negative 1,55% in 20 in 2011. 2
We estimate Meo costumers to reach 1051K in 2011 and 1123K in 2012. 3
PORTUGAL TELECOM COMPANY REPORT
THIS DOCUMENT IS NOT AN INVESTMENT RECOMMENDATION AND SHALL BE USED EXCLUSIVELY FOR ACADEMIC PURPOSES (SEE DISCLOSURES AND DISCLAIMERS AT END OF DOCUMENT)
PAGE 4/32
Valuation
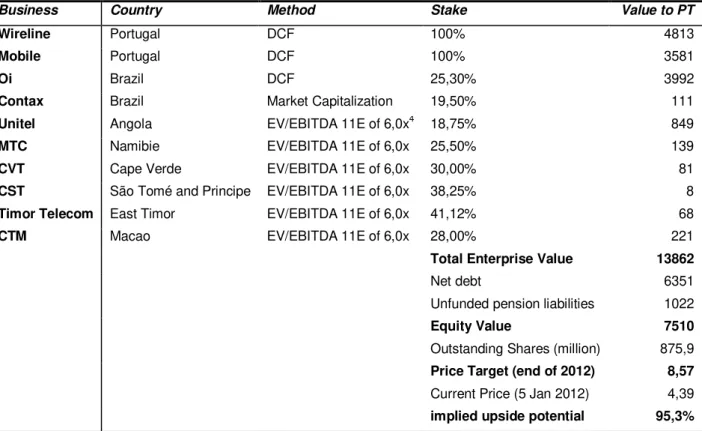
We reached a price target of €8,57 for end of FY2012, with an implied upside potential of 95,3%. Thus, our recommendation stands for BUY. We used a sum of the parts approach to perform our valuation. We divided PT’s forecasts into three main segments: Portugal-Wireline, Portugal-Mobile and Oi. These three segments were valued using a Discounted Cash Flow (DCF) approach, Contax was valued through market capitalization and the remaining international assets were valued with multiples. Here is a summary of our valuation:
Table 1: Sum of the Parts
Unit: € millions, except otherwise stated; Source: analyst estimates, Bloomberg
We chose an explicit forecast period of 10 years, with estimates until 2021, assuming a constant growth for the following cash flows. To discount our free cash flows in the DCF models, we compute the discount rates using the WACC method. The components of our WACCs are described in table 2.
4
Average sector multiple of Africa and Asia
Business Country Method Stake Value to PT
Wireline Portugal DCF 100% 4813
Mobile Portugal DCF 100% 3581
Oi Brazil DCF 25,30% 3992
Contax Brazil Market Capitalization 19,50% 111
Unitel Angola EV/EBITDA 11E of 6,0x4 18,75% 849
MTC Namibie EV/EBITDA 11E of 6,0x 25,50% 139
CVT Cape Verde EV/EBITDA 11E of 6,0x 30,00% 81
CST São Tomé and Principe EV/EBITDA 11E of 6,0x 38,25% 8
Timor Telecom East Timor EV/EBITDA 11E of 6,0x 41,12% 68
CTM Macao EV/EBITDA 11E of 6,0x 28,00% 221
Total Enterprise Value 13862
Net debt 6351
Unfunded pension liabilities 1022
Equity Value 7510
Outstanding Shares (million) 875,9
Price Target (end of 2012) 8,57
Current Price (5 Jan 2012) 4,39
PORTUGAL TELECOM COMPANY REPORT
THIS DOCUMENT IS NOT AN INVESTMENT RECOMMENDATION AND SHALL BE USED EXCLUSIVELY FOR ACADEMIC PURPOSES (SEE DISCLOSURES AND DISCLAIMERS AT END OF DOCUMENT)
PAGE 5/32
Table 2: WACC Assumptions
In graph 1, it is possible to see the decomposition of our forecasted enterprise value and find where the major sources of value are. According to our valuation, the Portuguese wireline segment accounts for the largest portion of the enterprise value (35%), followed by the Brazilian Oi (29%) and the domestic mobile (26%). Apart from these businesses, clearly the most valuable assets are Unitel (Angola) with 6% of enterprise value and CTM (Macao) with 2%.
To test on how sensitive the price target is to our estimation of the WACCs and the nominal growth of the perpetuities, we performed a sensitivity analisys.
5
In nominal € 6
In nominal R$ 7
Using an average yield-to-maturity of 7% for long-term bonds of comparable companies with similar rating (S&P’s BBB-) and business. Furthermore, we computed the costs of debt considering a probability of default of 3% and a recovery rate of 50%, taking into account Moody’s study “Corporate default and recovery rates, 1920-2010”
8 Using the average yield-to-maturity of long-term bonds of comparable companies with similar leverage and business
9
Last year arithmetic average of German government 10Y bonds 10
Last year arithmetic average of German government 10Y bonds plus the difference between the expected long term inflation for Brazil and the EuroZONe.
11
Average beta between European comparable companies and the S&P 500 for the last ten years using weekly data. 12
Average beta between Brazilian comparable companies and the S&P 500 for the last ten years using weekly data. 13
Analyst estimates 14
Analyst estimates
WACC Portugal5 WACC Brazil6
pre-tax cost of debt 6,9%7 10,0%8
risk-free rate 2,7%9 5,2%10
market premium 5,5% 6,5%
levered beta 1,1011 1,0312
cost of equity 8,7% 11,8%
Tax rate 30,0% 34,0%
D/E 0,6 0,4
WACC 7,3% 10,3%
nominal growth rate 2,0% 6,0%
LT inflation 2,0%13 4,5%14
Real growth rate 0,0% 1,5%
35%
26% 29%
6% 5% PortugalWireline
Portugal Mobile
Oi
Unitel
Graph 1: Enterprise Value by Business
39,6% 39,7% 31,2% 60,4% 60,3% 68,8%
0,0% 20,0% 40,0% 60,0% 80,0% 100,0% 120,0% Portugal Wireline Portugal Mobile Oi Perpetuity
Explicit Forecast Period
Graph 2: Weight of explicit forecast Period (2012-2021) and Perpetuity
Source: analyst estimates
PORTUGAL TELECOM COMPANY REPORT
THIS DOCUMENT IS NOT AN INVESTMENT RECOMMENDATION AND SHALL BE USED EXCLUSIVELY FOR ACADEMIC PURPOSES (SEE DISCLOSURES AND DISCLAIMERS AT END OF DOCUMENT)
PAGE 6/32
Table 3: Sensitivity Analisys
Price Target (€) Change in WACCs15
-2% -1% 0% 1% 2%
-2% 10,25 7,86 6,09 4,74 3,66
-1% 12,60 9,38 7,14 5,49 4,22
Change in Growth16
0% 16,31 11,59 8,57 6,48 4,93
1% 23,11 15,06 10,64 7,82 5,86
2% 40,64 21,43 13,90 9,76 7,12
Source: analyst estimates
This analysis allows to conclude that our valuation is extremely dependent on the value of the both the discount rate and the perpetuity growth, but also that the price target would be lower than the current price only in 2 out of 25 cases, meaning that possible changes in these variables should not be the cause to revise our recommendation.
Company overview
Company description
Portugal Telecom (PT) is a Portuguese telecommunications operator that provides services in Portugal, Brazil, Africa and Asia. PT’s businesses include fixed telephony, fixed broadband, Pay-TV, data and corporate solutions, mobile telephony and mobile data.
PT was a former Portuguese state-owned company and completed its last privatization phase in 2000. Currently, the company’s presence is spread out through Brazil, Africa and Asia, although Portugal is still its main business. Outside national territory, PT holds several stakes in emerging markets (majorly, Portuguese-speaking countries) and its largest international asset is by far the participation of 25% in the Brazilian Oi. In Africa, PT has a 75% stake in Africatel17 and, in Asia, it holds a 28% stake in CTM (Macao) and a 41,12% stake in Timor Telecom (East Timor). Among its strategic goals, the company has defined a milestone of having at least 2/3 of its revenues from international assets18 and, thus, it is expectable that domestic exposure will continue to
15
We tested for an equal and simultaneous change in both WACCs (Portugal and Brazil). 16
We tested for an equal and simultaneous change in both growth rates. 17
Africatel holds stakes of 25% in Unitel (Angola), 34% in MTC (Namibia), 40% in CVT (Cape Verde) and 51% in CST (São Tomé and Príncipe).
18
PORTUGAL TELECOM COMPANY REPORT
THIS DOCUMENT IS NOT AN INVESTMENT RECOMMENDATION AND SHALL BE USED EXCLUSIVELY FOR ACADEMIC PURPOSES (SEE DISCLOSURES AND DISCLAIMERS AT END OF DOCUMENT)
PAGE 7/32
reduce, in relative terms. PT is listed in the Euronext Lisbon and in the New York Stock Exchange.
Shareholder structure
PT’s main shareholders are: Espirito Santo Group (with 11,35% of total capital), RS Holding (10,05%), Capital Research and Management (10,03%), Telemar Norte Leste (7,00%), Caixa Geral de Depósitos Group (6,26%), Brandes Investment Partners (5,24%), UBS AG (5,05%) and Norges Bank (5,00%). Recently, in July 2011, it was approved the end of the so called “golden shares” that enabled the Portuguese government to veto strategic decisions of the company. The Portuguese state has now an indirect influence through the stake of Caixa Geral Depósitos, a state-owned bank.
Business Description
Portugal - Wireline
During the last few years, the dynamics of the wireline market changed significantly. After the spin-off of PT Multimedia (that afterwards adopted the name of ZON Multimedia), in November 2007, PT lost its cable TV business and its dominant position in the fixed broadband segment (with market share declining from 70,6% in 2006 to 40,3% in 2007). The company’s response was the creation of triple-play bundles (under the Meo brand) that, supported by the launch of a strong and innovative TV service and taking advantage of the broadband growing business, rapidly started challenging ZON’s leadership in Pay-TV. In fact, this strategy allowed the company to become the second largest pay-tv operator but also, on the back of Meo’s success, to minimize the declining trend of the fixed telephone business. The current Portuguese economic crisis is specially affecting the enterprise sector, with data and corporate revenues facing steady declines in the last quarters (see graph 3) but it should also slowdown the uptake of high-end services.
-20,0% -15,0% -10,0% -5,0% 0,0% 5,0% 10,0%
1Q 10
2Q 10
3Q 10
4Q 10
1Q 11
2Q 11
3Q 11
Retail Wholesale Data & corporate
Graph 3: Wireline Revenues by segment, YoY growth
PORTUGAL TELECOM COMPANY REPORT
THIS DOCUMENT IS NOT AN INVESTMENT RECOMMENDATION AND SHALL BE USED EXCLUSIVELY FOR ACADEMIC PURPOSES (SEE DISCLOSURES AND DISCLAIMERS AT END OF DOCUMENT)
PAGE 8/32
Although PT does not report separately the percentages of multiple play bundles vs. single-play offers, we performed our forecasts taking into account the inevitable connection that there is between the growth of fixed line accesses, fixed broadband access and TV costumers. As referred initially, since Meo´s launch, fixed line loss has been minimized as a consequence of TV and broadband growth and the rise of triple-play packages (see table 4).We believe that the fixed-mobile substitution effect will continue to be minimized by the growth of triple-play but we still expect negative growth in the fixed telephony service for the forthcoming years. Another issue that we will develop further on is the impressive growth of mobile data though we believe that, in this case, such event will not cannibalize fixed broadband revenues in short-term.
Meo Triple play and Pay-TV evolution
Meo TV has been clearly the business where PT has focused more efforts over the last years, as a platform for the triple-play’s success. The results of this strategy have been very positive and we believe that the most relevant reasons behind its comparative success (against ZON) have been the product’s differentiation and the brand’s recognition (that is also connected with the first one). Portugal Telecom invested heavily in the deployment of Meo and this has allowed Meo to become a leader in innovation, by being a first mover in the introduction of several new applications and premium services. Meo’s innovations include Video-on-Demand (VoD) service, catch-up TV, remote recording, multi-room PVR20, gaming, karaoke, and several other interactive applications. Additionally, Meo is one of the most recognized brands in Portugal21, as a result of a strong investment in promoting the brand’s image as well a consequence of its product quality. Since Meo’s launch, PT’s market share in pay-TV has grown from 0% to 33.2% in Q3 2011, with positive growth in all quarters (see graph 4).
19
Public Switched Telephone Network / Integrated Services Digital Network. Total fixed telephone lines. 20
Personal Video Recorder 21
Meo was elected “brand of 2008” by the Portuguese specialized magazine ”Meios & Publicidade” and, in December
2011, was elected the “best domestic brand of 2011” by “Exame Informática”
2006 2007 2008 2009 2010 3Q 2011 PSTN/ISDN19 (K) 3.317 3.010 2.828 2.746 2695,4 2.662
yoy -9% -6% -3% -2% -1%
PORTUGAL TELECOM COMPANY REPORT
THIS DOCUMENT IS NOT AN INVESTMENT RECOMMENDATION AND SHALL BE USED EXCLUSIVELY FOR ACADEMIC PURPOSES (SEE DISCLOSURES AND DISCLAIMERS AT END OF DOCUMENT)
PAGE 9/32 Graph 4: PT’s growth in the pay-TV market
Source: ICP-Anacom
The number of total subscriptions in the Portuguese pay-TV market has also been climbing throughout the years and Portugal currently has one of the highest penetration rates in Europe (50.3%22), despite the adverse macro conditions of the country. With the spin-off of PT Multimedia, the competition in this market increased significantly and this may explain the high penetration of this service. In Portugal, the number of subscriptions in the pay-TV market is led by ZON (with a market share of 54.9%23), followed by PT (33.2%) and Cabovisão (8.8%). Optimus and Vodafone have also launched TV services though still with negligible market shares (1.2% and 0.9%, respectively).
The Portuguese economic crisis is affecting the telecom sector as a whole but the major downturn is expected to occur in the wireless segment. In the wireline segment, this influence is more evident in the enterprise business rather than in the residential business and, taking into account that, in Q3 2011, 93% of TV costumers were residential, the prospects for the pay-TV growth and the increase in the uptake of triple-play bundles are still relatively positive. We expect that in the next few years the penetration rate of Pay-TV will increase (53% in Q4 2012 and 60% in Q4 2016), with a gradual deceleration, stabilizing in a rate of 66% in Q4 2021.
Table 5: Forecasted pay-TV penetration rates in Portugal
2011 2012 2013 2014 2015 2016 2017 2018 2019 2020 2021
50,8% 52,8% 54,8% 56,8% 58,8% 60,3% 61,8% 63,3% 64,3% 65,3% 66,3% Source: analyst estimates; unit: TV subscribers as a percentage of total dwellings
22
As a percentage of total conventional dwellings, as of September 2011; Source: ICP-Anacom, INE (statistics Portugal) 23
Source: ICP-Anacom
0,0% 20,0% 40,0% 60,0% 80,0%
2Q08 3Q08 4Q08 1Q09 2Q09 3Q09 4Q09 1Q10 2Q10 3Q10 4Q10 1Q11 2Q11 3Q11
Zon
PT
Cabovisão
PORTUGAL TELECOM COMPANY REPORT
THIS DOCUMENT IS NOT AN INVESTMENT RECOMMENDATION AND SHALL BE USED EXCLUSIVELY FOR ACADEMIC PURPOSES (SEE DISCLOSURES AND DISCLAIMERS AT END OF DOCUMENT)
PAGE 10/32
Nevertheless, the distribution of subscriptions among the operators carries greater uncertainty in our estimates. We believe that, so far PT has been able to strengthening its service against its main pay-TV rivals, but over the last year ZON has made a significant progression in the quality of its product and, since the end of 2010, the offers of the two main rivals are more similar. When analysing both offers, we looked not only for the quality of the TV service but also to the quality of broadband since, we are confident that this two services will be the most important factors explaining the uptake of each triple-play offer and we believe that most of TV subscriptions are (and will be) part of a triple-play bundle. As referred before, PT and ZON’s triple play offers are now quite similar in terms of the available TV experience (quality of the software, image and sound quality, delivered contents) as well as in terms of the quality of its internet service, given the current demand. Both brands state that they provide the best service which may indicate the gap between the two offers is really narrow and there is now less scope for differentiation. Notwithstanding this, PT has continued to gain market share in pay-TV, also as a consequence of its strong promotion of Meo, with a proved brand recognition, well ahead of its competitors.
Besides this, the offers are relatively similar in prices. The companies’ pricing strategies have moved together throughout the time, with a slight downward pressure from ZON and PT responding normally by matching prices. Recent trends indicate that the pressure have now decreased with both companies increasing triple-play prices (in spite of this, our expectations for future pricing pressure are different).
One other important factor that we must not disregard is the possible rise of a third competitor that would realistically challenge PT and ZON’s supremacy. We believe that it is possible that, in some years, Vodafone and Optimus (the second and the third largest mobile operators) may concentrate more attentions in the deployment of their TV and broadband networks and, using their mobile subscribers as a base, can experience significant growth in this area. We are especially concerned with the case of Vodafone that has invested in a high speed network (fibre) and with a client base of more than 6 million customers may represent a real threat and increase competition in this market.
PORTUGAL TELECOM COMPANY REPORT
THIS DOCUMENT IS NOT AN INVESTMENT RECOMMENDATION AND SHALL BE USED EXCLUSIVELY FOR ACADEMIC PURPOSES (SEE DISCLOSURES AND DISCLAIMERS AT END OF DOCUMENT)
PAGE 11/32
next years. We forecast a market share for PT (in pay-TV) of 34% in Q4 2011, 37% in Q4 2012, 41% in Q4 2015 and 43% in Q4 2021.
Table 6: Forecasted market shares of the main players of the pay-TV market in Portugal
2011 2012 2013 2014 2015 2016 2017 2018 2019 2020 2021
PT 34% 37% 39% 40% 41% 42% 42% 42% 43% 43% 43%
ZON 54% 51% 49% 48% 47% 46% 45% 43% 41% 40% 39%
Cabovisão 9% 8% 7% 7% 6% 6% 5% 5% 4% 4% 3%
Others 3% 4% 5% 5% 6% 6% 8% 10% 12% 13% 15%
Source: analyst estimates; unit: TV subscribers as a percentage total TV subscribers
Regarding the revenues per subscription, our view is not so positive. If on the one hand, we expect that costumers will demand internet with higher speeds and TV with better quality, on the other hand, the macro conditions will induce consumers to make this transition slowly and we believe that pricing of high-end services will adjust to the recession as a way of achieving a rapid monetization of the heavy investment in fibre. The ARPU24 of Meo triple-play is being positively impacted by the creation of premium services such as its VoD catalogue (that, in Q4 2010, had already been used by 55% of Meo’s total costumers, with an average) paid in one-time fees, but growth in such services’ usage in not expected to occur in the short term due to the current economic environment and people’s perception of this services as a discretionary expense. This said, and joining the mentioned fact of an increase in competition, we expect ARPUs to keep constant in the short-term (even considering the upgrade of the services).
The Evolution of Broadband Subscribers
Besides PT’s strong efforts to develop its TV service, the company is confident that the growing broadband market will also help increasing the uptake of triple-play packages. PT has been increasing its subscriber base, not only due to the increase in its market share (that was 48.5%, as of Q3 201125) but also to the growth of the overall Portuguese broadband accesses. Demand for internet has been in fact increasing in the majority of the countries, not only in quantity but also in quality.
Global internet usage has been growing steadily over the last years26, even during the financial crisis, and Portugal is no exception. In September 2005, fixed broadband costumers in Portugal were 925,000, 3 years later in September 2008
24
Average Revenue per User 25
ICP-Anacom
26According to Cisco’s Visual Networking index
PORTUGAL TELECOM COMPANY REPORT
THIS DOCUMENT IS NOT AN INVESTMENT RECOMMENDATION AND SHALL BE USED EXCLUSIVELY FOR ACADEMIC PURPOSES (SEE DISCLOSURES AND DISCLAIMERS AT END OF DOCUMENT)
PAGE 12/32
this number increased to 1,553,000 and recently in September 2011, there were already 2,169,000 costumers27. These values mean an increase of 137% in total fixed broadband costumers during six years. More recently, the number of fixed broadband costumers, as of September 2011, had a YoY growth of 7.0%, which confirming the current growing nature of this market (in terms of subscriptions). Despite recent growth, Portugal is still in the laggard of Europe. As of July 2011, Portugal’s fixed broadband penetration rate was 20.9% (as a percentage of total inhabitants), corresponding to the seventh lowest rate in the European Union. This factor may indicate that there is still a lot of room to grow during the next years.
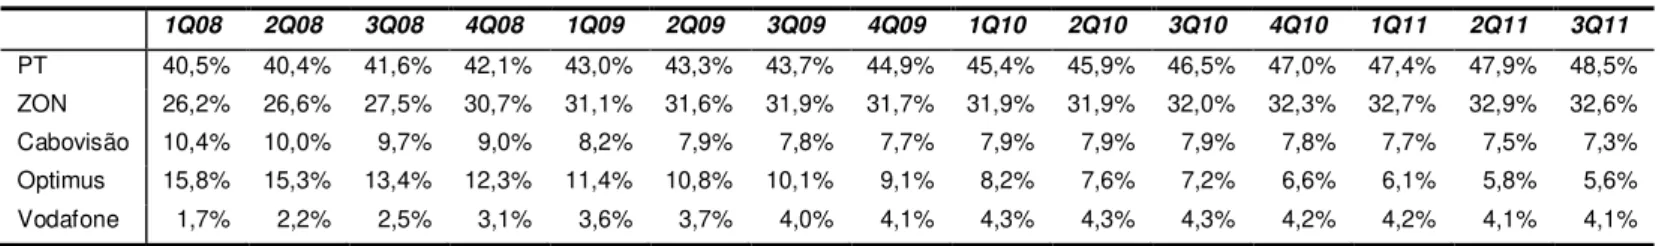
Unsurprisingly, in Portugal, the fixed broadband market is also dominated by the two largest players in pay-TV: PT and ZON. Contrary to the pay-TV market, PT leads this market with a share of 48.5% against ZON’s share of 32.6%.
Table 7: Fixed broadband market share in Portugal
1Q08 2Q08 3Q08 4Q08 1Q09 2Q09 3Q09 4Q09 1Q10 2Q10 3Q10 4Q10 1Q11 2Q11 3Q11
PT 40,5% 40,4% 41,6% 42,1% 43,0% 43,3% 43,7% 44,9% 45,4% 45,9% 46,5% 47,0% 47,4% 47,9% 48,5% ZON 26,2% 26,6% 27,5% 30,7% 31,1% 31,6% 31,9% 31,7% 31,9% 31,9% 32,0% 32,3% 32,7% 32,9% 32,6% Cabovisão 10,4% 10,0% 9,7% 9,0% 8,2% 7,9% 7,8% 7,7% 7,9% 7,9% 7,9% 7,8% 7,7% 7,5% 7,3% Optimus 15,8% 15,3% 13,4% 12,3% 11,4% 10,8% 10,1% 9,1% 8,2% 7,6% 7,2% 6,6% 6,1% 5,8% 5,6% Vodafone 1,7% 2,2% 2,5% 3,1% 3,6% 3,7% 4,0% 4,1% 4,3% 4,3% 4,3% 4,2% 4,2% 4,1% 4,1%
Source: ICP-Anacom
Together with the growth in the overall market, PT’s market share has also been increasing, partially, we believe, due to the success of pay-TV. Over the last years, PT’s broadband subscriber base has been growing consistently (with a YoY growth rate of 21% in 2009, 16% in 2010 and 11% in Q3 2011). In September of 2011, 71% of the total revenues of fixed broadband service in Portugal were already generated from triple-play bundles and we are confident that this percentage will increase in future. Thus, our forecasts for the increase in the subscriber base of PT are intimately connected with the evolution estimated in pay-TV.
27
PORTUGAL TELECOM COMPANY REPORT
THIS DOCUMENT IS NOT AN INVESTMENT RECOMMENDATION AND SHALL BE USED EXCLUSIVELY FOR ACADEMIC PURPOSES (SEE DISCLOSURES AND DISCLAIMERS AT END OF DOCUMENT)
PAGE 13/32 14,2
29,7 93,1
2,5 2,7
60,0
0,00 20,00 40,00 60,00 80,00 100,00
DSL Cable FTTx
(Mbit/s) Average download speeds
Average upload speeds
A Remarkable Investment in Fiber Rollout
PT has made an impressive investment in the rollout of optical fiber28. Its management believes that the investment in this next generation access (NGA) network will enable the company to support the increasing needs of multiple-play services that will require, they say, for instance, an amount of bandwidth that is unbearable with its current ADSL29 network. Fiber is in fact perceived by the experts as the most future proof technology. Worldwide telecoms have invested heavily in this NGA and available top offers are now supported by fiber (see graph 5).
PT’s most active network is still ADSL and this type of connection is less capable than ZON’s cable network. A viable IPTV service, together with a fast-speed broadband and a voice service, requires a bandwidth that cable may provide in better conditions than ADSL. As a response, PT invested in fiber-to-the-home (FTTH) that has a greater capacity and reliability than ADSL. PT claims that with FTTH it will be able to deliver a more robust TV service with a wide range of channels, video services across multiple platforms (TV, PC and mobile). There are some advantages of the usage of optical fiber against cooper for PT. It should reduce the required costumer support and the repair rate. Regulation released by Anacom (the Portuguese telecommunications regulator) for NGAs is also in favor of this investment as it will not force PT to provide wholesale services in urban areas with decent competition30. Accordingly, PT’s planned fiber coverage will be, at least for now, focused in urban areas. After having passed 1M houses in 2010, PT plans to have 1.6M houses passed with fiber by the end of 2011. It is important to notice that out of the total 1M passed houses in the end of 2010, only 13.8% of those houses had activated their fiber network. But, more important than possible cost reductions, is that the company believes it has transformed what once was a competitive disadvantage into a competitive advantage. PT points out that FTTH can provide superior speeds than DOCSIS331, explaining that on average it delivers 98% of the contracted speed versus cable’s 58%). ZON’s fiber was created using its DOCSIS3 network and required a much lower investment than PT’s investment, but ZON’s fiber is Fiber
28
Wireline capex, as reported by the company, have been growing in the last years, accounting for 21% of revenues in 2008, 27% in 2009 and 27% in 2010, mainly due to this investment.
29
Asymmetric Digital Subscriber Line
30Notwithstanding this, in November 2011, Vodafone and Optimus have shown interest in the using PT’s fiber network, advocating that it would increase competition in the segment.
31
DOCSIS stands for Data-Over-Cable-Service-Interface-Specification, DOCSIS3 is the latest NGA of cable. Graph 5: Average advertised
download and upload speeds, Sep 2010, OECD countries
PORTUGAL TELECOM COMPANY REPORT
THIS DOCUMENT IS NOT AN INVESTMENT RECOMMENDATION AND SHALL BE USED EXCLUSIVELY FOR ACADEMIC PURPOSES (SEE DISCLOSURES AND DISCLAIMERS AT END OF DOCUMENT)
PAGE 14/32
To-The-Building (FTTB) and PT’s is Fibre-To-The-Home. In general, FTTB should provide lower signal stability since that, due to its higher distance to the end-user, it requires the spread of the signal throughout the different houses of the building. In this sense, there is no doubt that Meo’s offer surpasses ZON’s. But this difference does not implicitly mean that PT will gain market share from ZON. It will depend on how demand for high-speed internet and high quality TV will evolve and how consumers perceive the difference in quality among the two offers. Cisco’s forecasts (see graph 6) suggest that, from 2011 to 2014, global internet traffic will more than double. This belief is supported under the possibility of growth multi-screen TV with more objects connected in real-time to the same network, 3DTV, 3G/4G32 mobile devices, “cloud computing”, electronic commerce, social networking, among others. Another important factor is the rise in the demand for upload speeds, rather than only download speeds, that call for better access networks.
Graph 6: Forecast of Global Internet traffic consumption per service
Unit: Exabyte per month; Source: Cisco VNI, February 2011
In line with the estimated increase in internet traffic, specialists expect that networks will have to hold greater capacities, meaning a greater bandwidth33.
32
Refers to the latest network technology-Third and Fourth generation. 33
PORTUGAL TELECOM COMPANY REPORT
THIS DOCUMENT IS NOT AN INVESTMENT RECOMMENDATION AND SHALL BE USED EXCLUSIVELY FOR ACADEMIC PURPOSES (SEE DISCLOSURES AND DISCLAIMERS AT END OF DOCUMENT)
PAGE 15/32
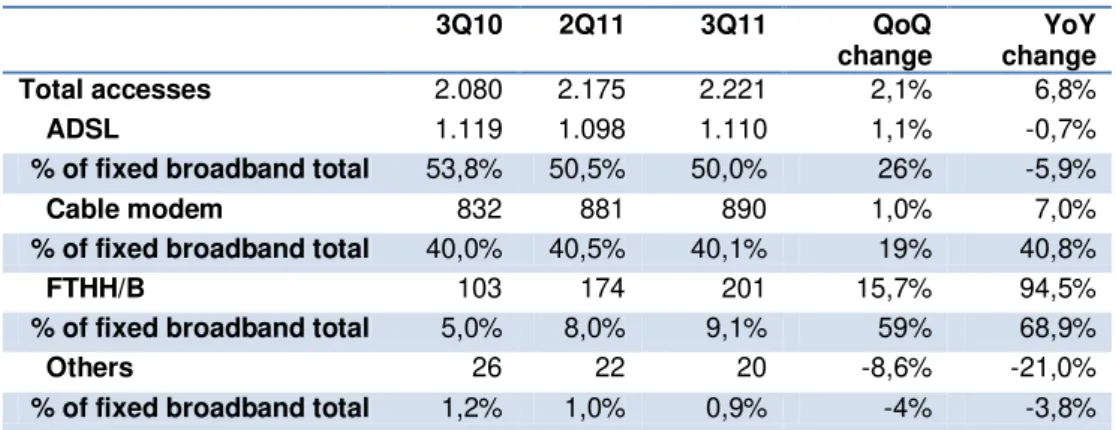
There is no doubt that the momentum is now with fiber in Portugal. Although it only represents 9,1% of total fixed broadband accesses (as of September 2011), from Q2 to Q3 2011, 59% of total fixed broadband additions were made through fiber (see table 8). PT has made a strong investment also in the advertising and promotion of its FTTH network and we are confident that the great majority of fiber additions occurred in PT’s fiber network. But, this does not mean that the investment in fiber is already monetizing.
Table 8: Trend in the number of fixed broadband accesses
3Q10 2Q11 3Q11 QoQ
change
YoY change
Total accesses 2.080 2.175 2.221 2,1% 6,8%
ADSL 1.119 1.098 1.110 1,1% -0,7%
% of fixed broadband total 53,8% 50,5% 50,0% 26% -5,9%
Cable modem 832 881 890 1,0% 7,0%
% of fixed broadband total 40,0% 40,5% 40,1% 19% 40,8%
FTHH/B 103 174 201 15,7% 94,5%
% of fixed broadband total 5,0% 8,0% 9,1% 59% 68,9%
Others 26 22 20 -8,6% -21,0%
% of fixed broadband total 1,2% 1,0% 0,9% -4% -3,8%
Source: ICP-Anacom
Currently, PT´s Fiber and ADSL packages have the same price for identical broadband speed34 and, thus, it is expectable that new customers will purchase the first package if the service is available in the area. Still, it is in the top offers (i.e. with faster speeds, multi-screen, and other functionalities such as restart TV35) that there is potential to increase ARPU and, regarding this, some considerations must be done.
Although, triple-play growth has shown resilience to the current macro downturn, we strongly believe that high-end services are being and will be penalized. Actually, in its 3Q release, PT noticed that there was pressure under its value added services, such as premium and thematic channels and video on demand. In this sense, the adverse macro conditions and people’s appreciation of price/speed may represent a drawback against the increase in the uptake of upgraded multiple-play services and monetization of the heavy investment in fiber.
PT’s strategy of setting equal prices for similar ADSL and FTTH packages may also represent a sign of the company’s awareness towards this concern. On the
34€55.49/month for
50 Mbps. 35
PORTUGAL TELECOM COMPANY REPORT
THIS DOCUMENT IS NOT AN INVESTMENT RECOMMENDATION AND SHALL BE USED EXCLUSIVELY FOR ACADEMIC PURPOSES (SEE DISCLOSURES AND DISCLAIMERS AT END OF DOCUMENT)
PAGE 16/32
positive side of the balance, we recognize that PT’s efforts to attract customers have been showing impressive results. Besides a strong marketing campaign, the company has also launched a broad range of products in its TV service in order to increase costumers’ willingness to pay for a higher quality of the provided TV experience.
PT’s investment in FTTH has probably enabled the company to match his broadband offer with the increased demand requirements and not to lose market share for ZON (as it would have happened if PT would have kept its ADSL network with no further investments). However, we do not foresee that in short term significant market share gains will happen for PT due to its FTTH investment, as ZON’s competing offer is still sufficiently good to compete against PT’s fiber, given the current demand of broadband speeds and data.
Bottom line, PT’s investment has probably produced the best offer available in the market but it is difficult to conclude if the investment was not made too soon. Current macro downturn is decreasing costumers’ willingness to upgrade services on the cost of an increased price. Although FTTH’s share of total accesses should continue to increase, we believe that on the short term no effects will be seen in either increase in the ARPU or in the market share PT related to this investment. Nevertheless, PT’s FTTH should yield positive benefits in the medium to long term, when demand for bandwidth will imply the usage of this network at its top speeds.
Entrerprise Segment and Wholesale
PORTUGAL TELECOM COMPANY REPORT
THIS DOCUMENT IS NOT AN INVESTMENT RECOMMENDATION AND SHALL BE USED EXCLUSIVELY FOR ACADEMIC PURPOSES (SEE DISCLOSURES AND DISCLAIMERS AT END OF DOCUMENT)
PAGE 17/32
Wireline Forecasts
Table 9: Wireline – Operating Data Forecasts
In thousands 2010 2011 E 2012 E 2013 E 2014 E 2016 E 2018 E 2021 E
Retail accesses 4.526 4.749 4.862 5.043 5.178 5.407 5.579 5.759
yoy36 8% 5% 2% 4% 3% 2% 1% 1%
PSTN/ISDN 2695,4 2652 2617 2587 2567 2531 2498 2452
yoy -2% -2% -3% -1% -1% -1% -1% -1%
Fixed Broadband 1.001 1.104 1.123 1.228 1.306 1.438 1.541 1.654
yoy 16% 10% 2% 9% 6% 4% 3% 2%
TV customers 830 993 1.123 1.228 1.306 1.438 1.541 1.654
yoy 43% 20% 13% 9% 6% 4% 3% 2%
Wholesale accesses 355,9 305,2 277,1 260,5 252,6 247,6 247,6 247,6
yoy -11% -14% -9% -6% -3% -1% 0% 0%
Source: analyst estimates, company reports
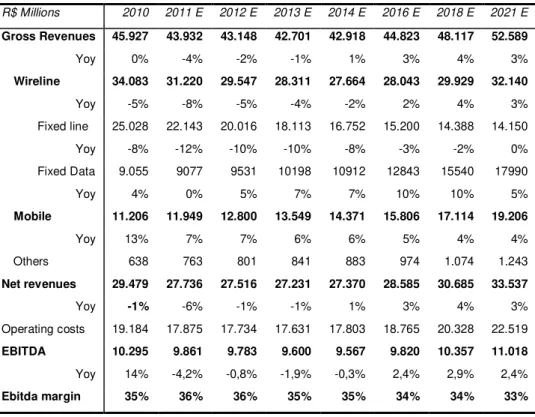
Table 10: Wireline – Financial Data Forecasts
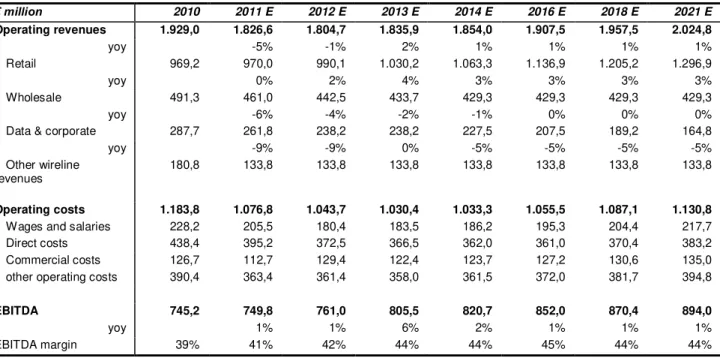
€ million 2010 2011 E 2012 E 2013 E 2014 E 2016 E 2018 E 2021 E
Operating revenues 1.929,0 1.826,6 1.804,7 1.835,9 1.854,0 1.907,5 1.957,5 2.024,8
yoy -5% -1% 2% 1% 1% 1% 1%
Retail 969,2 970,0 990,1 1.030,2 1.063,3 1.136,9 1.205,2 1.296,9
yoy 0% 2% 4% 3% 3% 3% 3%
Wholesale 491,3 461,0 442,5 433,7 429,3 429,3 429,3 429,3
yoy -6% -4% -2% -1% 0% 0% 0%
Data & corporate 287,7 261,8 238,2 238,2 227,5 207,5 189,2 164,8
yoy -9% -9% 0% -5% -5% -5% -5%
Other wireline revenues
180,8 133,8 133,8 133,8 133,8 133,8 133,8 133,8
Operating costs 1.183,8 1.076,8 1.043,7 1.030,4 1.033,3 1.055,5 1.087,1 1.130,8
Wages and salaries 228,2 205,5 180,4 183,5 186,2 195,3 204,4 217,7
Direct costs 438,4 395,2 372,5 366,5 362,0 361,0 370,4 383,2
Commercial costs 126,7 112,7 129,4 122,4 123,7 127,2 130,6 135,0
other operating costs 390,4 363,4 361,4 358,0 361,5 372,0 381,7 394,8
EBITDA 745,2 749,8 761,0 805,5 820,7 852,0 870,4 894,0
yoy 1% 1% 6% 2% 1% 1% 1%
EBITDA margin 39% 41% 42% 44% 44% 45% 44% 44%
Source: analyst estimates, company reports
Portugal
–
Mobile
PT is present in the Portuguese mobile market with the TMN brand. TMN is the market leader, followed by Vodafone and the later entrant Optimus (Sonaecom). Over the last few quarters, mobile operators have been struggling to sustain revenues, mainly due to, in our opinion, the macro downturn of the economy, the on-going cuts in the mobile termination rates (MTRs) and the increasing
36
PORTUGAL TELECOM COMPANY REPORT
THIS DOCUMENT IS NOT AN INVESTMENT RECOMMENDATION AND SHALL BE USED EXCLUSIVELY FOR ACADEMIC PURPOSES (SEE DISCLOSURES AND DISCLAIMERS AT END OF DOCUMENT)
PAGE 18/32
popularity of tribal plans. On the other side, a positive aspect is the rapid growth of mobile data revenues that we expect to be the main source of growth of this market in the near future. Combining the referred growth of mobile data with the expected evolution in the mobile market sophistication, major operators are investing in the deployment of its networks, through the introduction of LTE37, the latest NGA, to provide higher capacity and increase speed and quality to their offers.
Evolution of the Mobile Market in Portugal
The Portuguese mobile market has been struggling over the last quarters and revenues of the main players have been declining. We believe that the effect of the crisis will be (and is being) stronger in the mobile market than in the wireline market. Under this belief, we consider that the macro downturn is pressuring mobile costumers to downgrade their tariff plans and decrease usage of high-end services, pushing down ARPUs. An example of this has been the tremendous success of tribal-plans. Historically, in Portugal, the amount pre-paid plans as a percentage of total plans have been quite high38 and, among this percentage, there has been a significant downgrading of regular tariff plans to tribal plans. Moreover, it is important to point out that total mobile stations as a percentage of population in Portugal are among the highest in Europe39, with a penetration rate of 156.3% (of total inhabitants), as of Q3 11, and this may imply that there will be less room to grow in terms of accesses in future.
Tribal plans and Pricing Competition
Since its entrance, in 1997, Optimus has been targeting preferentially the youth sector and has intensified competition in prices. Unsurprisingly, the same operator was the pioneer of the tribal plans in 2008. Such plans enabled, customers, in exchange for a fixed monthly fee, to perform on-net calls and text messages free of charge, and rapidly became a success among Optimus costumers, though its impact on market share was minor. Throughout the past decade, TMN and Vodafone have generally managed not to react to Optimus pressure on prices (though TMN usually reacts to Vodafone’s downward moves in prices) but, on the back of Optimus’ success, Vodafone decided to launch its own tribal plan. As a consequence, and besides having considered its
37
Long Term Evolution, classified as a 4G network. 38
76% in 2008, 70% in 2009, 73% in 2010; Source: ICP- Anacom 39
PORTUGAL TELECOM COMPANY REPORT
THIS DOCUMENT IS NOT AN INVESTMENT RECOMMENDATION AND SHALL BE USED EXCLUSIVELY FOR ACADEMIC PURPOSES (SEE DISCLOSURES AND DISCLAIMERS AT END OF DOCUMENT)
PAGE 19/32
competitors pricing as irrational, TMN saw no other possibility than following their strategy. One distinctive feature of these plans was the possibility, in the case of Optimus, to spend the charged monthly fee as credit for other services whereas this was not possible for the other competitors’ plans. In 2010, with the increasing popularity of Optimus’ tribal plans, Vodafone would eventually match their offer and TMN, once again, would soon take the same step.
More recently, in Q4 2010, the fixed fees of the three operators have raised, meaning possibly a sign of a slowdown in Optimus’ pricing pressure, which is positive for the overall market. Still, we believe that the penetration of tribal plans is will be higher in future and free of charge calls and text messages should remain a real feature in these plans for the long term.
As referred above, Portugal has an extraordinary number of pre-paid plans as a percentage of total plans40. Adding the increasing penetration of tribal plans across the pre-paid base, this represents a major concern for operators. Pre-pay costumers have to pay a fixed fee in advance which allows them to more easily control their expenditures. In contrast, post-pay costumers usually sign long term contracts with operators, with minimum monthly bills and may have no cap on the level of expenditures.
Regulation and Competition
In Portugal, mobile market shares have remained remarkably constant throughout the last decade and the market has been dominated by three main players. TMN and Vodafone have to keep their leading positions in terms of subscribers despite Optimus efforts to invert the situation. As of September 2011, TMN had a market share of 43.7%, Vodafone’s share was 39.1% and Optimus’ shares 15.7%, with the remaining shares belonging ZON and CTT (with 1.1% and 0.4%, respectively).
Probably the most important reason explaining this phenomenon of a highly concentrated market with almost stagnation of market shares is the existing barriers for a consumer’s switch of network. As a result of a large gap between on-net and off-net prices (offers for on-net services are almost always cheaper), people tend to prefer to belong to the same network of their friends and family in order to take advantage of on-net discounts.
40
PORTUGAL TELECOM COMPANY REPORT
THIS DOCUMENT IS NOT AN INVESTMENT RECOMMENDATION AND SHALL BE USED EXCLUSIVELY FOR ACADEMIC PURPOSES (SEE DISCLOSURES AND DISCLAIMERS AT END OF DOCUMENT)
PAGE 20/32
The telecom regulators are aware of this fact and have started taking measures to boost competition. In May 2009, the European Commission adopted a recommendation on the termination rates’ decrease a way to boost competition and benefit consumers. The target was that by the end of 2012, except for exceptional circumstances, national termination rates (fixed and mobile) should equal to the cost of an efficient operator to for “terminating” calls on its network so that operators may charge fair prices to consumers.
The effects of this recommendation are being felt across Europe and the Portuguese mobile market has already been subject to cuts on its MTRs. MTRs have gradually fallen from more than 0.06 euros before May 2010 to 0.035 in August this year. As a result, TMN interconnection revenues (being the largest operator, interconnection revenues are higher than interconnection costs) have been falling sharply with a YoY decrease of 34.5% in Q3 2011, accounting for 38% of TMN’s total loss on service revenues over the same period (see graph 7). And the cuts are expected to continue. Anacom has suggested a further decrease in MTRs, projecting cuts up to an MTR of 0.0125 in November 2012. Regarding this subject, our vision is less optimistic of this proposal’s success and we forecast that these cuts will be gradually spread across a longer period due to the current difficulties mobile operators are facing (see graph 8).
There is considerable discussion on the issue of MTRs’ long term effects in competition. In Portugal, the concentration of the mobile market is especially high and there is a strong presence of the network effect. In other words, the benefits that a user extracts for using a given network will depend on the number of total users in the network. This happens because, as referred before, there is a significant gap between on-net and off-net prices. To take advantage from its large subscriber base, the largest operators will typically set high prices for off-net calls in order to retain and attract subscribers to its off-network. Since the introduction of cuts on MTRs by Anacom, this dynamics have slightly changed and minor operators are pressuring the main operators to decrease off-net prices41. This is the effect that Anacom is pursuing in order to benefit consumers but we believe that the Portuguese operator will also have to balance the consumers’ welfare with the efficiency of mobile operators. In this sense, our MTRs’ forecasts reflect our consideration that the current Anacom proposal is too harmful for the operators’ short term efficiency. Besides this, we do not believe
41
For instance, in 2011, a Mobile Virtual Network Operator (MVNO) launched a tariff plan with a price for off-net calls of €0,08 and this situation eventually forced the three main players to decrease their off-net prices of €0,12 to €0,08 in their low-cost tariff plans.
0,0 20,0 40,0 60,0 80,0
1Q08 3Q08 1Q09 3Q09 1Q10 3Q10 1Q11 3Q11
Graph 7: TMN Interconnection Revenues
Unit: Euro million; source: company reports
0 1 2 3 4 5 6 7
3Q10 1Q11 3Q11 1Q12 3Q12 1Q13 3Q13 1Q14 3Q14
forescasted historical
Graph 8: Average MTR per quarter
PORTUGAL TELECOM COMPANY REPORT
THIS DOCUMENT IS NOT AN INVESTMENT RECOMMENDATION AND SHALL BE USED EXCLUSIVELY FOR ACADEMIC PURPOSES (SEE DISCLOSURES AND DISCLAIMERS AT END OF DOCUMENT)
PAGE 21/32
that there will be a significant change in the distributions of subscribers in the mobile market, though we are confident that ARPUs will continue to be pressured and competition for differentiation may intensify.
Mobile Data
Mobile data has been growing sharply in Europe and Portugal has the 6th highest penetration rate among the European Union42. Graph 9 shows the positive evolution of broadband in Portugal over the last years.
In TMN, data as a percentage of service revenues has grown from 22.8% in Q3 2009 to 25.2% in Q3 2010 and 28.9% in 2011. This is indicator that shows clearly the on-going transformation of TMN’s mobile business but if we compare, for instance with Optimus’ results, we see that data already accounts for 33.0% of service revenues in Q3 2011 (as a possible explanation, we consider its greater exposure to the youth sector). The company has been making significant efforts in order to try to leverage its position in the mobile broadband considering the high potential of this segment. In particular, TMN is trying to increase the smartphone penetration in its subscriber base and has launched its own branded smartphone offers in order to increase not only its costumers’ internet usage as well as other value added services such as mobile TV.
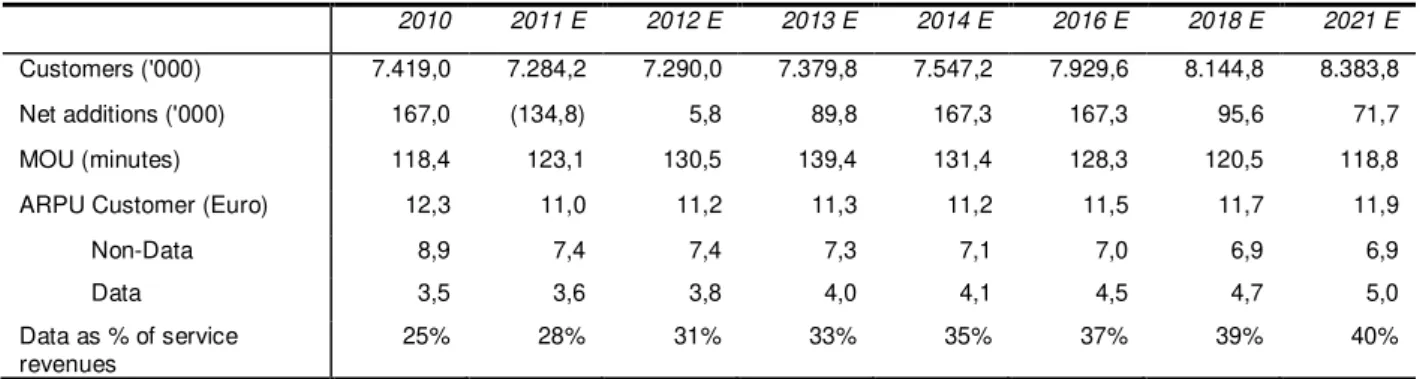
In our opinion, TMN strategy is positive given the potential of mobile broadband services though the expected negative macro conditions can be a concern. If on the one hand, we support that mobile voice is not seen a luxury and thus total subscribers shall not reduce in short term, on the other hand we believe that the upgrade of tariff plans to plans including broadband will be slow and a percentage of costumers shall even downgrade their plans. In any case, we believe that the number of total accesses through mobile phones or laptops or tablets will keep increasing but that the impact of this increase will be moderated in the short term as people will tend to choose cheap broadband tariff plans. In our forecasts, we expect that data revenues weight on total service revenues will keep increasing, representing 30.9% in end of 2012, 37.1% in 2016 and 39.9% in 2020.
LTE and the Spectrum Auction
In November 2011, it took place the auction for the attribution frequency brands in order to enable mobile operators to develop their networks with LTE (Long
42
Source: ICP-Anacom 0
500 1.000 1.500 2.000 2.500 3.000
1Q07 4Q07 3Q08 2Q09 1Q10 4Q10 3Q11
fixed broaband costumers
mobile broadband users (active in period)
Graph 9: Broadband Evolution in Portugal
PORTUGAL TELECOM COMPANY REPORT
THIS DOCUMENT IS NOT AN INVESTMENT RECOMMENDATION AND SHALL BE USED EXCLUSIVELY FOR ACADEMIC PURPOSES (SEE DISCLOSURES AND DISCLAIMERS AT END OF DOCUMENT)
PAGE 22/32
Term Evolution). Before this date, the greatest fear of TMN, Vodafone and Optimus was the possibility of competing against a fourth player. The Portuguese government had decided to open the auction to new entrants though the possibility of a new appearance was considered to be low due to the high build costs associated with the roll out of LTE and also due to the competitive barriers existent in the market. ZON was appointed as one of the main candidates but decided not to move into the auction.
In accordance to what is happening in the wireline, mobile operators also wish to upgrade their wireless networks in order to support increased data demands and deliver higher speed connectivity. LTE is considered to a fourth generation (4G) network as it is expected that it will deliver increased speeds when compared to the HSPA43, a 3.5G network. In fact in the case of 2G and 3G, Portugal experienced a high acceptance of its population to these networks, and the worldwide trends appoint that there has been a strong investment towards the deployment of new NGAs, but it remains to know whether Portuguese costumers’ demand will be sufficiently high to justify this large scale investment at this time. Meo has recently launched the “Meo go!” service, a service already considered as quadruple-play since it enables customers to watch TV in laptops, tablets and smartphones in any place. To support this service, a strong wireless network will be required and is under this reasoning that PT and other mobile operators invested in new NGAs. PT claims that the company’s future strategy will reside on the functional merger of the wireline and wireless business and that its investment in FTTH will make it cheaper to rollout the LTE network and this may represent an advantage to its competitors. In our opinion, in the short to medium term, it will be possible to see a positive influence of Meo’s subscriber base on TMN’s mobile business. Specifically, we believe that, combined with the increasing demand for mobile broadband, Meo’s packages with wireless internet will become common and this will allow TMN to have a competitive advantage towards other mobile operators as, for instance, Vodafone. We include such effect on our estimations for data revenues in the mobile business.
43
PORTUGAL TELECOM COMPANY REPORT
THIS DOCUMENT IS NOT AN INVESTMENT RECOMMENDATION AND SHALL BE USED EXCLUSIVELY FOR ACADEMIC PURPOSES (SEE DISCLOSURES AND DISCLAIMERS AT END OF DOCUMENT)
PAGE 23/32
Mobile Forecasts
Table 11: Mobile
–
Operating Data Forecasts
2010 2011 E 2012 E 2013 E 2014 E 2016 E 2018 E 2021 E
Customers ('000) 7.419,0 7.284,2 7.290,0 7.379,8 7.547,2 7.929,6 8.144,8 8.383,8 Net additions ('000) 167,0 (134,8) 5,8 89,8 167,3 167,3 95,6 71,7
MOU (minutes) 118,4 123,1 130,5 139,4 131,4 128,3 120,5 118,8
ARPU Customer (Euro) 12,3 11,0 11,2 11,3 11,2 11,5 11,7 11,9
Non-Data 8,9 7,4 7,4 7,3 7,1 7,0 6,9 6,9
Data 3,5 3,6 3,8 4,0 4,1 4,5 4,7 5,0
Data as % of service revenues
25% 28% 31% 33% 35% 37% 39% 40%
Source: company reports, analyst estimates
Table 12: Mobile - Financial Data Forecasts
€ million 2010 2011 E 2012 E 2013 E 2014 E 2016 E 2018 E 2021 E
Operating revenues 1387,5 1235,8 1158,6 1158,7 1164,9 1255,4 1307,9 1387,5
yoy -9% -11% -6% 0% 1% 4% 2% 2%
Services rendered 1264,7 1132,8 1065,8 1063,9 1066,6 1142,2 1190,0 1251,0
yoy -7% -10% -6% 0% 0% 4% 2% 2%
Customer 1099,1 1008,7 975,8 1000,4 1017,4 1092,6 1139,5 1199,4
yoy -6% -8% -3% 3% 2% 4% 2% 2%
Interconnection 141,9 98,2 69,5 43,4 29,9 29,9 29,9 29,9
yoy -12% -31% -29% -38% -31% 0% 0% 0%
Roamers 23,7 25,9 20,5 20,0 19,3 19,7 20,5 21,6
yoy -7% 9% -21% -2% -3% 4% 2% 2%
Sales 112,4 92,7 83,1 85,1 88,5 102,8 107,1 125,1
yoy -22% -18% -10% 2% 4% 10% 2% 2%
Other operating revenues 10,4 10,3 9,7 9,7 9,7 10,4 10,8 11,4
Operating costs 749,4 675,0 653,8 664,8 671,9 724,1 755,7 803,0
Wages and salaries 47,6 44,3 40,6 40,6 39,6 42,7 44,5 47,2
Direct costs (i) 246,2 218,2 204,5 212,0 209,7 226,0 236,7 252,5
Commercial costs 230,1 211,3 220,1 223,6 233,0 251,1 261,6 277,5
Supplies and external services and other expenses 225,6 201,1 188,6 188,6 189,6 204,3 212,9 225,8
EBITDA 638,1 560,8 504,8 493,9 493,0 531,3 552,3 584,5
yoy -5% -12% -10% -2% 0% 4% 2% 2%
EBITDA margin 46% 45% 44% 43% 42% 42% 42% 42%
PORTUGAL TELECOM COMPANY REPORT
THIS DOCUMENT IS NOT AN INVESTMENT RECOMMENDATION AND SHALL BE USED EXCLUSIVELY FOR ACADEMIC PURPOSES (SEE DISCLOSURES AND DISCLAIMERS AT END OF DOCUMENT)
PAGE 24/32
Brazil - Oi
Following the sale of PT’s 50% stake in the Brazilian mobile Vivo to Telefónica, in July 2010, for € 7.5bn, PT announced a strategic partnership with Oi, acquiring a 25.3% stake in the Brazilian telecom operator for € 3.6bn. In this sense, PT kept its exposure to the fast-growing Brazilian telecom market. But, whilst Vivo’s
future prospects were very exciting, Oi´s ones present some concerns.
Oi is present in the mobile and in the wireline business, having an exposure significantly greater to the wireline (for instance, in Q3 2011, 70% of its net revenues derived from this business while mobile accounted for 28%; see graph X where wireline includes fixed data and fixed line). The Brazilian fixed-line segment is currently facing substantial difficulties, mainly due to the fixed-to-mobile substitution. Oi aims to surpass this situation by increasing its fixed-to-mobile subscriber base and also through multiple-play offerings using its fixed infrastructure but the competition in the mobile is very intense and its low-income subscriber base may complicate the uptake of such offerings. As an emerging
market, Brazil’s telecom business has one of the fastest growth rates in the world
and, at the same time, is among the most competitive.
Wireline
In the wireline segment, Oi is the market leader, in either the fixed voice or the fixed broadband markets. In the fixed voice market, Oi has a subscriber market share of 45.7%44 (as of June 2011), the second and the third largest operators are Telefónica Brazil and Embratel with market shares of 26.2% and 18.2%, respectively. In the fixed broadband market, Oi holds a market share of 31.1% (as of March 20011) and competes with Net Serviços de Comunicação (25.4%) and Telefónica Brazil (23.3%).
In Brazil, the fixed telecom market operates through the attribution of concessions by regions. Under this legislation, Oi was attributed the concession of regions I and II. On a GDP per capita basis, the wealthiest region is region III (that includes São Paulo, the economic center of the country) and region II is the poorest (see graph 11). This factor increases the difficulty for Oi’s management team to pursue their goal of increasing the uptake in multiple-play offers, at least in the short-term.
44
Source: Anatel Graph 11: The General Concession plan
49%
20% 28%
2% Fixed line
Fixed data
Mobile
Other
Graph 10: Oi’s Revenue Split by Business, Q3 2011
PORTUGAL TELECOM COMPANY REPORT
THIS DOCUMENT IS NOT AN INVESTMENT RECOMMENDATION AND SHALL BE USED EXCLUSIVELY FOR ACADEMIC PURPOSES (SEE DISCLOSURES AND DISCLAIMERS AT END OF DOCUMENT)
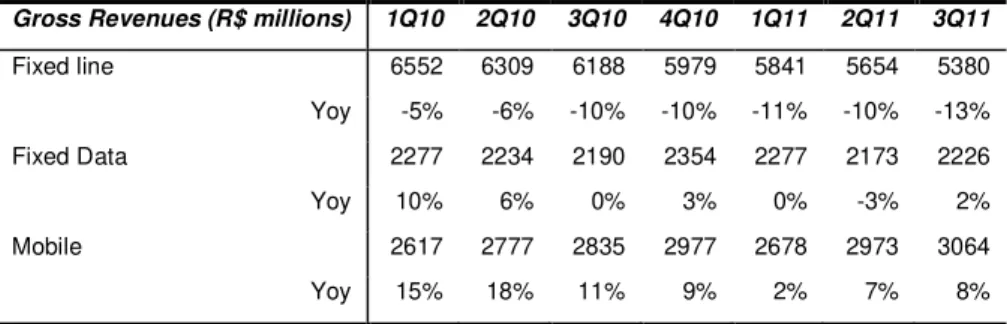
PAGE 25/32 It is in the wireline that Oi’s business has been struggling more, with the strong effect of fixed-mobile substitution and an increased competition resulting in a drop of Oi’s fixed line revenues (see table 13).
Table 13: Revenue Decline in the Fixed Line Business
Gross Revenues (R$ millions) 1Q10 2Q10 3Q10 4Q10 1Q11 2Q11 3Q11
Fixed line 6552 6309 6188 5979 5841 5654 5380
Yoy -5% -6% -10% -10% -11% -10% -13%
Fixed Data 2277 2234 2190 2354 2277 2173 2226
Yoy 10% 6% 0% 3% 0% -3% 2%
Mobile 2617 2777 2835 2977 2678 2973 3064
Yoy 15% 18% 11% 9% 2% 7% 8%
Source: company reports
Table 14 illustrates the substantial line loss that has taken place over the last years. With an exceptionally high mobile penetration rate, we do not expect that Oi will manage to revert the declining trend of fixed line in the forthcoming years. Table 14: Line loss in the wireline business
Wireline "Oi Fixo" 2Q09 3Q09 4Q09 1Q10 2Q10 3Q10 4Q10 1Q11 2Q11 3Q11
Lines in Service (K) 21753 21442 21293 21085 20759 20410 20025 19747 19400 19078
Net adds -73 -311 -149 -208 -326 -349 -385 -278 -347 -322
Source: Company data
Oi is planning on offering multiple-play package in order to retain its subscriber base in the wireline. We recognize that Oi has a competitive advantage in this strategy: it holds a diversified portfolio that includes fixed voice, mobile, broadband and pay-TV services as well as an extensive fixed infrastructure and this may enable the company to compete with, for instance, mobile-only operators. Still, there are some challenges in this strategy.
PORTUGAL TELECOM COMPANY REPORT
THIS DOCUMENT IS NOT AN INVESTMENT RECOMMENDATION AND SHALL BE USED EXCLUSIVELY FOR ACADEMIC PURPOSES (SEE DISCLOSURES AND DISCLAIMERS AT END OF DOCUMENT)
PAGE 26/32
substitute due to the higher capacity and velocity that currently fixed connections provide and to the expected increase in demand for data in Brazil. So far, under the “Oi Velox” brand, the company offers ADSL services to approximately 4600 cities in Brazil and intends to cover all the cities of the country till the end of 1Q 2012. Fixed broadband revenues have been growing in the last quarters and we expect this trend to continue in the near future.
As referred above, Oi is also present in the pay-TV market. Just as broadband, the pay-TV has also a long way to go in Brazil. In June 2011, its penetration rate was 19% (as a percentage of total households) and in 2010, Brazil saw an increase of 30.7% in its total subscribers. Oi’s presence in this market is still particularly reduced with a market share of 3% (as of June 2011). The main rivals are Net Serviços Comunicação, Sky, Embratel and Telefónica Brazil with market shares of 39.8%, 28.8%, 13.9%, 6.1%, respectively.
Oi’s pay-TV service is currently undertaking some significant developments. After obtaining a DTH nationwide license in 2008, Oi now covers 18 states and intends to cover the entire country by the end of 2011. The company is offering this service at entrance prices that are approximately a half of Net Serviços de Comunicação’s cheapest service. This service is growing significantly and in 3Q 2011, pay-TV costumers increased by 17.9%, YoY.
Moreover, a regulation issued in June 2011 enabled telecom operators and foreign operators to offer cable TV services in Brazil and Oi plans to make a significant investment in this service (although it already possessed cable TV) re-launching the product in early 2012. The company states that they will launch an IPTV before the end of 2011.
Both pay-TV and broadband services are crucial elements to the success of the multiple-play offerings. We believe that Oi is well positioned in the pay-TV fast-growing market and should be able to keep increasing its subscriber base during the next years. Broadband growth will be slower but we are confident that in the short to midterm the take-up of velocities above the current mode of 4Mbps will enable the company to increase its ARPU. Nevertheless, the competition in broadband is intensifying and we expect a decrease in Oi’s market share.