R E S E A R C H
Open Access
Effects of chronic alcoholism in the
sensitivity to luminance contrast in vertical
sinusoidal gratings
Éllen Dias Nicácio da Cruz, Michael Jackson Oliveira de Andrade
*, Melyssa Kellyane Cavalcanti-Gaudino,
Renata Maria Toscano Barreto Lyra Nogueira and Natanael Antonio dos Santos
Abstract
The aim of this study was to measure visual contrast sensitivity (CS) of luminance using vertical sinusoidal gratings with spatial frequencies of 0.6, 2.5, 5.0 and 20.0 cycles per degree of visual angle in chronic alcoholics in abstinence period. The participants were 20 volunteers (26–59 years of age) divided into two groups: the study group (SG) consisted of 10 volunteers with a clinical history of chronic alcoholism abstinence and the control group (CG) consisted of 10 healthy volunteers. Each group had five female and five male participants. All participants had normal or corrected visual acuity and were free of identifiable diseases. The psychophysical method of forced choice between two temporal alternatives (2AFC) was used to measure visual CS of luminance of 41.2 cd/m2. The results showed significant differences between groups for all spatial frequencies tested (p< 0.001). These results suggest alterations in the visual perception related to chronic alcohol consumption even after years of abstinence.
Keywords:Alcoholism, Spatial vision, Visual contrast
Background
Alcoholism is a worldwide health problem defined as a chronic disorder of alcohol dependence (WHO, 2010). The excessive or chronic alcohol intake over time causes struc-tural, cognitive and behavioral alterations in the Central Nervous System (Harper & Matsumoto, 2005; Marlatt, Blume, & Schamaling, 2000; Oliveira, Laranjeira, & Jaeger, 2002; Oscar-Berman & Marinkovic, 2003; Oscar-Berman & Marinkovic 2007; Rosenbloom, Sullivan, & Pfefferbaum, 2004; White, 2003).
Among the changes in visual perception associated with alcohol use, we highlight: (i) neurodegenerative alterations in visual pathways and retinal layers inte-grated into the functional decline of rods and cones (Lima et al. 2006); (ii) alterations in cortical receptive fields of single cells and hypercomplex selective visual spatial orientation (Medina, Krahe, & Ramoa, 2005); and (iii) alterations in visual processing of chromatic and achromatic stimuli (Castro et al. 2009; Chen, Xia, Li, &
Zhou, 2010; Rosenbloom et al., 2004; Wegner, Günthner, & Fahle, 2001).
Neurovision studies have reported behavioral changes related to ingestion of alcohol, for example: (i) changes in perception and detection of asymmetry of facial expressions in both men and women (Oinonen & Sterniczuk, 2007); (ii) change in luminance processing speed in photopic and scotopic levels (Khan & Timney, 2007; Puell & Barrio, 2008). Even with physiological and Psychophysics findings, it is not possible to identify an explanatory model of action of alcohol on sensory and behavioral mechanisms of vision.
The studies mostly have assessed the effects of alcohol on visual perception using achromatic contrast sensitiv-ity (CS) and acute or moderate alcohol intake (Adams, Brown, & Flom, 1976; Andre et al. 1994; Cavalcanti-Galdino, Mendes, Vieira, Simas, & Santos, 2011; Cavalcanti-Galdino, Silva, Mendes, Santos, & Simas, 2014; Roquelaure, Gargasson, Kupper, Girre, Hispard, & Dally, 1995; Pearson & Timney, 1999; Weschke & Niedeggen, 2012).
The measure of CS is defined as the inverse of the minimal amount of contrast (or 1/threshold) required to
* Correspondence:[email protected]
Universidade Federal da Paraiba, João Pessoa, Brazil
detect an object (for example a vertical sine grid). Thus, the contrast sensitivity function (CSF) represents the CS for a set of spatial frequency bands low, medium and high (De Valois & De Valois, 1988). So the CS allows you to measure and describe the sensory response of the vis-ual system in different conditions and assess how the be-havior of spatial frequency bands are changed for development or by age (Atkinson, Braddick, & Braddick, 1974; Bradley & Freeman, 1982; Owsley, Sekuler, & Siemsen, 1983) and dysfunctions or disorders that affect the central nervous system (Akutsu & Legge, 1995; Elliot & Situ 1998).
However, few studies have measured the visual CS of volunteers who are chronic alcoholics in abstinence period for sinusoidal grating stimuli. The contrast sensi-tivity was measured to visually achromatic sinusoidal grating with a spatial frequency of 0.2 to 30 cycles per degree of visual angle (cpd), using the psychophysical method of adjustment (Castro et al., 2009). The results showed no statistical difference in the visual achromatic CS between alcoholic patients and healthy volunteers. Roquelaure et al. (1995) measured the CS to visual si-nusoidal grating with spatial frequencies of 0.1 to 9.0 cpd using the method of parameter estimation and sequential testing without any limit of time finding sig-nificant differences in all frequency bands.
The aim of this study was to measure visual CS of achromatic luminance in alcohol abstainers by using ver-tical sinusoidal grating stimuli with spatial frequencies of 0.6, 2.5, 5.0, and 20.0 cpd, using the psychophysical forced-choice method. In this study, it is expected that the chronic use of alcohol alter the visual perception or CS for achromatic stimuli luminance in low, median and highs frequencies.
Method
Subjects
The participants were 20 volunteers divided into two groups: the study group (SG) which consisted of 10 vol-unteers with a clinical history of chronic alcoholism ab-stinence, aged between 26–59 (M = 47.1, SD = 11.2); and the control group (CG) which consisted of 10 healthy volunteers aged between 21–58 (M = 31.7, SD = 13.5). Each group had five female and five male participants. All participants were with their ophthalmologic exam updated, had normal or corrected visual acuity and were free of identifiable diseases.
The 10 participants of the SG were selected from a sam-ple of 60 volunteers who were abstinent alcoholics attend-ing a support group for alcohol dependents (Alcoholics Anonymous). We used the following inclusion criteria: having been eye examined recently and showing no visual problems (exception was the use of the lens for the cor-rection of visual acuity) or any type of neuropsychological
and neuropsychiatric disorders. The volunteers of the SG consumed alcohol for a period from 6 to 27 years (M = 17.6, SD = 8.51) and had been free of alcohol for at least 1 year (M = 12.65, SD = 8.76 years). The partici-pants of the CG was selecteds for convenience sampling and they were not using drugs, except alcohol consump-tion sporadically or at parties. They also presented no psy-chiatric illness and had normal optical functions according to the eye examination.
The volunteers of the research signed informed con-sent documentation according to Resolution no. 196/96 of the National Health Council in Brazil, which deals with the guidelines and standards for research involving humans.
Equipment and Stimulus
The visual stimuli were generated on a CRT (Cathodic Ray Tube) colored LG 19-in. video screen, with a reso-lution of 1024 x 768 pixels, image refresh frequency of 70 Hz, connected to a microcomputer through a proces-sor video Bits++ (Cambridge Research Systems, Rochester, Kent, England, 2002). The Bits++ Processor was used to expand the range of brightness of the screen from 256 (or 28) to 16.384 (214) grayscale levels, allowing us to test the contrast threshold accurately. The video processor Bits++ was controlled by software developed in C++ by the re-search group itself. The software also controlled the gen-eration and random presentation of a pair of stimuli and recorded the contrast thresholds.
A chair was set at 150 cm from the video screen, with a support for the chin and forehead to control the dis-tance. A LightScan program with an OptiCAL photom-eter (Cambridge Research Systems, Rochester, Kent) was used to measure the average luminance of the screen (41.2 cd/m2) screen. The minimum luminance was 0.4 cd/m2 and the maximum was 82.0 cd/m2. The lab environment measured 2.5 x 2.0 m, illuminated with a Philips20W fluorescent lamp. The walls were gray to better control the luminance during the experiments.
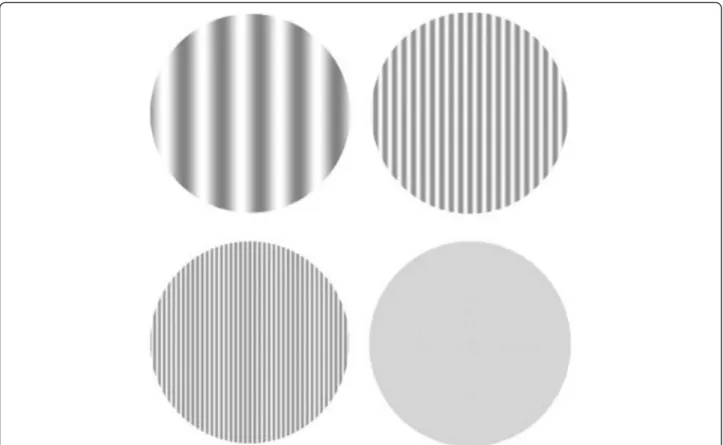
The stimuli used to measure the contrast threshold (1/CS) were defined by achromatic visual luminance modulation in the form of vertical sinusoidal grating with spatial frequencies of 0.6, 2.5, 5.0 and 20.0 cpd (Fig. 1). These had circular patterns having a diameter of 5° of vis-ual angle at 150 cm de distance. The neutral stimulus was gray, homogeneous and contained only the average lumi-nance (41.2 cd/m2). All stimuli were achromatic and were presented in real time at the center of the screen.
Procedure
consumed, family history of alcoholism, use of tobacco and other drugs, neuropsychiatric disorders associated with alcoholism and nature of treatment: psychoactive drug, psychotherapy, self-help groups) and ophthalmo-logical visual examination.
As a control criterion of the sample, the Beck Depres-sion Inventory (BDI) for not diagnosed samples was used. The BDI was used to evaluate depressive symp-toms of participants, since comorbidity is often associ-ated with alcoholism (Jaber-Filho and André 2002), and the visual sensitivity (Cavalcanti & Santos, 2005). No re-search participant had a score above the cutoff (20), with a mean of 10.3 (SD = 8.3).
To measure the visual CS, a psychophysical forced-choice method was used with two temporal alternatives (2AFC). This method is based on successive and random presentation of pairs of stimuli in the center of the screen: each pair consisted of a neutral stimulus and an-other containing the spatial frequency (stimulation test). The stimuli were generated in shades of gray150 cm away from the screen. The participant’s task was to iden-tify the stimulation test binocularly.
The experimental session began with a sound followed by a presentation of the first stimulus, which could be the neutral or the test. The order of presentation of the
patterns was done randomly and was controlled by a computer program. The first stimulus remained on the screen for about 2 s, followed by a one-second interval when the second stimulus also appeared on the screen for more than 2 s. The participants issued their response after the second stimulus disappeared from the screen.
The volunteer was instructed to press the left but-ton of the mouse (n°. 1), if the stimulus containing the spatial frequency appeared first, or the right but-ton of the mouse (n°. 2), if the spatial frequency was presented after the neutral stimulus with luminance average. At every three consecutive correct answers, the standard decreased in one unit of contrast (20 %), and to each error the same unit was added. All mea-surements were performed in two experimental ses-sions. In the first session, the test with all spatial frequencies was performed at random; and in the sec-ond session retesting with the same spatial frequen-cies was performed.
At the end of each experimental session, the program generated an answer sheet with the values of reversals contrast obtained. These values were grouped into spreadsheets according to the frequencies and to the group of participants (SG and CG). Was utilized the
psychophysical method of stairs for estimate of contrast threshold according to the spatial frequency tested to statistically infer the mean differences.
Results
The analysis of variance (two way) showed a significant difference between groups [F (1, 18) = 29,8,p< 0.01;
η2= 0.32] and interaction between spatial frequencies
[F (3, 54) = 1029,8, p< 0.01]. By comparing the spatial
frequencies tested between groups, post hoc Tukey HSD test showed significant differences in all tested frequencies (p< 0.01). Table 1 shows the values of visual CS for both groups.
Contrast sensitivity achromatic curves have higher ampli-tude in the medium spatial frequencies with attenuations at frequencies of 0.6 and 20 cpd for both groups. Moreover, the curves show greater sensitivity at frequency 2.5 cpd and lower sensitivity to spatial frequency of 20 cpd (Fig. 2). However, the data showed that participants of the CG were more sensitive than the volunteers of the SG in the range of 1.25 times to the frequency of 0.6 cpd (p< 0.001); of 1.37 times to the frequency of 2.5 cpd (p< 0.001); and 2.11 times to the frequency of 5 cpd (p< 0.001) and 1.8 times to the frequency of 20 cpd (p< 0.001).
Discussion
The present study evaluated the visual CS of achromatic luminance in abstinent alcoholics to stimuli in vertical sinusoidal grating with spatial frequencies of 0.6; 2.5; 5 and 20 cpd. The hypothesis was to assess whether chronic use of alcohol alter visual perception, even dur-ing a period of abstinence. The results showed that chronic alcohol exposure alters the visual perception or visual CS to stimuli of vertical sinusoidal grating in all ranges of frequencies tested, indicating changes in sen-sory mechanisms or selective visual channels for that stimulus type (Table 1 and Fig. 2).
Alteration in visual CS for vertical sinusoidal gratings for spatial frequencies was expected, considering that several studies have reported that excessive or chronic alcohol ingestion causes structural, cognitive and behav-ioral alterations in the Central Nervous System (Harper & Matsumoto, 2005; Marlatt et al., 2000; Oliveira et al., 2002; Oscar-Berman & Marinkovic, 2003; Oscar-Berman & Marinkovic 2007; Rosenbloom et al., 2004; White, 2003).
Our results corroborate the results of Roquelaure et al. (1995) who found damages in low, medium and high spatial frequencies, including the range of 0.1 to 9.0 cpd. On the other hand, they do not corroborate the results of Castro et al. (2009), as these authors have shown no change in visual CS achromatic related to chronic alco-hol consumption. However, it is important to note that these studies have methodological features that prevent a direct comparison between the results. For example, the present study used the psychophysical forced-choice method for measuring the response of visual CS, while Castro and colleagues used the psychophysical method
Table 1Measures of sensitivity to visual contrast of abstinent alcoholics for vertical sinusoidal grating stimuli with spatial frequencies of 0.6; 2.5; 5 and 20 cpd
Group Age Spatial frequencies
M DP 0.6 2.5 5 20
CG 31.7 13.5 61.4 175 141.4 13
SG 47.1 12.2 53.7 141.1 104.1 7.4
of adjustment. Besides generating lower contrast thresh-olds, psychophysical forced-choice method is based on probability criterion of 79 % of correct answers by the participant, rather than 50 % as a parameter to deter-mine the contrast threshold. Furthermore, the method of forced choice is one of the few psychophysical methods of controlling the response criterion of partici-pants (García-Pérez 1998). However, it is not possible to say that the differences among the results of the two studies are due solely to the method used. It is possible that other variables that are difficult to be controlled in research involving human subjects, such as the type of drink, the frequency and duration of chronic consump-tion, which are not always clear, may contribute to the discrepancy among the results.
In this context, it is necessary to conduct further research seeking to refine the sample characteristics to establish intra and more homogeneous parameters between groups and thus further elucidate the effect of chronic alcohol use on visual perception of achromatic luminance contrast. Although the effects of moderate or acute alcohol consumption on visual CS are described by several studies reporting alterations in medium and high frequencies with greater damage in the range of spatial frequencies of 3.0 and 6.0 cpd (Andre, 1996; Nicholson, Andre, Tyrrell, Wang, & Leibowitz 1995; Weschke & Niedeggen 2012; Zhuang et al., 2012). Researches with human volunteers with histories of chronic consumption and in abstinent state are still little explored.
The measurement of the visual CS in abstinent alcoholics can be theoretically and clinically important because it may help in understanding the behavioral and neurobiological mechanisms involved in this disorder, collaborating with the accompaniment of damages (Yudofsky & Hales, 2006). It can also help in the investigation of neurocognitive visual deficits (Brenner et al. 2002).
Conclusions
Overall, this research demonstrated that chronic alcohol exposure significantly degrades the visual CS at all tested frequencies, even when the individual is in the period of abstinence, suggesting that alcoholism promote long lasting behavioral alterations in visual perception and in the nervous system.
Competing interests
The authors declare that they have no competing interests.
Authors’contributions
All actors participated equally in the drafting of article. All authors read and approved the final manuscript.
Received: 9 March 2016 Accepted: 7 April 2016
References
Adams AJ, Brown B, Flom MC. Alcohol-induced changes in contrast sensitivity following high-intensity light exposure. Am J Optom Physiol Optic. 1976;52: 729–35.
Akutsu H, Legge GE. Discrimination of compound gratings: spatial-frequency channels or local features? Vis Res. 1995;35:2685–95.
Andre J. Visual functioning in challenging conditions: effects of alcohol consumption, luminance, stimulus motion, and glare on contrast sensitivity. J Exp Psychol Appl. 1996;2:250–69.
Andre JT, Tyrrell RA, Leibowitz HW, Nicholson ME, Wang M. Measuring and predicting the effects of alcohol consumption on contrast sensitivity for stationary and moving gratings. Percept Psychophys. 1994;56:261–7. Atkinson J, Braddick O, Braddick F. Acuity and contrast sensitivity of infant vision.
Nature. 1974;247:403–4.
Bradley A, Freeman RD. Contrast sensitivity in children. Vis Res. 1982;22:953–9. Brenner CA, Lysaker PH, Wilt MA, O’Donnell BF. Visual processing and
neuropsychological function in schizophrenia and schizoaffective disorder. Psychiatry Res. 2002;111:125–36.
Castro AJL, Rodrigues AR, Côrtes MIT, Silveira LCL. Impairment of color spatial vision in chronic alcoholism measured by psychophysical methods. Psychol Neurosci. 2009;2:179–87. doi:10.3922/j.psns.2009.2.009.
Cavalcanti AM, Santos NA. Os efeitos da depressão na percepção visual de contraste em humanos: achados preliminares. Revista Brasileira de Terapias Cognitivas. 2005;1:21–8.
Cavalcanti-Galdino MK, Mendes LC, Vieira JG, Simas ML, Santos NA. Percepção visual de grade senoidal radial após o consumo de álcool. Psicol USP. 2011;22:99–115. Cavalcanti-Galdino MK, Silva JA, Mendes LC, Santos NA, Simas ML. Acute effect of alcohol intake on sine-wave Cartesian and polar contrast sensitivity functions. Braz J Med Biol Res. 2014;47:321–7. doi:10.1590/1414-431X20143209. Chen B, Xia J, Li G, Zhou Y. The effects of acute alcohol exposure on the
response properties of neurons in visual cortex area 17 of cats. Toxicol Appl Pharmacol. 2010;243:348–58. doi:10.1016/j.taap.2009.11.027.
De Valois RL, De Valois KK. Spatial Vision. New York: Oxford University Press; 1988. Elliot DB, Situ P. Visual acuity versus letter contrast sensitivity in early cataract. Vis
Res. 1998;38:2047–52.
García-Pérez MA. Forced-choice staircases with fixed step: asymptotic and small-sample properties. Vis Res. 1998;38:1861–81.
Harper C, Matsumoto I. Ethanol and brain damage. Curr Opin Pharmacol. 2005;5: 73–8. doi:10.1016/j.coph.2004.06.011.
Jaber-Filho JA, André C. Alcoolismo. Rio de Janeiro: Revinter; 2002.
Khan SA, Timney B. Alcohol slows interhemispheric transmission, 458 increases the flash-lag effect, and prolongs masking: evidence for a slowing of 459 neural processing and transmission. Vis Res. 2007;47(13):1821–32. Lima RCR, Carvalho F, Campos SBS, Dantas H. Análise da camada de fibras
nervosas da retina em usuários crônicos do tabaco e álcool. Arq Bras Oftalmol. 2006;69:323–5.
Marlatt GA, Blume AW, Schamaling KB. Executive cognitive function and heavy drinking behavior among college students. Psychol Addict Behav. 2000;14: 299–302. doi:10.1037/0893-164X.14.3.299.
Medina AE, Krahe TE, Ramoa AS. Restoration of Neuronal Plasticity by a Phosphodiesterase Type 1 Inhibitor in a Model of Fetal Alcohol Exposure. J Neurosci. 2005;26:1057–60. doi:10.1523/JNEUROSCI.4177-05.2006. Nicholson ME, Andre JT, Tyrrell RA, Wang M, Leibowitz HW. Effects of moderate
dose alcohol on contrast sensitivity for stationary and moving targets. J Stud Alcohol. 1995;56:261–6.
Oinonen KA, Sterniczuk R. An inverse relationship between typical alcohol consumption and facial symmetry detection ability in young women. J Psychopharmacol. 2007;21(5):507–18.
Oliveira MS, Laranjeira R, Jaeger A. Estudos do prejuízo cognitivos na dependência do álcool. Psicologia, Saúde & Doença. 2002;3:205–12. Oscar-Berman M, Marinkovic K. Alcoholism and the brain: an overview. Alcohol
Res Health. 2003;27:125–33.
Oscar-Berman M, Marinkovic K. Alcohol: effects on neurobehavioral functions and the brain. Neuropsychol Rev. 2007;17:239–57. doi:10.1007/s11065-007-9038-6. Owsley C, Sekuler R, Siemsen D. Contrast sensitivity throughout adulthood. Vis
Res. 1983;23:689–99.
Pearson P, Timney B. Differential effects of alcohol on rod and cone temporal processing. J Stud Alcohol. 1999;60:879–83.
Roquelaure Y, Gargasson JFL, Kupper S, Girre C, Hispard E, Dally S. Alcohol consumption and visual contrast sensitivity. Alcohol Alcohol. 1995;30(5):681–5. Rosenbloom M, Sullivan E, Pfefferbaum A. Using magnetic resonance imaging
and diffusion tensor imaging to assess brain damage in alcoholics. Alcohol Res Health. 2004;27(2):146–52.
Wegner AJ, Günthner A, Fahle M. Visual performance and recovery in recently detoxified alcoholics. Alcohol Alcohol. 2001;36(2):171–9. doi:10.1093/alcalc/36.2.171. Weschke S, Niedeggen M. Differential effects of moderate alcohol consumption
on motion and contrast processing. Psychophysiology. 2012;49:833–41. doi:10.1111/j.1469-8986.2012.01356.x.
White AM. What happened? Alcohol, memory blackouts, and the brain. Alcohol Res Health. 2003;27(2):186–96.
World Health Organization. Alcohol. 2010. http://www.int/en/. Accessed 6 Feb 2010.
Yudofsky SC, Hales RE. Neuropsiquiatria e neurociências na prática clínica. 4ªth ed. Porto Alegre: Artmed; 2006.
Zhuang X, King A, McNamara P, Pokorny J, Cao D. Differential effects of alcohol on contrast processing mediated by the Magnocellular and Parvocellular pathways. J Vis. 2012;12(11):1–13. doi:10.1167/12.11.16.
Submit your manuscript to a
journal and benefi t from:
7Convenient online submission 7Rigorous peer review
7Immediate publication on acceptance 7Open access: articles freely available online 7High visibility within the fi eld
7Retaining the copyright to your article