On the Intrinsic Limits of the Convolution Method to Obtain the Crystallite Size
Distribution from Nanopowders Diffraction
Roberto Ribeiro de Avilleza* , Fernanda Gonçalves Abrantesa, Sonia Letichevskya
Received: November 01, 2017; Revised: February 09, 2018; Accepted: February 18, 2018
The present work briefly reviews the convolution of crystallite shape functions and discusses its experimental limitations. The diffraction from a theoretical spherical shape powder is used to exemplify the limits of the convolution procedure. Mean lattice distortions were not considered since the discussed limitations are inherent to the convolution method using Fourier transforms. The diffraction pattern and the convolution were calculated using appropriate macros for the Topas program. It is shown that very small crystallites require a large 2θ convolution span and the smallest subdivision for the distribution will depend on this convolution span. To show the importance of the convolution limits and its application, the nanocrystalline CeO2 round-robin diffraction pattern was evaluated. The chord frequency distribution by XRD showed conformity with the chord distribution calculated from a grain size histogram obtained by transmission electron microscopy for this sample.
Keywords: X-ray diffraction, convolution limits, crystallite size distribution, Nyquist Theorem, nanopowder.
*e-mail: [email protected]
1. Introduction
The profile analysis of diffraction lines has been around for a very long time. The first systematic theory was proposed by Bertaut1 and has been extensively addressed by André Guinier in his book on X-Ray Diffraction2, first published in 1956. The deconvolution approach by Fourier transforms has been widely used by many authors. Langford et al.3 discussed the different approaches used to determine the crystallite size and its distribution profile and suggested the use of lognormal distribution and a predefined shape to avoid the mathematical instabilities frequently present when obtaining column-length distributions from the second differential of Fourier transform coefficients. They emphasized that the major drawback of all methods is to assume the same shape for all crystallites. Although Armstrong and Kalceff4 used a Bayesian maximum entropy method to deconvolve and remove the instrument broadening and also to determine the column-length distribution, they did not comment on the inherent limits of the convolution process.
Berkum et al.5,6 developed an approach to calculate the peak profile including both the crystallite size and strain contributions and compared it to the Warren-Averbach analysis7. The Whole Powder Pattern Modelling (WPPM) approach proposed by Scardi and Leoni8 is essentially a procedure that convolutes mathematical functions that describe the peak profile with different contributions from the instrument and the sample microstructure. Kojdecki et al.9 proposed a description of the crystallite size distribution following closely Wilson's approach10 which also includes the strain distribution. All these approaches rely basically on the same Fourier transform relationship to describe the
peak profile and there were no discussions on the limits inherent from the signal processing with Fourier transforms.
Ida and Toraya11 discussed the propagation of errors during the deconvolution of the instrumental functions in the diffraction profile, but they did not analyze the errors related to the sampling process for a Fourier transform. Dykhne et al.12 provided a proper discussion of the deconvolution limit related to the determination of the atomic pair distribution from X-ray diffraction profile. However, they did not point out that the similar limits are also present in all methods that attempt to extract crystallite size distribution and lattice distortions from diffraction peak profile.
The present work reviews Bertaut's approach1 to the effect of domain size and shape on peak profile, following closely the Guinier's presentation2. It also discusses the limitations of the convolution procedure using the quite simple theoretical profile due to spheres for the peak profile and convoluting the shape of prisms with the base parallel to the diffracting plane to determine the column-length distribution as proposed by Bertaut and Guinier. The column-length distribution was used as an example that is independent from the crystallite shape and has a relatively simple mathematics. Further, it addresses the errors related to the Nyquist Theorem13 from sampling the X-ray diffraction pattern for a convolution with Fourier transforms. The column-length distribution is used as an example for spherical crystallites without considering lattice strains, but the same limitations are present if one includes the lattice strain, since the discussed errors are always present in digital signal processing. Topas macros were employed to simulate the peak profile of the spherical crystallites and to convolute prisms shapes to determine their column-length distribution. aDepartamento de Engenharia Química e de Materiais, Pontifícia Universidade Católica do Rio de
2. Profile Shape Review
The following review follows Guinier's book2. The calculated diffracted amplitude depends on the electron density inside a unit cell, ρ(x), centered on the lattice points which are accounted for by a sum of Dirac functions, z(x), and the form factor of the crystallite, i.e., the finite diffracting domain, σ(x), which equals to 1 inside the diffracting domain and zero outside. So the amplitude of the diffracted wave is:
(1)
the integration being extended to all the object space. s is a vector of the reciprocal space and i= -1. The intensity must be proportional to:
(2)
where rhkl points to reciprocal space node corresponding *
to the hkl plane, Fhkl
2
is the structure factor of the crystal,
V is the volume of the diffracting crystal containing N unit cells of volume Vc. Equation 2 is Guinier's equation 4.28 and
(3)
is the Fourier transform of the volume which is common to the object and to its ghost obtained by displacing the object by the distance x. |Σ(s)|2 is the Fourier transform of the convolution of form factor function σ(x) and σ(-x). Since the form factor function σ(x) is real, the reflection domain in reciprocal space is always centrosymmetric and the line profile due to any domain shape must also be symmetric.
The Fourier transform of |Σ(s)|2 is:
(4)
If one considers the node hkl distant rhkl from the origin of * the reciprocal space, O, one may decompose any vector s in the domain region around the node by one vector parallel to rhkl*, so, and another, u, perpendicular: s = so+u. Further, one may consider a vector t in object space, of length t, that is normal to the hkl lattice planes of the crystal producing the diffraction, so that the previous equation may be rewritten for this particular vector:
(5)
The double integral
(6)
corresponds to the scattering power over the cross-section of the domain at a distance so from the origin.
Therefore, it is proportional to the intensity of the powder
profile line at the abscissa corresponding to so, or i(so),
the profile of the diffracted line. Hence, one may rewrite:
(7)
which shows that the function V(t) is the Fourier transform of i(so) and depends on a single variable:
(8)
The geometric interpretation of V(t) is straightforward. It is the volume common to the crystal and to its ghost obtained by a translation t in the direction normal to the diffracting lattice planes, divided by the volume of the crystal. This expression is similar to Equation 7 presented by Kojdecki et al.9, or Equa -tion 2 presented by Langford et al.3, which is fundamental for the Whole Powder Pattern Modelling approach proposed by Scardi and Leoni8,14. Equation 8 is the Fourier transform of the crystallite shape used to describe the peak profile. This equation is the essential step in digital signal processing. The limits of the convolution of Fourier transforms apply to this equation for any function used to describe the morphology of the crystallites.
The vector so may be calculated with respect to the center of each diffraction node, which is equivalent to consider the node at the origin, and is given by:
(9)
where the angles are given in radians and the last relationship is an approximation valid for small displacements around 2θhkl angle.
If the crystal is a sphere of diameter D, V(t) will not depend
on any particular chosen diffracting plane and is given by
(10)
and, according to Eq. 8, the line profile produced by the diffraction of a powder with spheres of the same diameter is proportional to the Fourier transform of V(t):
(11)
Equations 10 and 11 have been used by Langford et al.3 and Scardi et al. 15 and have been coded in their PM2K program. Wilson 10 and Langford and Wilson16 provided similar expressions for different shapes.
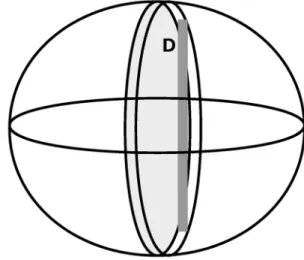
However, it is unlikely that nanocrystals will always have spherical domains. It is probable that the shape and size distribution of the crystallites in a powder will be a complex function. Bertaut1 and Guinier2 had suggested that a crystal with complex geometry may be divided into prisms with columns normal to the lattice planes hkl and with cross-section (base) area da. Figure 1 shows a sphere with the column drawn in
dark grey. The height of the column is the thickness of the
( ) ( ) ( ) ( )exp( )
A s =
#
t x z x v x -2ris x dv$ x( ) * ( ) ( ) ( )
IN s A s A s VVcF s r*
hkl
h k l hkl
2
2
R R R R
= =
-( )
s
( ) * ( )
s
s
V V x
( )
exp
(
2
is x dv
)
x2
$
r
R
=
R
R
=
#
-( ) ( ) exp( )
V x Vs 2 is x dvs
2
$ r
R
=
#
( ) ( ) exp( )
V t Vs 2 is t ds du
2 0 0 r R =
#
#
#
( ) V s du 2 R#
#
( ) ( )exp( )
V t =
#
i s0 2ris t ds0 0( ) ( )exp( )
i s0 =
#
V t -2ris t dt0( )
sin sin cos
s s r* 2 2 2 2
hkl hkl hkl hkl 2 O m i m i m
i i i
= i- = -
-( )
V t Dt
D t
1 23 21 3
3 = - + ( ) ( ) ( ) ( ) sin cos V s sD sD sD sD sD 1 2 2 1 2
2 3 4
r r
r
r r
-crystal D at the considered point. Therefore, the volume of the
column has the length D-|t| for |t|≤D and zero for |t|>D, hence:
(12)
The above expression can be rewritten as:
(13)
Where
(14)
is the distribution function for the column heights. It represents the volume fraction of the crystallite for which the length of the column normal to the plane hkl lies between D and D + dD.
This distribution function applies to the heights of all crystallites. The Fourier transform of
(15)
Is
(16)
which is the interference function for an object with the form of a segment of a straight line of length D and the profile of the diffraction line is given by:
(17)
This function is similar to the profile functions employed by Scardi and Leoni8, except that they have considered specific shapes and distributions. If the distribution is not a priori known, one may substitute the integration by the sum:
(18)
and determine the values for g(Di) for an approximate normalized distribution with N bins, considering the language of statistics. If during the fitting process the distribution is not normalized, the fitted values must be divided by the integral of g(Di) over the range of interest.
3. Convolution Limits
The diffraction pattern is a signal that results from the convolution of the X-ray emitted by a source with the sample and the apertures and other features along the light way. The possibility of describing the peak profile due to the equipment geometry by appropriate functions provides the starting point to convolute the effects due to the sample. Particularly important to the study of nanomaterials are the shape and size effects of very small particles, briefly
described in the previous section. Distortions are also important and may be included in the convolution8,17, but they will not be considered in the present article since they will not add to the discussion of the convolution limit.
( ) ( )
VV t D t daD
D D
0
= 3
-= =
#
( ) ( )) ( )) ( )
V t 1 Dt DdaV D 1 Dt g D dD
0 0
= 3 - = 3
-#
#
( )
g D dD= DdaV D
D t
1
-( )
( )
sin
D sD
sD
2 2
r r
( ) sin( ( ) ) ( )
i s D
sD sD
g D dD
2 2
0 r
r
= 3
#
( )
( )
( )
( ) sin
i s D
sD sD
g D dD N
i i
i i
0 2
2
r r
R
=
Figure 1. A sphere with the column-lenght drawn inside it
The convolution of the approximate sum equation, Eq. 18, brings some major questions to the practical use of this relationship, all them concerned with the errors from sampling the peak profiles. What is the interval 2θ-range around a peak that must be used? What is the maximum interval of column-lengths that may be considered? What is the smallest subdivision, dD of the maximum interval? Or
the equivalent: what is the maximum number of subdivisions,
N, of the maximum interval? These questions must be answered within the scope of digital signal processing since Eq. 18 is indeed the convolution of Squared Sinc functions to the peak profiles obtained from the powder diffraction.
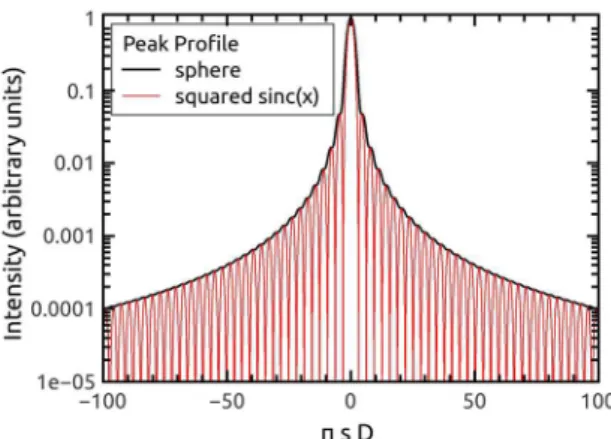
The first step in digital signal processing is to define the window, the s-range, or 2θ-range, around a peak that includes all the intensity data distinct from the background and a small background region on both sides of the peak. This problem had also been identified by Bertaut1. Figure 2 compares the peak profile due to a sphere and the squared sinc function using the dimensionless abscissa πsD. It is important to notice that this figure does not depend on the size of the sphere, or the length of the column. The figure clearly shows that the window strongly depends on the background to peak ratio. It is common to have values for the background to peak ratio between 10-3 to 10-4, so the half of the window range,
πsD will be about 31.4 and 100, respectively.
Further, the s-range window will depend on the choice of the smallest chord length D, i.e., the crystallite size. Smaller D value requires greater s-range, and vice-versa. However,
since the X-ray data is usually collected using 2θ angle, Equation 9 may be used to determine the 2θ-range associated with D value and background to peak ratio. This range will
2θhkl. Figure 3 shows the 2θ-ranges as a function of the chord
length D for two different wavelengths, corresponding to Ag
(0.056 nm) and Cu (0.154 nm) radiation, and for the two most used background to peak signal ratio. If one considers that
±20º is a reasonable range around a Bragg peak to compute the convolution, then the figure shows very clearly that the minimum D chord length varies from 1.9 nm for silver
radiation and a background to peak ratio equal to 10-3
to 15 nm for copper radiation and a background to peak ratio equal to 10-4. Therefore, the minimum chord length to be used in Eq. 18 is very dependent on both wavelengths used in the diffraction experiment and the range around the selected peak. In order to reduce the minimum chord value, greater energy radiation (smaller wavelength) is required. Last, since the 2θhkl Bragg peak was 30º for Fig. 3, Bragg peak angles greater than 30º will require larger windows for the same D
chord length. Nonetheless, the chord length lower than 3 nm may not be feasible due to the background level and noise.
oscillations are inherently to the convolution of sinc functions if the sinc frequency is greater than half the sampling frequency. This is the Nyquist theorem13 and it sets a frequency rate to be used during the digital signal processing. This is the major restriction to digital signal processing and also provides the proper choice of minimum chord value to be used in Eq. 18.
If one considers a peak at 2θhkl, it corresponds to the
reciprocal space position:
(19)
The convolution should be done in the reciprocal space, but it is usual to define the range in the diffraction angle space [2θhkl-δθ,2θhkl +δθ] which corresponds to the
following range in the reciprocal space:
(20)
Even though the peak is not a periodic function like a sinc wave, the range defines the period for the Fourier convolution space. The inverse of this period is proportional to the frequency of the signal, the peak and its surrounding background, and the sampling frequency must be greater than half this signal frequency. In order to gain insight for the proper choice of fitting interval and minimum column height D, one may calculate the
period, ∆s. If one considers that the half angular range,
δθ (radian), is small compared to unity so that the sinc may be approximated by the angle, the period is given by:
(21)
The inverse of the ∆s corresponds to a signal frequency and has unit of length. Proper sampling requires, at least, two points inside the θhkl ± δθ range, so the minimum chord length must be twice the signal frequency:
(22)
This equation is similar to Scherrer equation and shows that the minimum chord length will increase with smaller δθ-range and greater 2θhkl. For most diffraction
measurements 2θ=120º is a typical upper bound for the full diffraction range, so it provides an estimate for the minimum sampling frequency. For copper radiation, 0.154 nm, and δθd in degrees, the minimum value is:
(23)
The minimum column-length also establishes the maximum number of column-length domains (bins) that one must divide the expected maximum column-length.
Further, Equation 21 may also be used to estimate the maximum step size acceptable to collect the X-ray data and
Figure 2. Theoretical peak profile due to spherical crystallites
superposed with the squared sinc function
Figure 3. Calculated range limits as a function of the chord length
D, the wavelength and the background to peak signal ratio
As pointed out by Le Bail and Louër18, Fourier analysis of diffraction peaks may lead to crystallite size distributions perturbed by oscillations. They proposed a least squares smoothing procedure to eliminate the problem. Nonetheless, the observed
( )
, ( ) .
sin sin
2 hkl 2 hkl
m
i di
m
i di
- +
# &
.cos .sin . .cos
s 4 hkl 4 hkl
T m i di
m
di i
= =
. . cos
Dmin 2
hkl
di i
m =
.
Dmin 8 824nm
di =
.
sin
S
d
1
2
hkl hkl
hkl
m
i
probe the maximum chord length, Dmax. If δθs is the step size in degrees, then twice this value corresponds to Dmax:
(24)
As the crystallite size increases, the full-width half-maximum of the peaks will tend to a finite minimum value and it will be impossible to differentiate the contribution of the crystallite size from the equipment. Thus, a reasonable upper bound must be set experimentally within the limits of each equipment. It means that there will be no crystallite sizes above this value, so the last bin may be set to this range and its value fixed to zero. Now the number of intervals may be arbitrarily set constrained to the minimum column-length (Equation 23, for copper radiation). Next section presents the results for a theoretical peak.
4. Results
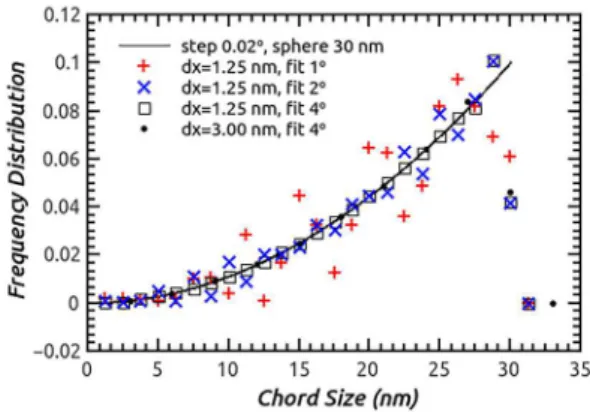
Figure 4 shows the theoretical diffraction pattern calculated for spheres with 30 nm diameter, simulated with the Fundamental Parameters approach provided by the Topas-Academic19: Bragg peak at 2θ= 30º , step angle = 0.02°, a 0.154 nm Lorentz profile monochromatic radiation with halfwidth 10-6 nm and zero background. This is a non-realistic peak but the purpose is to show the effect of sampling choices. This pattern was fitted considering different angular ranges around the peak and bin sizes (chord lengths). The red dots correspond to dxi = 0.125 nm and range of 4°. The line in Figure 5 shows the theoretical distribution of chords inside a sphere of 30 nm diameter. The distribution was normalized so that the integration of the distribution is 1 (one). The smallest and largest chord in this sphere are 0 and 30 nm, respectively. The fitted results showed that there are no chords with length much greater than 30 nm, so the bins with zero frequency distribution were not included in the figure. The scattered points correspond to the frequency distribution for chord lengths, D
i, obtained from fitting Equation 18 to the simulated diffraction peak. For the minimum chord length of 1.25 nm, Equation 23 provides for the range of 4° a minimum sampling frequency, i.e., the minimum column length, already smaller than the used subdivision of the allowed range of chords. One may observe that the experimental data fits the theoretical chord distribution for a sphere very well for the 4° range, but does not fit properly for smaller ranges. Indeed, the experimental results scatter badly around the theoretical line for the 1° and 2° ranges, red cross and blue x, respectively, which correspond to minimum sampling frequencies greater than 1.25 nm according to Eq. 23. Further, the experimental data for chords near 30 nm show clearly deviations from the theoretical distribution. This deviation appears when Fourier functions are used to describe jump discontinuities,
as the one found at the 30 nm end of the distribution 20,21. So the proper choice of 2θ ranges around the diffracted peak and minimum column-length are essential to get the correct distribution. One may expect similar deviations for any other shape description whenever the sampling frequency does not satisfy the Nyquist Theorem.
. cos
Dmax 8 180 1 103
s hkl s
rdi i
m
di
= =
Figure 4. Theoretical diffraction pattern for a crystallite powder
with spherical particles with 30 nm diameter and 0.154 nm radiation, the fitted convoluted pattern and difference curves
Figure 5. Theoretical chord length distribution for spherical particles
with 30 nm diameter (line according to Eq. (10)) and results from fitting the corresponding theoretical peak profile at 30o, calculated
with 0.02 o step, with different ranges and two minimum
column-lengths. Clearly the + and x deviate from the theoretical distribution
Further insight comes from the experimental determination of the volumetric mean chord of a sphere with diameter D. The
mean chord of a sphere is given by 0.75 D with the use of Eq. 10. So for a sphere with 30 nm diameter, the mean chord is 22.5 nm. Figure 6 shows that, for a fixed minimum chord length of 1.25 nm, increasing the fitting angular range around the peak position reduces the weighted profile residual error, (Rwp) and
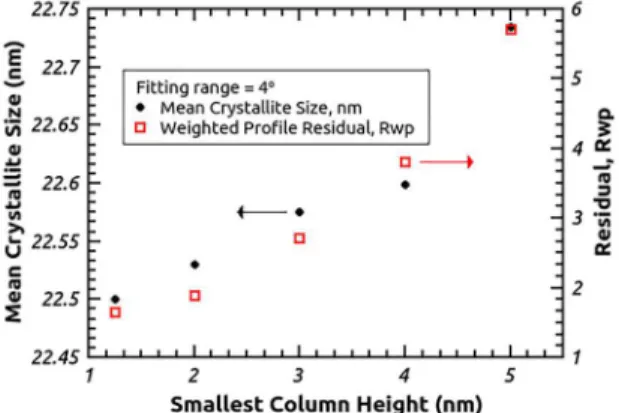
the experimental mean chord approaches a constant value slightly greater than the theoretical one. Figure 7 shows that, for a fixed fitting angular range of 4°, decreasing the minimum chord length within the limits allowed by Eq. 23 reduces Rwp
peaks were chosen to be analyzed (0 2 2) and (0 0 4). The first is well separated from the neighboring peaks which allowed to use a ± 4.5° 2θ interval around the peak, while the other required a ± 3.6° 2θ interval. The smallest bin sizes were calculated using these ranges and Eq. 23 but the fitting showed that the minimum acceptable bin size for peak (0 2 2) was 3 nm,which is consistent with the discussion presented in the previous paragraph, and 3.5 for the (0 0 4) peak, which conforms with the smaller 2θ range. The fitting quality was Rwp=5.00 and GoF=1.63 for peak (0 2 2) and 3.5 nm bin size and Rwp=7.87 and GoF=1.34 for peak (0 0 4) and 3.5 bin size. The reduction of the bin size for peak (0 2 2) caused a modest improvement of the fitting.
Figure 8 shows that the chord distribution estimated from the peak (0 2 2) for two different bin sizes seems to follow the same bimodal distribution. If one uses peak (0 0 4), the obtained distribution is slightly different but follows the overall behavior observed for peak (0 2 2), also with a clear bimodal distribution. The same sample analyzed by XRD was evaluated by transmission electron microscopy, TEM, 853 particles were measured to obtain the grain size distribution 24. The solid black line and black circles (Figure 8) were calculated from the original size distribution obtained from TEM analysis using a 2 nm bin width. Armstrong et al. observed a quasi-spherical particles 25, so to convert the diameter distribution to chord, M, it was assumed that the particles were spherical and that the chord distribution for each sphere with diameter D was given by the expression:
(25)
Figure 6. Mean crystallite size and weighted profile residual error
as a function of fitting range angle around a peak for the smallest chord length, 1.25 nm
Figure 7. Mean crystallite size and residual error as a function of
minimum chord length
Further, the effect of the minimum chord length is much stronger than the fitting angular range on the experimental mean chord. Therefore, one may always consider to use the smallest chord length consistent with Eq. 23 and the largest acceptable angular fitting range. For experimental diffraction patterns, the minimum chord length used (1.25 nm) is not acceptable since most peaks will probably be within the background noise of the normal diffraction pattern. So the minimum chord length will probably be around 3 nm.
To evaluate the application of the above limits to a real material, it was selected the diffraction pattern for a CeO2 nanocrystalline material prepared for a round-robin sponsored by the Commission on Powder Diffraction of the International Union of Crystallography 22. The chosen pattern was collected with a common laboratory setup in the University of Le Mans and may be downloaded from Davor Balzar's website 23. Two patterns were downloaded, a standard ceria with sharp peaks and a nanocrystalline ceria with broad peaks. The standard ceria was used to determine the laboratory intrinsic diffraction profile which was convoluted with the expression provided by Eq. 18. The broadening of the round-robin sample line peaks is due primarily to domain size effects 22,24. Even though a very small strain effect is also reported 22,24, it was not considered in the present study. Two
( )
g M 3MD3 2
=
Figure 8. Chord length distribution for CeO2 round-robin
sample22. The solid line with circles is the chord distribution
calculated from the grain size distribution of this sample
determined by transmission electron microscopy 24
proposed approach in this paper carries no presupposition on the particle geometry. The mean grain size determined from the TEM distribution 25 was 17.3 ± 0.3 nm while Paolo and Scardi 24 determined the size of 22.8 nm from X-ray diffraction pattern convolution. The mean chord dimension from the present study varied from 22.7 to 23.1 nm depending on the peak and bin size. For a sphere the mean chord size is 0.75 of its diameter 10, so the present study points for a mean diameter about 30.5 nm, if one assumes a spherical morphology.
5. Conclusion
The convolution of functions describing the shape of the nanocrystalline powders on their X-ray diffraction profile was reviewed and the limitations of this mathematical procedure was addressed. The present study shows that the fitting range around the peaks determines the minimum crystallite size to be used in the distribution of chord lengths when sinc functions are convoluted to obtain the whole powder pattern. A simple equation is deduced to correlate the 2θ-range and the minimum crystallite size considering the convolution of columns (chords) to the experimental profile. However, it is also proposed that the minimum chord length will be around 3 nm due to the background noise.
It is shown that the correct distribution of crystallite size was obtained when the sampling frequency satisfied the Nyquist Theorem. It was observed that the distribution oscillates around the theoretical values when the sampling frequency did not satisfy the Nyquist Theorem. The proposed limits are intrinsic to the convolution approach so they need to be considered for all similar methods.
The proper convolution limits were applied for a nanocrystalline CeO2 to evaluate the size-strain line broadening of diffraction peaks. The frequency distribution showed a good overall agreement with the one obtained by transmission electron microscopy. Further, the method proposed was able to unequivocally show a bimodal distribution that was barely visible in the grain size distribution obtained by TEM.
6. Acknowledgements
The authors thank CNPq, Processo 305095/2015-3, for partial financial support.
7. References
1. Bertaut EF. Raies de Debye-Scherrer et répartition des dimensions
des domaines de Bragg dans les poudres polycristallines. Acta
Crystallographica. 1950;3(1):14-18.
2. Guinier A. X-Ray Diffraction in Crystals, Imperfect Crystals
and Amorphous Bodies. Mineola: Dover Publications; 1994. 3. Langford JI, Louër D, Scardi P, Loue D. Effect of a crystallite size
distribution on X-ray diffraction line profiles and whole-powder-pattern fitting. Journal of Applied Crystallography. 2000;33(3):964-974.
4. Armstrong N, Kalceff W. A maximum entropy method for determining column-length distributions from size-broadened X-ray diffraction profiles. Journal of Applied Crystallography. 1999;32(4):600-613. 5. van Berkum JGM, Vermeulen AC, Delhez R, de Keijser TH,
Mittemeijer EJ. Applicabilities of the Warren-Averbach Analysis and an Alternative Analysis for Separation of Size and Strain Broadening.
Journal of Applied Crystallography. 1994;27(3):345-357.
6. van Berkum JGM, Delhez R, de Keijser TH, Mittemeijer EJ. Diffraction-Line Broadening due to Strain Fields in Materials; Fundamental Aspects and Methods of Analysis.
Acta Crystallographica Section A. 1996;52(5):730-747.
7. Warren BE, Averbach BL. The Effect of Cold-Work Distortion on X-Ray Patterns. Journal of Applied Physics. 1950;21(6):595-598. 8. Scardi P, Leoni M. Diffraction line profiles from polydisperse crystalline
systems. Acta Crystallographica Section A. 2001;57(5):604-613. 9. Kojdecki MA, Bastida J, Pardo P, Amorós P. Crystalline
microstructure of sepiolite influenced by grinding. Journal of
Applied Crystallography. 2005;38(6):888-899.
10. Wilson AJC. X-ray Optics: The Diffraction of X-rays by Finite
and Imperfect Crystals. London: Methuen; 1962.
11. Ida T, Toraya H. Deconvolution of the instrumental functions in powder X-ray diffractometry. Journal of Applied Crystallography. 2002;35(1):58-68.
12. Dykhne T, Taylor R, Florence A, Billinge SJL. Data requirements for the reliable use of atomic pair distribution functions in
amorphous pharmaceutical fingerprinting. Pharmaceutical
Research. 2011;28(5):1041-1048.
13. Nyquist H. Certain topics in telegraph transmission theory.
Proceedings of the IEEE. 2002;90(2):280-305.
14. Scardi P, Leoni M. Whole powder pattern modelling. Acta
Crystallographica Section A. 2002;58(Pt 2):190-200. 15. Scardi P, Ortolani M, Leoni M. WPPM: Microstructural
Analysis beyond the Rietveld Method. Materials Science
Forum. 2010;651:155-171.
16. Langford JI, Wilson AJC. Scherrer after sixty years: A survey and some new results in the determination of crystallite size.
Journal of Applied Crystallography. 1978;11(2):102-113. 17. Scardi P, Leoni M, Beyerlein KR. On the modelling of the
powder pattern from a nanocrystalline material. Zeitschrift für Kristallographie. 2011;226(12):924-933.
18. Le Bail A, Louër D. Smoothing and validity of crystallite-size distributions from X-ray line-profile analysis. Journal of Applied Crystallography. 1978;11(1):50-55.
19. Coelho A. Topas Academic Version 5 Technical Reference
[Internet]; 2012. Available from: <http://www.topas-academic. net/>. Access in 23/02/2018.
20. Carslaw HS. A historical note on Gibbs' phenomenon in Fourier's
series and integrals. Bulletin of the American Mathematical
Society. 1925;31(8):420-424.
21. Kelly SE. Gibbs Phenomenon for Wavelets. Applied and
Computational Harmonic Analysis. 1996;3(1):72-81. 22. Balzar D, Audebrand N, Daymond MR, Fitch A, Hewat A,
23. Balzar D. Size/Strain Round Robin [Internet]; 2004. Available from: <http://mysite.du.edu/~balzar/s-s_rr.htm>. Access in 02/02/2018. 24. Scardi P, Leoni M. Line profile analysis: pattern modelling
versus profile fitting. Journal of Applied Crystallography.
2006;39(1):24-31.
25. Armstrong N, Kalceff W, Cline JP, Bonevich J. A Bayesian/ Maximum Entropy Method for the Certification of a Nanocrystallite-Size NIST Standard Reference Material. In: Mittemeijer EJ
and Scardi P, eds. Diffraction Analysis of the Microstructure