Article
J. Braz. Chem. Soc., Vol. 29, No. 11, 2441-2448, 2018 Printed in Brazil - ©2018 Sociedade Brasileira de Química*e-mail: [email protected]
Simultaneous
Determination
of
Four
Antibiotics
in
Raw
Milk
by
UPLC-MS/MS
Using
Protein
Precipitation
as
Sample
Preparation:
Development,
Validation,
and
Application
in
Real
Samples
ThiagoMagon,aRobertadaSilveira,aMaríliaB.Galuch,bEderPauloFagan,c
AnaFlaviaD.Feitoza,cSylvioV.Palombini,bOscarO.Santosband
JesuiV.Visentainer*,b
aPrograma de Pós-Graduação em Ciências de Alimentos, Universidade Estadual de Maringá,
Av. Colombo 5790, 87020-900 Maringá-PR, Brazil
bDepartamento de Química, Universidade Estadual de Maringá,
Av. Colombo 5790, 87020-900 Maringá-PR, Brazil
cDepartamento de Veterinária e Produção Animal, Universidade Estadual do Norte do Paraná,
Av. Getulio Vargas 850, 86400-000 Bandeirantes-PR, Brazil
In this study, a rapid and simple analytical method was proposed, based on protein precipitation as sample preparation for simultaneous determination of tetracycline, oxytetracycline, penicillin G and ceftiofur in raw milk by ultra-performance liquid chromatography tandem mass spectrometry (UPLC-MS/MS). The method was applied to raw milk samples from dairy cows medicated with tetracycline for subclinical mastitis. Samples were collected from the adjacent teat to the teat treated with tetracycline of eight different cows at 24, 48, 72 and 96 h after treatment. The limits of quantification of the proposed method ranged between 1 and 5 ng g-1 and limits of detection
ranged between 0.1 and 0.5 ng g-1. The recoveries ranged from 61 to 111% and the linear range
was 1 to 2064 ng g-1 for tetracycline and oxytetracycline, and 5 to 2064 ng g-1 for penicillin G
and ceftiofur. Approximately 75 and 63% of the treated animals revealed more tetracycline than legally recommended at 72 and 96 h since last treatment, respectively.
Keywords: raw milk, antibiotic residues, protein precipitation, mass spectrometry, mastitis
Introduction
Brazil is one of the largest milk producers, ranking in the sixth position in 2015,1 behind the European Union,
USA, China, Russia and India, the biggest milk-producing country.2 Milk is a complex food, containing high-quality
proteins, amino acids, vitamins, minerals, and lipids, with unique health benefits.3 Consequently, milk and
dairy products contribute substantially to our daily diet.4
However, its composition has a dynamic nature, varying according to the stage of lactation, age, breed, nutrition, energy balance and udder health status.5 Consumers are
extremely aware of the association between food and health, increasing the healthy food market as consequence.3
Bovine mastitis, an endemic disease,6 is one of the
most costly and frequently occurring disease that affects
dairy cattle,6-8 decreasing the milk quality. It is associated
with the action of various bacteria,9 resulting in mammary
glands inflammation.10 The usage of antimicrobial during
the lactating period is common in the farmers.9 Among
it, tetracycline is the most common antibiotic used to prevent and control mastitis, due to its low cost and broad spectrum of activity.11 However, the extensive and misuse
of antibiotics by veterinarians and farmers in dairy cattle, contribute to the existence of marketed dairy products containing antibiotics. These products probably induce an antibiotic resistance in human beings, as well as the formation of antibiotic-resistant strains of bacteria.12
Thus, it is essential to monitor antibiotics residues in raw milk by selective, sensitive, precise and accurate analytical methods. Liquid chromatography (LC) is the most frequently used instrumental analytical technique for determination of antibiotic residues in milk samples.13 Many analytical
(HPLC) or ultra-performance liquid chromatography (UPLC), coupled with fluorescence,14,15 ultraviolet16,17 and
diode array detection.18,19 However, LC-mass spectrometry
(MS),18,20,21 based on triple quadrupole,22,23 ion trap,24
and quadrupole-orbitrap25,26 systems have been replacing
the aforementioned detection methods for unequivocal detections.13 Additionally, electrochemical methods,27 room
temperature phosphorescence detection28 and capillary
electrophoresis29 are also employed for such determinations.
Due to the low concentrations of antibiotics in milk, sample preparation methods are typically required for pre-concentration of the analytes and the elimination of interferents. These methods are QuEChERS (quick, easy, cheap, effective, rugged and safe),13 dispersive liquid-liquid
microextraction,30,31 matrix solid-phase microextraction,32
molecularly imprinted solid phase extraction,18,33 magnetic
dispersive solid phase extraction,32 hollow fiber liquid phase
microextraction,34 salting out supported liquid extraction,25
and precipitation of proteins, followed by solid-phase extraction.35
Considering the monitoring of residual antibiotics in milk as essential for public health and studies regarding dairy cow management, this work developed and validated a direct and rapid analytical method for the simultaneous and routine determination of four antibiotics (tetracycline, oxytetracycline, penicillin G, and ceftiofur) in bovine raw milk by UPLC-MS/MS, requiring simply protein precipitation and centrifugation step for the sample preparation. Furthermore, the method was applied to real samples. Its validation was based on the Food and Drug Administration guideline36 and 2002/657/EC European
Commission37 decision norms.
Experimental
Chemicals and reagents
Tetracycline (purity ≥ 98%), oxytetracycline (purity ≥ 95%), penicillin G (purity ≥ 96%) and ceftiofur (purity ≥ 95%) were purchased from Sigma-Aldrich (St. Louis, MO, USA). Formic acid (98%) was procured from Millipore-Sigma (Darmstadt, Germany). Methanol (HPLC-grade) and acetonitrile (HPLC-grade) were obtained from Panreac (Barcelona, Spain). Ultrapure water was supplied through a Milli-Q system (Millipore, Bedford, USA).
Instrumentation
Samples were injected into an Acquity UPLC® H-class
system (Milford, MA, USA) coupled to a triple quadrupole
Xevo TQDTM (Milford, MA, USA) mass spectrometer,
equipped with a Waters ZsprayTM electrospray ionization
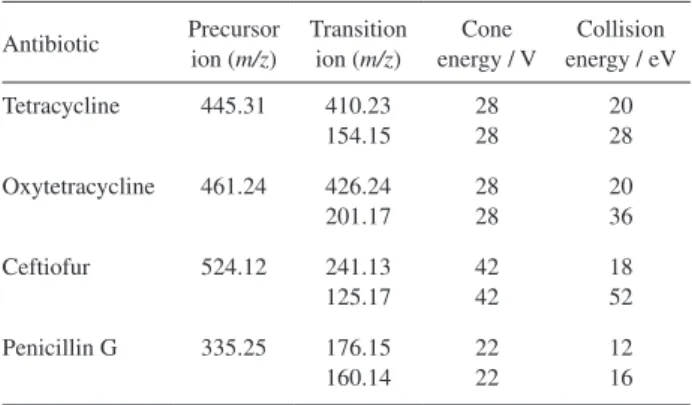
(ESI) source (Milford, MA, USA). Mobile phases were composed of ultrapure water acidified with 0.1% formic acid (A) and methanol (B). MS was operated in positive ion mode using the following conditions: 3 kV capillary voltage; cone voltage depending on the molecule (Table 1); 350 °C desolvation gas temperature, and 750 L h-1
desolvation gas flow, at 3.5 mbar collision gas pressure. Antibiotics were separated on an Acquity UPLC® bridged
ethane hybrid (BEH) C18 column (50 × 2.1 mm, 1.7 µm). The gradient program used a flow rate of 0.3 mL min-1,
with 60A:40B from 0-0.3 min, 60A:40B to 5A:95B from 0.3-0.9 min, 5A:95B to 60A:40B from 0.9-2.5 min, giving a total run time of 2.5 min. The column was maintained at 40 °C, and the injection volume was 0.4 µL. Calibration curves were constructed using the best fit of three replicated determinations per concentration level, with nine concentration points. The data were processed using MassLynxTM 4.1 (Milford, MA, USA) software, and
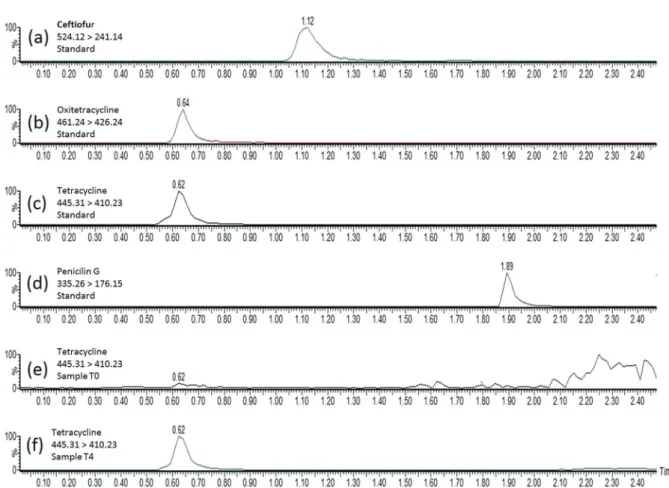
the results were expressed as ng mL-1. Figure 1 shows the
multiple-reaction-monitoring (MRM) chromatograms obtained for the milk matrix spiked with antibiotics standards at the concentration of 10 ng g-1 and for the milk
samples from the cow treated with tetracycline in T0 and in T4.
Selection of animals
The procedures involving animals were in accordance to the Ethical Principals in Animal Research (12/2017) and the Brazilian College of Animal Experimentation. It was also approved by the Ethics Committee of the State University of the North of Parana, Brazil.
Eight lactating cows with subclinical mastitis were selected. Before milking, the animals underwent the California mastitis test and somatic cell count38 to determine
the real occurrence of it.
Table1. UPLC-MS/MS parameters for the antibiotics
Antibiotic Precursor ion (m/z)
Transition ion (m/z)
Cone energy / V
Collision energy / eV
Tetracycline 445.31 410.23 154.15
28 28
20 28
Oxytetracycline 461.24 426.24 201.17
28 28
20 36
Ceftiofur 524.12 241.13 125.17
42 42
18 52
Penicillin G 335.25 176.15 160.14
22 22
Treatment
An intramammary infusion of 200 mg tetracycline, 365 mg neomycin sulfate, 28 mg bacitracin, 10 mg prednisolone and 8 g vehicle were administrated. It was injected into only one mammary quarter of each animal, after antisepsis of the teat with 70% alcohol. Tetracycline was chosen based on its wide use for mastitis treatment and its efficacy against Staphylococcus spp.39 The withdrawal
period of the drug recommended by the manufacturer is 72 h after the last application.
Collection of milk samples
For detection of tetracycline residues, milk samples were collected from the adjacent teat to the teat treated with tetracycline. Before milking, it was cleaned with water and dried using a disposable paper towel. Samples were collected before the beginning of the tetracycline treatment, to confirm the absence of antimicrobial residues in the milk and at 24, 48, 72 and 96 h after treatment, with three replications, totaling 120 samples collected. After milking, 5% iodine solution was used to disinfect the teats. All samples were stored at –20 °C until analysis.
Preparation of standard curves
Matrix-matched calibration curves were obtained spiking the antibiotics standards in blank milk samples (commercial milk). The stock standard solutions of each antibiotic were prepared by dissolving 6.0 mg in aqueous methanol (50% v v-1) to obtain a final volume of 10.0 mL.
A second dilution was carried out in milk to obtain the concentration levels for the construction of the calibration curve.
Method evaluation
The limit of detection (LOD) and limit of quantification (LOQ) of the proposed method were obtained through the signal-to-noise ratio (S/N) of 3 and 10, respectively, from the chromatograms of the spiked antibiotics standards in blank milk sample.
The accuracy was evaluated through recovery assays. Recovery was calculated spiking blank milk sample before and after the extraction procedure in the same concentration (10, 258 and 1032 ng g-1, with three replicates each). The
precision was evaluated as the coefficient of variation (CV, in percentage) of spiked blank milk sample in antibiotics
Figure1. Multiple-reaction-monitoring chromatograms obtained from: (a-d) milk matrix spiked with antibiotics standards at the concentration of 10 ng g-1;
concentrations of 10, 258 and 1032 ng g-1, in three replicates
each.
Sample preparation
500.0 µL of homogenized raw milk sample were added in 1.5 mL polypropylene Eppendorf tube, followed by the addition of 1.0 mL of cold acetonitrile. The mixture was vortexed (Phox MX S1, Curitiba, Brazil) for 10 s and centrifuged at 3000 rpm for 5 min. 500.0 µL of the supernatant was transferred to a vial, 0.4 µL of this solution was injected into the UPLC-MS/MS system under multiple reaction monitoring (MRM) with conditions optimized for each compound.
Results and Discussion
Sample extraction
The proposed analytical method is of considerable relevance and provides several advantages: it eliminates high costs of sample preparation, once the protein precipitation does not require special apparatus, adsorbents, fibers, syringes or cartridges. It also demands little sample manipulation, reducing the risk of errors associated with quantification. Moreover, the great time-saving advantage of the developed method is further justified when it comes to quality control routine analyses, in which many samples are analyzed. The extraction method
was developed maximizing the protein precipitation in milk and separation of components, resulting in a rapid extraction and reproducibility at LOD and LOQ. In contrast to other procedures current established,40 this study added
cold acetonitrile to precipitate the proteins and separate some lipids. With this procedure, it is possible that other interferences may prejudice the extraction and molecule ionization while using MS.
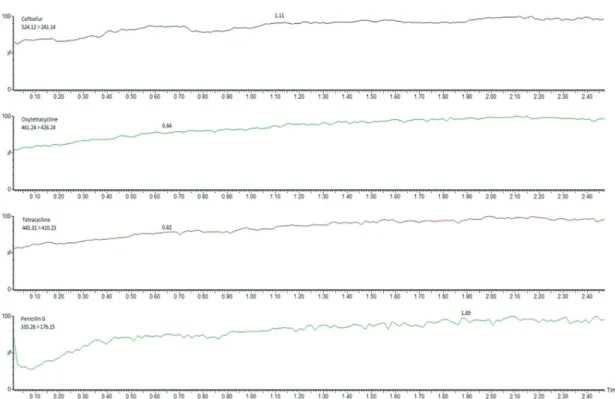
Consequently, aiming to evaluate the extraction efficiency and the presence of possible interferences, it was used the post-column infusion of analyte as it is a fast and easy technique that can be used to qualitatively identify regions of ion suppression or enhancement. In this technique, the sample is injected into the UPLC column using the LC-MS/MS method for the specific analyte, while a steady flow of that same analyte is infused into the effluent flow between the column and the mass spectrometer source. Additionally, a blank solution, such as water, buffer, or the initial mobile phase mixture, must also be injected to determine the baseline for the analysis. The regions of suppression or enhancement can be visualized in the resulting chromatograms. The degree effect depends on the concentration of the analyte being infused; if its concentration is too high, matrix effects could be masked. Any regions of enhancement or suppression must be compared with the retention time of the analyte41 by
comparing the baseline obtained from the blank with each of the matrices tested (Figure 2).
As can be observed in this experiment, only at the beginning of each chromatogram there is an unidentified drop followed by a stabilization of the signal (Figure 2). Penicillin G displayed a 40% drop, confirming that the quantification of analytes eluting in the initial column volume is not recommended. Therefore, aiming for a better understanding of the interferences behavior distribution, MS profiles (Figure 3) were developed to prove how the protein precipitation could solve the interference problem in the antibiotics mass region studied (300-525 m/z).
LC-MS/MS
The conditions encountered to develop the quantification method for β-lactam and tetracycline antibiotics were designed to present the least possible running time with a lower amount of solvent in comparison to conventional methods.42,43 The addition of an ion modulator was also
minimal; 0.1% of formic acid for better ionization in the positive mode, with a total run time of 2.5 min at a flow rate of 0.3 mL min-1. Injection volume is significant, once the
amount of sample is directly linked to the chromatographic resolution between the different classes of antibiotics analyzed. Optimal injection volumes are directly related to the column cylinder volume and are dependent on the
cross-sectional area and length of the column. It is possible to calculate the maximum injection volume for a given chromatographic column support, using the following formula:
Vmax = (πr2 × C)(0.01) (1)
where Vmax is the maximum volume for injection, r is the column radius, and C is the chromatographic column length (mm), which is associated to the Van Deemter equation.44 For Waters BEH column, the maximum
injection volume is 1.8 µL when the formula is applied, although this work used a 4.3-fold lower (0.4 µL) injection volume, evidencing the high-resolution capacity between the various molecules and contributing to the method effectiveness in minimizing matrix interference. Dwell time is also essential and it was achieved according to the MassLynx 4.1 software manual. Hence, a specific dwell time was determined for each analyte, leading to extreme detection limits for the particular LC-MS/MS system. The contribution of other chromatographic parameters and the mass spectrometer were determinant to reach the best sensitivity for quantification of the antibiotics.
LC-MS/MS operated in MRM mode, which is the analytical method of choice to determine and quantify drugs and their metabolites in biological fluids and tissues. An LC-MS/MS method requires a robust MRM method; it is pivotal to determine whether the compound of interest will ionize, and if it does, understand the greatest condition to ionize and also obtain consistent m/z value (parent or daughter ion) that will offer substantial sensitivity and selectivity.45 Table 1 presents the parameters found for the
method development using Acquity UPLC® H-class and
MS Xevo TQDTM.
Validation procedure
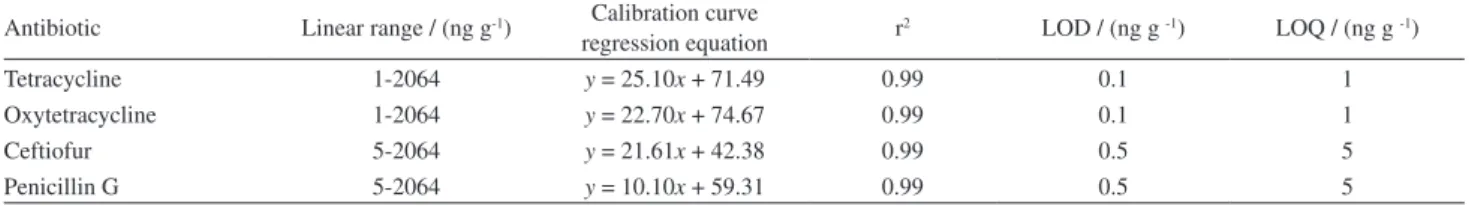
Table 2 shows the calibration curve parameters and Table 3 shows the recovery (in percentage) and precision (CV, in percentage) of the proposed method for determination of tetracycline, oxytetracycline, ceftiofur and penicillin G in raw milk samples.
Figure3. Blank milk mass spectrum.
Table2. Calibration curve parameters of the proposed method for determination of tetracycline, oxytetracycline, ceftiofur and penicillin G in raw milk samples
Antibiotic Linear range / (ng g-1) Calibration curve
regression equation r2 LOD / (ng g -1) LOQ / (ng g -1)
Tetracycline 1-2064 y = 25.10x + 71.49 0.99 0.1 1
Oxytetracycline 1-2064 y = 22.70x + 74.67 0.99 0.1 1
Ceftiofur 5-2064 y = 21.61x + 42.38 0.99 0.5 5
Penicillin G 5-2064 y = 10.10x + 59.31 0.99 0.5 5
The proposed technique presents excellent precision (Table 3), once the coefficient of variation (CV, in percentage) is less than 15%, and high linearity (r2 greater
than 0.99) (Table 2) within the various investigated concentration ranges for tetracycline (1-2064 ng g-1) and
β-lactams (5-2064 ng g-1). Also, low LOD and LOQ were
achieved, important for the non-saturation of the column (i.e., extends its lifespan).
Antibiotics usage in food-producing animals is closely monitored due to the potential adverse effects in humans, as result, food produced by animals undergoes quantitative analysis for antibiotic residues. One of the major issues of LC-MS/MS analysis when handling complex samples, such as milk, is the matrix effect. Thus, testing milk for antibiotics traditionally involves sample clean-up steps to minimize matrix interference.30 The matrix effect test
allowed determining the matrix interference in response to the variation of the interest compounds. The experiment was carried out firstly finding the mass spectrometer stabilization
according to the constant signal of each antibiotic analyzed combined with blank. Hence, the analyte signal strength may increase or decrease according to the matrix effect in the specific retention time. Results obtained according to the post infusion experiment could confirm that in the retention times 0.62, 0.64, 1.11 and 1.89 min were not observed any interference in the analytes signal.
No interferences were observed in the analytical signal for all antibiotics analyzed. Moreover, the easy sample preparation approach is considered to be effective for the elimination of matrix interference and ionization inhibitors, using ESI in positive mode.
LC-MS combines high selectivity and chromatography efficiency. Sensitivity is a prime advantage of MS, allowing the mass spectra achievement of trace level compounds (either one or both low sample amount and low concentration) in the timeframe of chromatographic elution times.46 Thus, this method confers high sensitivity,
high selectivity, and good applicability. Besides, this new developed method shows new trends in analytical development when compared to other methods, mainly related to its simple sample preparation, since only protein precipitation and centrifugation steps are used, and no additional clean-up steps are required.
Method applicability to real samples
The analytical method proposed was used to evaluate the presence of tetracycline in raw milk of animals with subclinical mastitis. The study intended to verify if tetracycline has permeability between the treated teat and the adjacent teat on the same side, as well as to quantify its residue in raw milk. The manufacturer of the drug recommends discarding the milk in the first 3 days after the end of the treatment, so the sample evaluation was performed for 4 days after the treatment.
According to Table 4, tetracycline concentrations are higher than maximum residue limit (MRL) in the milk
Table3. Recovery and precision of the proposed method for determination of tetracycline, oxytetracycline, ceftiofur and penicillin G in raw milk samples
Antibiotic
Spiked concentration /
(ng g-1)
Precision
(CV) / % Recovery / %
Tetracycline
10 11.7 61
258 11.1 63
1032 1.6 69
Oxytetracycline
10 12.7 72
258 10.3 73
1032 1.3 73
Ceftiofur
10 6.6 88
258 5.0 111
1032 1.6 91
Penicillin G
10 3.0 61
258 5.4 66
1032 1.0 67
CV: coefficient of variation.
Table4. Tetracycline concentration in milk collected from the adjacent teat to the treated teat
Cows treated (n) T0 / (ng g-1) T1 / (ng g-1) T2 / (ng g-1) T3 / (ng g-1) T4 / (ng g-1)
1 ≤ LOD 8643 1493 282 105
2 ≤ LOD 6265 2271 902 372
3 ≤ LOD 6848 1764 1397 161
4 ≤ LOD 4729 894 229 108
5 ≤ LOD 3192 295 176 112
6 ≤ LOD 2795 1128 88 12
7 ≤ LOD 979 198 88 15
8 ≤ LOD 279 195 138 13
from all animals on the first and second day after treatment; only in two animals on the third day the allowed limit was reached, but there is variation according to each animal. However, it was possible to determine that the tetracycline concentration in milk from the adjacent teat to the treated with tetracycline before the fourth day of treatment is higher than the maximum residue limits (MRLs) recommended by European Union (EU)47 for antibiotics in animal products,
such as milk. Table 4 reveals that 37.5% of the animals showed residues of tetracycline antibiotics below the MRL in T4. Therefore, it is evident in this work that the consumption of milk from the adjacent teat to the treated with tetracycline, when the animal develops subclinical mastitis, is limited to at least 4 days of milk discharge.
Conclusions
The LC-ESI-MS/MS method developed to monitor the presence of particular antibiotics in milk demonstrated simplicity and high precision. Besides, the rapid sample preparation avoided extensive steps, proving to be easy and requiring only small amounts of sample and solvent, which is a great cost-benefit. Moreover, the proposed method was validated based on the European Union and FDA regulations criteria. Finally, the method was applied to determine tetracycline residue in real milk samples of cows with clinical mastitis. Tetracycline residues were present even after 96 h of the treatment, evidencing that these milks should not be mixed with residue-free-milk for posterior commerce.
Acknowledgments
This work was supported by the Fundação Araucária, Conselho Nacional de Desenvolvimento Científico e Tecnológico (CNPq), and Coordenação de Aperfeiçoamento de Pessoal de Nível Superior (CAPES).
References
1. GAIN Report Number BR16023: Brazil - Exporter Guide; USDA Foreign Agricultural Service, Global Agricultural Information Network, 2016. Available at https://gain.fas.usda. gov/Recent GAIN Publications/Exporter Guide_Sao Paulo ATO_Brazil_12-29-2016.pdf, accessed on October 11, 2017. 2. National Dairy Development Board (NDDB); Annual Report
2015-2016; NDDB: Anand, 2016. Available at http://www.nddb. org/sites/default/files/NDDB_AR_2015-16Eng.pdf, accessed on October 11, 2017.
3. Haug, A.; Høstmark, A. T.; Harstad, O. M.; Lipids Health Dis. 2007, 6, 25.
4. Upadhyay, N.; Goyal, A.; Kumar, A.; Ghai, D. L.; Singh, R.;
Food Rev. Int. 2014, 30, 203.
5. Keenan, T. W.; Patton, S. In Handbook of Milk Composition; Jensen, R. G., ed.; Academic Press: London, 1995, p. 5-50. 6. Halasa, T.; Huijps, K.; Østerås, O.; Hogeveen, H.; Vet. Q. 2007,
29, 18.
7. Getaneh, A. M.; Mekonnen, S. A.; Hogeveen, H.; Prev. Vet.
Med. 2017, 138, 94.
8. Espeche, M. C.; Pellegrino, M.; Frola, I.; Larriestra, A.; Bogni, C.; Nader-Macías, M. E. F.; Anaerobe 2012, 18, 103. 9. Ikiz, S.; Başaran, B.; Bingöl, E. B.; Çetin, Ö.; Kaşikçi, G.;
Özgür, N. Y.; Uçmak, M.; Yilmaz, Ö.; Gündüz, M. C.; Sabuncu, A.; Turk. J. Vet. Anim. Sci. 2013, 37, 569.
10. Batavani, R. A.; Asri, S.; Naebzadeh, H.; Iran. J. Vet. Res. 2007, 8, 205.
11. Kuang, Y.; Jia, H.; Miyanaga, K.; Tanji, Y.; Appl. Microbiol. Biotechnol. 2009, 84, 135.
12. Economou, V.; Gousia, P.; Infect. Drug Resist. 2015, 8, 49. 13. Aguilera-Luiz, M. M.; Vidal, J. L. M.; Romero-González, R.;
Frenich, A. G.; J. Chromatogr. A 2008, 1205, 10.
14. Du, D.; Dong, G.; Wu, Y.; Wang, J.; Gao, M.; Wang, X.; Li, Y.;
Anal. Methods 2014, 6, 6973.
15. Kargin, I. D.; Sokolova, L. S.; Pirogov, A. V.; Shpigun, O. A.;
Inorg. Mater. 2016, 52, 1365.
16. Lv, Y.-K.; Zhang, J.-Q.; Guo, Z.-Y.; Zhang, W.; Sun, H.-W.;
J. Liq. Chromatogr. Relat. Technol. 2015, 38, 1.
17. Shariati, S.; Yamini, Y.; Esrafili, A.; J. Chromatogr. B: Anal.
Technol. Biomed. Life Sci. 2009, 877, 393.
18. Baeza, A. N.; Urraca, J. L.; Chamorro, R.; Orellana, G.; Castellari, M.; Moreno-Bondi, M. C.; J. Chromatogr. A 2016, 1474, 121.
19. Bilandžić, N.; Kolanović, B. S.; Varenina, I.; Scortichini, G.; Annunziata, L.; Brstilo, M.; Rudan, N.; Food Control 2011, 22, 1941.
20. Jank, L.; Martins, M. T.; Arsand, J. B.; Hoff, R. B.; Barreto, F.; Pizzolato, T. M.; Food Addit. Contam., Part A 2015, 32, 1. 21. Junza, A.; Amatya, R.; Barrón, D.; Barbosa, J.; J. Chromatogr.
B: Anal. Technol. Biomed. Life Sci. 2011, 879, 2601. 22. Gaugain-Juhel, M.; Delépine, B.; Gautier, S.; Fourmond, M. P.;
Gaudin, V.; Hurtaud-Pessel, D.; Verdon, E.; Sanders, P.; Food Addit. Contam., Part A 2009, 26, 1459.
23. Tang, Y. Y.; Lu, H. F.; Lin, H. Y.; Shih, Y. C.; Hwang, D. F.; J. Chromatogr. B: Anal. Technol. Biomed. Life Sci. 2012, 881-882, 12.
24. Cheng, C.; Liu, L.-C.; Anal. Methods 2014, 6, 1581. 25. Kaufmann, A.; Butcher, P.; Maden, K.; Walker, S.; Widmer, M.;
Anal. Chim. Acta 2014, 820, 56.
26. Moretti, S.; Cruciani, G.; Romanelli, S.; Rossi, R.; Saluti, G.; Galarini, R.; J. Mass Spectrom. 2016, 792.
28. Traviesa-Alvarez, J. M.; Costa-Fernández, J. M.; Pereiro, R.; Sanz-Medel, A.; Anal. Chim. Acta 2007, 589, 51.
29. Piñero, M. Y.; Garrido-Delgado, R.; Bauza, R.; Arce, L.; Valcárcel, M.; Electrophoresis 2012, 33, 2978.
30. Junza, A.; Dorival-García, N.; Zafra-Gómez, A.; Barrón, D.; Ballesteros, O.; Barbosa, J.; Navalón, A.; J. Chromatogr. A 2014, 1356, 10.
31. Karami-Osboo, R.; Miri, R.; Javidnia, K.; Kobarfard, F.; Iran. J. Pharm. Res. 2016, 15, 361.
32. Huang, S.; Gan, N.; Liu, H.; Zhou, Y.; Chen, Y.; Cao, Y.; J. Chromatogr. B 2017, 1060, 247.
33. Soledad-Rodríguez, B.; Fernández-Hernando, P.; Garcinuño-Martínez, R. M.; Durand-Alegría, J. S.; Food Chem. 2017, 224, 432.
34. Tajabadi, F.; Ghambarian, M.; Yamini, Y.; Yazdanfar, N.; Talanta
2016, 160, 400.
35. Stolker, A. A. M.; Rutgers, P.; Oosterink, E.; Lasaroms, J. J. P.; Peters, R. J. B.; Van Rhijn, J. A.; Nielen, M. W. F.; Anal. Bioanal. Chem. 2008, 391, 2309.
36. Food and Drug Administration (FDA); Bioanalytical Method Validation, Guidance for Industry; FDA: Silver Spring, 2018. Available at https://www.fda.gov/downloads/drugs/guidances/ ucm070107.Pdf, accessed in June 2018.
37. EC 2002/657/EC: Commission Decision of 12 August 2002 Implementing Council Directive 96/23/EC Concerning the
Performance of Analytical Methods and the Interpretation of Results, Official Journal of the European Communities, 2002. Available at https://publications.europa.eu/en/publication-detail/-/publication/ed928116-a955-4a84-b10a-cf7a82bad858/ language-en, accessed on October 10, 2017.
38. Sargeant, J. M.; Leslie, K. E.; Shirley, J. E.; Pulkrabek, B. J.; Lim, G. H.; J. Dairy Sci. 2001, 84, 2018.
39. Medeiros, E. S.; Mota, R. A.; Santos, M. V.; Freitas, M. F. L.; Pinheiro Júnior, J. W.; Teles, J. A. A.; Pesqui. Vet. Bras. 2009, 29, 569.
40. Freitas, A.; Barbosa, J.; Ramos, F.; Int. Dairy J. 2013, 33, 38. 41. http://bruker.poznan.pl/images/stories/Daltonics/noty/lcms100.
pdf, accessed on October 17, 2017.
42. Olatoye, I. O.; Oluwayemisi, D. F.; Ishola, S. A.; Vet. World
2016, 9, 948.
43. Pena, A.; Lino, C. M.; Alonso, R.; Barcelo, D.; J. Agric. Food
Chem. 2007, 55, 4973.
44. Van Deemter, J. J.; Zuiderweg, F. J.; Klinkenberg, A.; Chem.
Eng. Sci. 1956, 5, 271.
45. h t t p : / / w w w. w a t e r s . c o m / w e b a s s e t s / c m s / l i b r a r y / docs/720002710en.pdf, accessed on October 17, 2017. 46. Vékey, K.; J. Chromatogr. A 2001, 921, 227.
47. Commission Regulation (EU) No. 37/2010 of 22 December 2009 on Pharmacologically Active Substances and Their
Classification Regarding Maximum Residue Limits in Foodstuffs of Animal Origin, Official Journal of the European Union, 2010. Available at https://ec.europa.eu/health/sites/health/files/files/ eudralex/vol-5/reg_2010_37/reg_2010_37_en.pdf, accessed on October 11, 2017.
Submitted: February 14, 2018
Published online: June 25, 2018