Mestre em Biologia Celular e Molecular
Biophysical modulation of cell fate through
chromatin remodelling
Dissertação para obtenção do Grau de Doutor em Bioengenharia
Orientador: Doutor Ricardo Neves, Investigador Auxiliar,
Universidade de Coimbra
Co-orientador: Professor Doutor Tariq Enver, Professor
Catedrático, University College of London
Co-orientador: Doutor Manuel Luís Magalhães Nunes da Ponte,
Professor Catedrático, Faculdade de Ciências e Tecnologia da
Universidade Nova de Lisboa
Júri:
Presidente: Doutor José Paulo Barbosa Mota, Professor Catedrático da Faculdade de Ciências e Tecnologia da Universidade Nova de Lisboa
Arguentes: Doutor Pedro Jorge Gomes Teodósio Castelo Branco, Professor Auxiliar do Centro de Investigação – CBMR da Universidade do Algarve
Doutor Carlos Filipe Ribeiro Lemos Pereira, Investigador Auxiliar do Centro de Neurociências e Biologia Celular da Universidade de Coimbra Vogais: Doutor Ricardo Neves Pires das Neves, Investigador Auxiliar do Centro
de Neurociências e Biologia Celular da Universidade de Coimbra
Doutor José Eduardo Marques Bragança, , Professor Auxiliar do Centro de Investigação – CBMR da Universidade do Algarve
Doutora Paula Maria Marques Leal Sanches Alves, Professora Associada Convidada da Faculdade de Ciências e Tecnologia da Universidade Nova de Lisboa
Mestre em Biologia Celular e Molecular
Biophysical modulation of cell fate through
chromatin remodelling
Dissertação para obtenção do Grau de Doutor em Bioengenharia
Orientador: Doutor Ricardo Neves, Investigador Auxiliar,
Universidade de Coimbra
Co-orientador: Professor Doutor Tariq Enver, Professor
Catedrático, University College of London
Co-orientador: Doutor Manuel Luís Magalhães Nunes da Ponte,
Professor Catedrático, Faculdade de Ciências e Tecnologia da
Universidade Nova de Lisboa
Júri:
Presidente: Doutor José Paulo Barbosa Mota, Professor Catedrático da Faculdade de Ciências e Tecnologia da Universidade Nova de Lisboa
Arguentes: Doutor Pedro Jorge Gomes Teodósio Castelo Branco, Professor Auxiliar do Centro de Investigação – CBMR da Universidade do Algarve
Doutor Carlos Filipe Ribeiro Lemos Pereira, Investigador Auxiliar do Centro de Neurociências e Biologia Celular da Universidade de Coimbra Vogais: Doutor Ricardo Neves Pires das Neves, Investigador Auxiliar do Centro
de Neurociências e Biologia Celular da Universidade de Coimbra Doutor José Eduardo Marques Bragança, , Professor Auxiliar do Centro de Investigação – CBMR da Universidade do Algarve
Doutora Paula Maria Marques Leal Sanches Alves, Professora Associada Convidada da Faculdade de Ciências e Tecnologia da Universidade Nova de Lisboa
Biophysical modulation of cell fate through chromatin remodelling
Copyright © Ana Francisca Silva de Lima, Faculdade de Ciências e Tecnologia, Universidade Nova de Lisboa.
A Faculdade de Cièncias e Tecnologia e a Universidade Nova de Lisboa tern o direito, perpétuo e sem limites geográficos, de arquivar e publicar esta dissertação através de exemplares impressos reproduzidos em papel ou de forma digital, ou por qualguer outro meio conhecido ou que venha a ser inventado, e de a divulgar atraves de repositórios cientificos e de admitir a sua copia e distflbuição corn objectivos educacionais ou de investigação, não comerciais, desde que seja dado crédito ao autor e editor.
This work was partially funded by the individual scholarship SFRH/BD/51942/2012 and the project PTDC/SAU-ENB/113696/2009, both from the Portuguese Foundation for Science and Technology (FCT).
i
Acknowledgments
Above all, my PhD was a challenging and wonderful trip. It would had been impossible to go through all the steps without the support of bright scientific minds, good people and a “blessed family” that were always around.
I would like to thank the MIT-Portugal Program and Fundação para a Ciência e Tecnologia for the funding given for this PhD thesis work. I would like to thank all the MIT-Portugal Program coordination and the Universities involved in the program, with special thanks to Faculdade de Ciências e
Tecnologia da Universidade Nova de Lisboa. I am grateful for the opportunity to learn in different
scenarios all over the country and the opportunity to be in contact with international experts. Additionally, I would like to thank, for the help in all critical moments, Professor Manuel Nunes da Ponte and Professor José Silva Lopes.
I would like to thank my supervisor, Professor Ricardo Neves for his influence in my scientific perception. Thank you for teaching me and encouraging me to be always critical and par my work to high scientific standards. I am grateful for the collaboration opportunities you gave me through our international partners.
I would also like to thank all the Stem cells and tissue engineering Unit members from Centre for Neuroscience and Cell Biology (University of Coimbra) who have made my daily laboratory work an enjoyable experience even during “dark” times. I would like to thank Professor Lino Ferreira for the support given towards the development of my work. My special thanks to Adrián Jiménez, Diana Santos, Emanuel Quartin, Hugo Azevedo, João Monteiro, João Santos, Josephine Blersch, Luis Estronca, Maria Helena, Michela Comune, Miguel Lino, Pedro Gouveia, Renato Cardoso, Susana Pereira, Susana Simões and Vitor Francisco. Couldn’t go without thanking “the musketeers” Catarina Almeida, Inês Honório, Patrícia Pitrez, Sandra Pinto, Susana Rosa for the joyful moments in the lab and for their friendship.
I would like to thank our collaborators in Centro de Histocompatibilidade do Centro (Coimbra) and a special thanks to Dr. Artur Paiva and Susana Pedreiro.
I would like to thank our collaborators in Centro Nacional de Biotecnología (Madrid), Professor Francisco Iborra and Juan Colunga for the bioinformatics analysis and for the great scientific discussions.
I would also like to thank the Stem cells Lab members from the Cancer Institute (University College of London) that welcomed the “Portuguese alien” with kindness and wiliness to help me. I will always be grateful to all. I would like to thank Professor Tariq Enver, for the productive brainstorming and for the opportunity to develop part of my work in his group. My special thanks to Professor Rajeev Gupta, Professor Jason Wray, Professor John Brown and Virginia Turati. To the PhD students undergoing the same “crazy stress”, thank you, Elitza Deltcheva and Sara Marelli. A very special thank you to Gill May that provided me crucial support in both the lab and personally in the final steps of my PhD, I will always be grateful and in debt to you. Thank you so much.
Thank you, Sandra Godinho and Filipa Santos for you friendship, kindness and having me in the first year of the PhD in Lisbon and Braga. Thank you Marta Gómez, for all the support and your friendship.
Thank you to Carina Bernardo, Cristiana Faria, Ana Guedes and Irina Simões. Thank you for the good times spend together, for the good vibes and friendship.
ii
Dear Renata Gomes, I will never forget everything that you did for me. Thank you for everything you taught me in the lab. Thank you for your optimistic vision of life. Thank you for calming me down when the “microRNA vanished” and for teaching me the “head glove technique”. Thank you to you, your husband and your family for the friendship and the extra rooms that accommodated me so many times. Above all, thank you for your friendship and humanity.
My family knows that they were crucial to my success during this period of my life and during all my life. Thank you, to Ana Silva and João Lima for transforming me into who I am today. Thank you, also for the encouragement, comfort and concern that you always had with me. Thank you, Joana Lima for all your support and for making me feel capable of doing anything. Thank you, Vitor Teixeira for understanding that the time spent in the lab is never the predicted one (usually 3x more right?!). Thank you, for supporting my devotion to science and to my PhD. Understanding me in my “cranky days” during the thesis writing process. Thank you all, for your love and support.
I believe that without all the people above, and others whom will always be in my mind and my heart, doing this PhD would had been an impossible task.
iii
Resumo
O ambiente extracelular é um dos factores decisivos para determinar a actividade e função celulares. Dentro deste ambiente extracelular existem vários factores determinantes para a manutenção do equilíbrio celular e homeostasia. A alteração de osmolaridade do meio extracelular está associada a inúmeras funções celulares fisiológicas e patologias. Apesar das alterações osmóticas fazerem parte de estímulos observados no microambiente celular estas alterações também podem ser vistas como ferramentas de modulação do fenótipo e destino celulares.
Os mecanismos de resposta a alterações osmóticas são complexos e incluem mecanismos de sinalização, transporte de osmólitos, manutenção da estabilidade e degradação de proteínas e manutenção da integridade genómica da célula.
Este trabalho tem como principal objectivo, aprofundar o conhecimento dos mecanismos que permitam a utilização da modulação osmótica como uma ferramenta de modulação do fenótipo celular.
A estratégia de modulação osmótica desenvolvida neste trabalho mostrou-se capaz de influenciar o balanço iónico intracelular, a quantidade de adenosina trifosfato intracelular, o tamanho da célula e o seu metabolismo. Um dos efeitos mais interessantes está relacionado com a alteração da actividade transcripcional induzida pelo aumento de RNA polimerase II ligada a ácido desoxirribonucleico genómico. Este efeito tem como co-factores vários factores de transcrição dependentes de zinco.
A capacidade da modulação osmótica interferir com decisões celulares determinantes para o destino celular foi mostrada com dois exemplos de alteração da especialização celular, a reprogramação ou pluripotência induzida e a transdiferenciação. Nestes exemplos, a modulação osmótica pode ser uma mais-valia pela sua actividade multifactorial, com efeitos em sinalizadores intracelulares, na mitocôndria, na estrutura global da cromatina e no padrão epigenético das células, bem como por interferir em processos de splicing alternativo e no processo de transcrição geral.
Estas características tornam a modulação osmótica uma fonte de modulação biofísica relevante para controlo do fenótipo celular e em futuras aplicações terapêuticas.
Palavras-chave: Modulação hiposmótica, alteração da cromatina, fenótipo celular, metabolismo, transcrição e destino celular.
v
Abstract
The use of non-lethal stimuli as cell modulators is a growing research area. The use of such strategies enables the control of cell behaviour and phenotype using stimuli that occur within the normal cellular environment. By using these stimuli, is possible to take advantage of their controlled application in benefit of a targeted cell phenotype modification and interfere with fate determination.
Osmoregulatory mechanisms are constituted by diversified signalling mechanisms, which share the objective of maintenance of cell integrity and function when an extracellular osmolarity disturbance occurs. Cellular osmoregulation comprises the regulation of cell volume and osmolyte transport and also protein structure and turnover, and genomic integrity. These mechanisms are observed under distinct physiological and pathophysiological scenarios.
This work aims to contribute to a better understanding of the relevance of the environmental osmotic modulation on cell physiology and its potential relevance to cell behaviour and phenotype.
The hyposmotic modulation described in this work induced differences in the transcriptional process by an increased RNA polymerase II binding to the chromatin. This has been mediated by the intervention of specific transcription factors such as zinc finger proteins to attain a specific RNA polymerase II binding profile.
The hyposmotic modulation has the ability to interfere with cell fate determination processes such as reprogramming and transdifferentiation. The potential of interfering with such complex processes has to do with the broad effect of the hyposmotic modulation on cellular signalling molecules (like calcium and adenosine triphosphate), mitochondrial activity and morphology, chromatin structure, epigenetic landscape, alternative splicing events and transcriptional pattern.
The area of cellular therapies is growing exponentially and the basic knowledge on cellular behaviour and cellular response to osmotic changes as well as the development of new tools responsive to osmotic changes can have a crucial role for the development of future therapeutic applications.
Keywords: Hyposmotic modulation, chromatin remodelling, cell phenotype, metabolism, transcription and fate determination.
vii
Table of contents
Acknowledgments ... i Resumo ... iii Abstract ... v List of figures ... xiList of tables ... xvii
List of abbreviations and symbols ... xix
Chapter 1 : Introduction ... 1
1.1. Aim ... 1
1.2. Thesis outline ... 2
1.3. Environmental stress cues that impact in cell behaviour ... 3
1.3.1. Major types of environmental stress stimuli and cellular outputs ... 5
1.3.2. The osmotic stress response ... 8
1.3.3. Signalling cascades ... 17
1.3.4. Transcriptional and nuclear structure changes ... 24
1.3.5. Cellular redox and metabolic changes ... 31
1.4. Cell-based therapeutic products for clinical application ... 34
1.4.1. Evolution ... 34
1.4.2. Types of cell-based therapies ... 38
1.4.3. Clinical trials of cell-based therapies ... 41
Chapter 2 : Materials and methods ... 47
2.1. Materials ... 47
viii
2.1.2. Reagents and solutions ... 48
2.2. Methods ... 57
2.2.1. DNA and RNA extraction ... 57
2.2.2. Production of cDNA ... 57
2.2.3. Immunolabeling ... 58
2.2.4. Cellular stains ... 58
2.2.5. ATP measurements ... 58
2.2.6. Quantitative real time polymerase chain reaction (qRT-PCR) ... 59
2.2.7. Western Blotting ... 59
2.2.8. Enzymatic digestions ... 60
2.2.9. Cell imaging and cell cytometry ... 60
2.2.10. Osmotic cell modulation ... 61
2.2.11. Transcription assessment ... 61
2.2.12. Chromatin Immunoprecipitation ... 63
2.2.13. Chip-Sequencing library preparation and sequencing ... 65
2.2.14. Chip-Sequencing analysis ... 66
2.2.15. Plasmid amplification ... 66
2.2.16. Lentiviral production... 66
2.2.17. Cell reprogramming ... 67
2.2.18. Umbilical cord blood isolation and cell population sorting ... 69
2.2.19. Transdifferentiation process ... 70
2.2.20. Statistical analysis ... 70
Chapter 3 : Impact of osmotic modulation on cell physiology ... 71
3.1. Results and Discussion... 72
3.1.1. Osmotic modulation effects on intracellular parameters and cellular metabolism ... 72
ix
Cell size and cell viability ... 75
3.1.2.1. Cellular physiology and metabolism ... 80
3.1.2.2. 3.1.3. Transient osmotic modulation effects ... 89
Cell size and cell viability ... 90
3.1.3.1. Cellular physiology ... 95
3.1.3.2. 3.1.4. Chromatin changes induced by osmotic modulation ... 98
3.1.5. Transcriptional changes induced by osmotic modulation ... 114
3.2. Concluding observations ... 142
Chapter 4 : Osmotic regulation in stem cell biotechnology and cellular products ... 145
4.1. Results and Discussion... 146
4.1.1. Importance of osmolarity for Umbilical Cord Blood cells ... 146
4.1.2. Umbilical Cord Blood cells reprogramming ... 152
Variability in reprogramming efficiency of Umbilical Cord Blood cells ... 152
4.1.2.1. Osmotic influence in Umbilical Cord Blood cell reprogramming ... 158
4.1.2.2. 4.1.2.2.1. Characterisation of the derived induced pluripotent stem cells ... 167
4.1.3. Osmotic influence in fibroblast reprogramming ... 170
4.2. Concluding observations ... 174
Chapter 5 : Osmolarity influence on cell commitment to metabolic and phenotypic fates ... 175
5.1. Results and Discussion... 176
5.1.1. The influence of osmolarity in transdifferentiation ... 176
Osmolarity influence on mitochondrial morphology ... 185
5.1.1.1. 5.1.2. Influence of glucose concentration within cell phenotype changes ... 192
x
Chapter 6 : Discussion, conclusions and future work. ... 197
Cellular parameters ... 197
Chromatin and transcription and cell fate determinations ... 199
Final concluding remarks ... 209
xi
List of figures
Figure 1.1 – Schematic illustration of the homoeostatic range concept... 3
Figure 1.2 – Schematic illustration of the adaptive homoeostasis concept. ... 4
Figure 1.3 – Schematic illustration of important aspects of the cellular stress response and interactions with cellular homoeostasis response. ... 7
Figure 1.4 – Steady-state cell volume regulation under isotonic environment. ... 10
Figure 1.5 – Schematic representation of cell volume variations after presenting the cells transiently to a hyposmotic environment. ... 11
Figure 1.6 – Schematic representation of cell volume variations after presenting the cells transiently to a hypertonic environment. ... 12
Figure 1.7 – Schematic illustration of cell volume variations after presenting the cells to anisosmotic environments and the main ions involved in cell volume regulatory mechanisms. ... 13
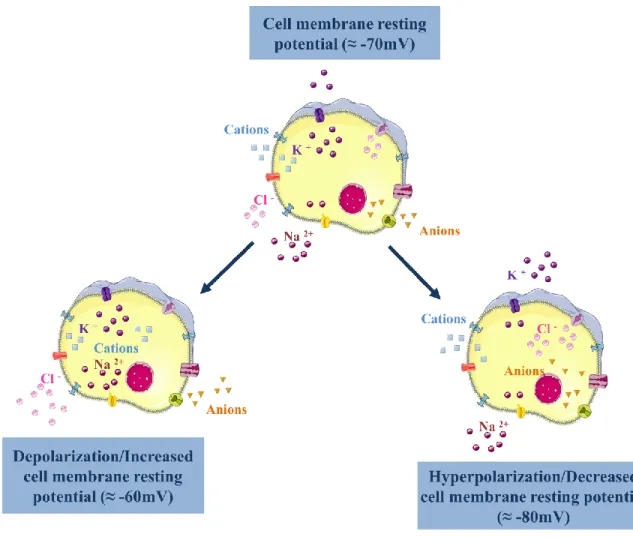
Figure 1.8 – Cell membrane potential changes associated with different ionic fluxes. ... 16
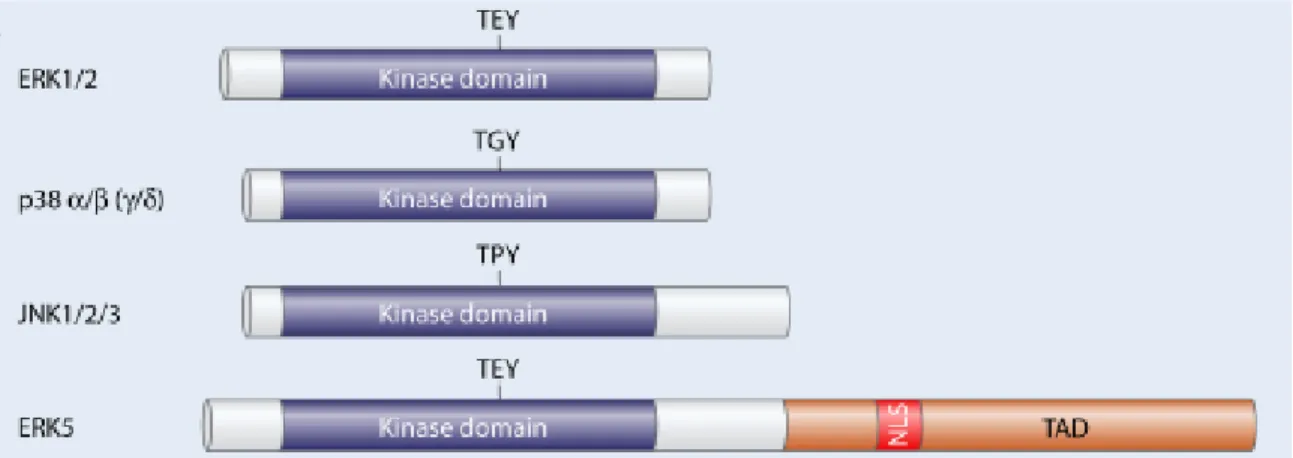
Figure 1.9 – Main structural domains of mitogen-activated protein kinases (MAPK) enzymes. ... 18
Figure 1.10 – Mitogen-activated protein kinase (MAPK) signalling cascades leading to activation of the MAPK activated protein kinases (MAPKAPKs). ... 18
Figure 1.11 – Stress signalling by p38 MAPKs. ... 20
Figure 1.12 – MAPK signalling pathways under hyposmotic stress. ... 22
Figure 1.13 – MAPK signalling pathways under hypertonic stress. ... 23
Figure 1.14 – Proposed mechanisms of DNA site recognition by the Ets domains of Ets-1 and PU.1. ... 28
Figure 1.15 – Cell-based therapy related publications over time. ... 34
Figure 1.16 – Schematic representation of the self-renewal properties along cell differentiation process. 36 Figure 1.17 – Schematic representation of a transcriptional regulatory circuitry that regulates stem cells. ... 37
Figure 1.18 – Different types of cellular therapies. ... 39
Figure 1.19 – Specific medicinal products within ATMPs. ... 42
Figure 1.20 – Evolution of the number of ATMPs related clinical trials over time ... 44
Figure 2.1 – Fluorescence loss in photobleaching (FLIP) experiment illustration. ... 63
Figure 2.2 – Schematic representation of chromatin immunoprecipitation (Chip) experiments. ... 64
xii
Figure 2.4 – Schematic representation for reprogramming experiments with umbilical cord blood cells. 67 Figure 2.5 – Schematic representation for reprogramming experiments with normal dermal fibroblasts
(NDHFs). ... 68
Figure 2.6 – Representation of the setup for colony mechanical picking. ... 68
Figure 2.7 – Workflow for isolation of specific cell populations from the umbilical cord blood by magnetic activated cell sorting. ... 69
Figure 2.8 – Schematic representation for the transdifferentiation experiments with the HAFTL-C10 cell line. ... 70
Figure 3.1 – Effect of constant osmotic modulation on cell size in K562 cells. ... 76
Figure 3.2 – Effect of constant osmotic modulation on cell size in K562 cells. ... 76
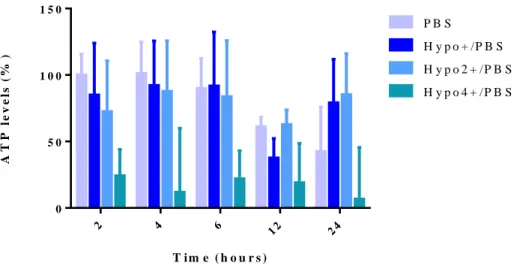
Figure 3.3 – Effect of constant osmotic modulation on total ATP levels in K562 cells. ... 77
Figure 3.4 – Effect of constant osmotic modulation on total ATP levels in K562 cells. ... 78
Figure 3.5 – Total ATP levels on control groups in K562 cells. ... 78
Figure 3.6 – Effect of constant osmotic modulation on total ATP levels in UCB-MNCs. ... 79
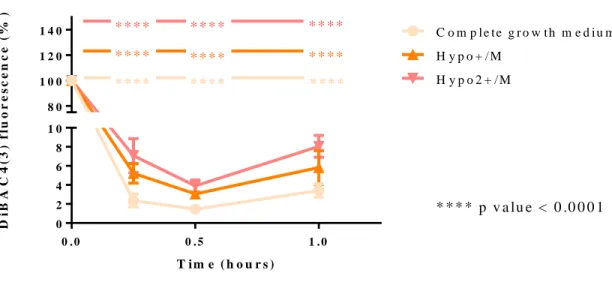
Figure 3.7 – Effect of constant osmotic modulation on cell membrane potential in K562 cells. ... 81
Figure 3.8 – Differences of environmental conditions on cell membrane potential in K562 cells. ... 82
Figure 3.9 – Effect of constant osmotic modulation on cell membrane potential in K562 cells. ... 83
Figure 3.10 – Effect of constant osmotic modulation on mitochondrial superoxide levels in K562 cells. . 84
Figure 3.11 – Effect of constant osmotic modulation on ROS levels in K562 cells. ... 85
Figure 3.12 – Effect of constant osmotic modulation on mitochondrial membrane potential (ΔΨm) in K562 cells. ... 86
Figure 3.13 – Effect of constant osmotic modulation on mitochondrial membrane potential (ΔΨm) in K562 cells. ... 87
Figure 3.14 – Effect of constant osmotic modulation on intracellular free calcium levels in K562 cells. . 88
Figure 3.15 – Effect of constant osmotic modulation on intracellular free calcium levels in K562 cells. . 89
Figure 3.16 – Effect of transient osmotic modulation on cell size in K562 cells. ... 90
Figure 3.17 - Effect of transient osmotic modulation on cell size in K562 cells. ... 91
Figure 3.18 – Effect of transient osmotic modulation on total ATP in UCB-MNCs. ... 92
Figure 3.19 – Effect of transient osmotic modulation on extracellular ATP levels in K562 cells. ... 93
Figure 3.20 – Effect of transient osmotic modulation on intracellular ATP levels in K562 cells. ... 94
Figure 3.21 – Effect of transient osmotic modulation on intracellular free calcium levels in K562 cells. . 96
Figure 3.22 – Effect of transient osmotic modulation on intracellular free calcium levels in K562 cells. . 96
xiii Figure 3.24 – Confocal imaging with DAPI stained UCB-MNCs, previously presented to different
osmotic solutions. ... 99
Figure 3.25 – Confocal imaging and respective 3D intensity plots of DAPI stained UCB-MNCs, previously presented to different osmotic solutions... 100
Figure 3.26 – Effect of transient hyposmotic “safe” modulation on cell nuclear parameters in HeLa cells. ... 101
Figure 3.27 – Effect of transient osmotic “toxic” modulation on cell nuclear parameters in HeLa cells. 103 Figure 3.28 – Effect of transient hyposmotic “safe” modulation on cell nuclear parameters in HeLa cells. ... 103
Figure 3.29 – Effect of transient osmotic “toxic” modulation on cell nuclear parameters in HeLa cells. 104 Figure 3.30 – DNA fragmentation pattern after digestion with DNase I using K562 cells. ... 106
Figure 3.31 – Representative histogram of the DNA fragmentation pattern of DNase I digestion. ... 107
Figure 3.32 – Representative histogram of the DNA fragmentation pattern of DNase I digestion. ... 108
Figure 3.33 – DNA fragmentation pattern after MNase digestion using K562 cells. ... 109
Figure 3.34 – Representative histogram of the DNA fragmentation pattern of MNase digestion. ... 110
Figure 3.35 – Representative histogram of the DNA fragmentation pattern of MNase digestion. ... 111
Figure 3.36 - Immunolabeling quantification of the fluorescence signal of H4K16 acetylation in UCB-MNCs presented to different osmolarity conditions. ... 112
Figure 3.37 – Immunolabeling quantification of the fluorescence signal of H4K16 acetylation HeLa cells after a transient hyposmotic modulation. ... 113
Figure 3.38 – Hyposmotic modulation effect on transcriptional activity over time in K562 cells. ... 115
Figure 3.39 – Hyposmotic modulation effect on transcriptional activity over time in K562 cells. ... 116
Figure 3.40 – Hyposmotic modulation effect on transcriptional activity over time in K562 cells. ... 117
Figure 3.41 – Effect of transient osmotic modulation on transcriptional activity in K562 cells. ... 119
Figure 3.42 – Effect of hyposmotic modulation on transcriptional elongation. ... 120
Figure 3.43 –Representative western blot image to detect the RNA Pol II PhosphoS2. ... 121
Figure 3.44 – Percentage of different RNA polymerase II forms within the transcription cycle in the CHO RNA Pol II-EGFP cell line. ... 122
Figure 3.45 – RNA polymerase II half-life in the CHO RNA Pol II-EGFP cell line. ... 123
Figure 3.46 – Effect of transient osmotic modulation on DNA recovery after chromatin immunoprecipitation. ... 124
Figure 3.47 – Ratio of DNA amount recovered after chromatin immunoprecipitation. ... 124
xiv
Figure 3.49 – Gene ontology analysis of the peaks detected within the condition PBS (1h) for RNA Pol II
PhosphoS5. ... 126
Figure 3.50 – Gene ontology analysis of the peaks detected within the condition hypo2+/PBS (1h) for RNA Pol II PhosphoS5. ... 127
Figure 3.51 – Gene ontology analysis of the peaks detected within the condition PBS (1h) for RNA Pol II PhosphoS2. ... 128
Figure 3.52 – Gene ontology analysis of the peaks detected within the condition hypo2+/PBS (1h) for RNA Pol II PhosphoS2. ... 128
Figure 3.53 – Pioneer transcription factors association scores. ... 136
Figure 3.54 – Ets transcription factors association scores. ... 137
Figure 3.55 – Osmoregulatory transcription factors association scores... 138
Figure 3.56 – Ranked prediction of transcription factors involved in the regulation of the “new peaks” gene list of Chip-Seq data for RNA Pol II PhosphoS5 at time-point 0h and 1h. ... 139
Figure 3.57 – Sequence of GC content in the sequences of the gene list for RNA Pol II PhosphoS5 at 0h. ... 140
Figure 3.58 – Sequence of GC content in the sequences of the gene list for RNA Pol II PhosphoS5 at 1h. ... 140
Figure 3.59 – Sequence of CpG observed/expected in the sequences of the gene list for RNA Pol II PhosphoS5 at 0h. ... 141
Figure 3.60 – Sequence of CpG observed/expected in the sequences of the gene list for RNA Pol II PhosphoS5 at 1h. ... 141
Figure 3.61 – Top 5 ranked prediction of transcription factors binding sequences of the “new peaks” gene list of Chip-Seq data for RNA Pol II PhosphoS5 at time-point 0h and 1h. ... 142
Figure 4.1 – CPDA-1 influence in intracellular calcium levels in UCB-MNCs. ... 147
Figure 4.2 – CPDA-1 influence on the total UCB-MNCs number. ... 148
Figure 4.3 – CPDA-1 influence in total UCB-MNCs number. ... 149
Figure 4.4 – CPDA-1 influence in the expression of CD34 and CD133 within UCB-MNCs. ... 150
Figure 4.5 – CPDA-1 influence in the expression of CD34 within UCB-MNCs. ... 150
Figure 4.6 – CPDA-1 influence in the expression of CD133 within UCB-MNCs. ... 151
Figure 4.7 – CPDA-1 influence in the expression of CD34 and CD133 within UCB-MNCs. ... 151
Figure 4.8 – Reprogramming variability in UCB cells from different donors. ... 154
Figure 4.9 – Reprogramming efficiency within different UCB-MNC compartments. ... 155
xv
Figure 4.11 – UCB phenotypic characterisation. ... 157
Figure 4.12 – UCB phenotypic characterisation. ... 158
Figure 4.13 – Reprogramming efficiency with different modulation protocols in UCB CD34+CD133+ cells. ... 161
Figure 4.14 – Reprogramming kinetics with different modulation protocols in UCB CD34+CD133+ cells. ... 163
Figure 4.15 – Kinetics of non-reprogrammed colonies with different modulation protocols in UCB CD34+CD133+ cells. ... 164
Figure 4.16 – Reprogramming efficiency with different hyposmotic modulation protocols in UCB CD34+CD133+ cells. ... 166
Figure 4.17 – Phenotypic characterisation of UCB derived iPSCs. ... 167
Figure 4.18 – Phenotypic characterisation of UCB derived iPSCs. ... 168
Figure 4.19 - Phenotypic characterisation of UCB derived iPSCs. ... 169
Figure 4.20 – Reprogramming efficiency with different osmotic modulation protocols in NDHFs. ... 171
Figure 4.21 – Expression of Oct4 and Oct4 isoforms. ... 172
Figure 4.22 – Ratio of expression of Oct4 and Oct4 isoforms. ... 173
Figure 5.1 – HAFTL C10 cell line phenotypic characterisation. ... 177
Figure 5.2 – HAFTL C10 cell line morphology assessed during the transdifferentiation process. ... 178
Figure 5.3 – HAFTL C10 cell line phenotypic characterisation assessed during the transdifferentiation process. ... 179
Figure 5.4 – HAFTL C10 cell line phenotypic characterisation assessed during the transdifferentiation process. ... 180
Figure 5.5 – HAFTL C10 cell line phenotypic characterisation assessed at day 4 of transdifferentiation. ... 181
Figure 5.6 – HAFTL C10 cell line phenotypic characterisation assessed at day 4 of transdifferentiation. ... 182
Figure 5.7 – Transcriptional characterisation of CEBP-family genes assessed at day 4 of transdifferentiation in HAFTL C10 cell line. ... 183
Figure 5.8 – Transcriptional characterisation of transcription factors assessed at day 4 of transdifferentiation in HAFTL C10 cell line. ... 184
Figure 5.9 – Transcriptional characterisation of transcription factors and chromatin-associated factors assessed at day 4 of transdifferentiation in HAFTL C10 cell line. ... 184
xvi
Figure 5.11 – Mitochondrial morphology within different osmolarity environments. ... 187 Figure 5.12 – Mitochondrial morphology within different osmolarity environments. ... 188 Figure 5.13 – Mitochondrial morphology within different osmolarity environments. ... 189 Figure 5.14 – Mitochondrial surface area within different osmolarity environments... 190 Figure 5.15 – Mitochondrial surface area:volume ratio within different osmolarity environments. ... 190 Figure 5.16 – Mitochondrial fragmentation index (f-index) within different osmolarity environments. . 191 Figure 5.17 – Mitochondrial compactness within different osmolarity environments. ... 191 Figure 5.18 - N2A (clone C9) long-term adaptation to different glucose concentrations... 194 Figure 5.19 – N2A (clone E11) long-term adaptation to different glucose concentrations. ... 194 Figure 5.20 – N2A (clone B11) long-term adaptation to different glucose concentrations. ... 195
Figure 6.1 – Work hypothesis scheme. ... 206 Figure 6.2 – Translational application schematic representation. ... 208 Figure 6.3 – Ionic channel and cancer-related publications over time... 208 Figure 6.4 - Ionic channel and cancer-related gene list. ... 209
xvii
List of tables
Table 1.1 – Cell volume control mechanisms activated in isotonic environmental conditions. ... 8 Table 1.2 – Pathophysiological conditions that lead to an altered environment or intracellular osmolarity. 9 Table 1.3 – Summary of the main effectors of cell volume regulatory mechanisms. ... 14 Table 1.4 – Summary of representative transcription factors which are activated in a stress-specific manner. ... 24 Table 1.5 – Summary of representative pioneer transcription factors and their respective cellular functions. ... 26 Table 1.6 – Summary of representative histone modifications associated with transcriptionally active or silent DNA regions. ... 28 Table 1.7 – Summary of different types of reactive oxygen species (ROS) and reactive nitrogen species (RNS) produced in the cell. ... 31 Table 1.8 – Summary of the different types of enzymatic and non-enzymatic antioxidants involved in the cellular antioxidant defence system. ... 32 Table 1.9 – Representative examples of cell-based therapies related clinical trials. ... 44
Table 2.1 – List of reagents used for experiments. ... 49 Table 2.2 – Antibodies used for experiments. In addition to the antibody information, the technical application for what it was used; respective supplier and catalogue number are also shown in this table. 52 Table 2.3 – List of solutions used for experiments. ... 53 Table 2.4 - Probes used for cell function assessment... 55 Table 2.5 – List of primers used for PCR experiments. ... 56 Table 2.6 – Reaction thermal profiles used for SYBR Green qRT-PCR reactions... 59 Table 2.7 – Osmotic modulation cocktails used. ... 61
Table 3.1- Summary of the osmotic conditions used to modulate the cellular environment. ... 73 Table 3.2 – Total number of Chip-Sequencing peaks detected after background noise subtraction. ... 126 Table 3.3 – Total number of Chip-Sequencing “new peaks”. ... 129 Table 3.4 – Top genes in Chip-Sequencing “new peaks” gene list... 129
xviii
Table 4.1 – Reprogramming variability in UCB cells. ... 154 Table 4.2 – Modulation of UCB cells undergoing reprogramming. ... 160
xix
List of abbreviations and symbols
Acetyl-CoA – acetyl coenzyme A AP – alkaline phosphatase AQP – aquaporin
ATMP – advanced therapy medicinal product ATP – adenosine triphosphate
ATP – adenosine triphosphate BM – bone marrow
BMSC – bone marrow stem cell C – cytosine
CD – cluster of differentiation cDNA – complementary DNA
Chip – chromatin immunoprecipitation
Chip-Seq – chromatin immunoprecipitation sequencing CHO – chinese hamster ovarian cell line
CPDA-1 – citrate phosphate dextrose adenine solution CpG – cytosine guanine dinucleotide
CSF – colony stimulating factor CTD – C-terminal domain CTP – cytidine triphosphate
DAPI – 4',6-diamidino-2-phenylindole DHS – DNase I hypersensitive sites
DMEM – Dulbecco's Modified Eagle Medium DNA – deoxyribonucleic acid
DNase I – deoxyribonuclease I
ECL – enhanced chemiluminescence substrates ECM – extracellular matrix
EGFP – enhanced green fluorescent protein ENaC – epithelial sodium channels
ER – oestrogen receptor
ERK – extracellular signal-regulated kinases ESC – embryonic stem cell
xx
Ets – E-twenty six TF EU – ethynyl uridine
EUTP – ethynyl uridine triphosphate FACS – flow assorted cell sorting FBS – foetal bovine serum
FGF – fibroblast growth factor
FLIP – fluorescence loss in photobleaching Flt-3 – fms-related tyrosine kinase 3 ligand FSC/FS – forward scatter
G – guanine
GTP – guanosine triphosphate GVHD – graft versus host disease
HAFTL – Ha-ras-oncogene-transformed mouse cell line HeLa – human adenocarcinoma cell line
hESC – human embryonic stem cell HG – high glucose
hiFBS – heat inactivated foetal bovine serum HLA – human leukocyte antigen
HSC – hematopoietic stem cell HSP – heat shock protein ICM – inner cell mass
IPDB – immunoprecipitation dilution buffer IPEB – immunoprecipitation elution buffer iPSC – induced pluripotent stem cell
IPWB – immunoprecipitation washing buffer JNK – Jun amino-terminal kinases
KG – ketoglutarate Kg – kilogram
KO-DMEM – knockOut Dulbecco's Modified Eagle Medium KO-SR – knockOut serum replacement
LG – low glucose
lncRNA – long-non-coding RNA MACS – magnetic assorted cell sorting
xxi
MAP3K – mitogen-activated protein kinase kinase kinase MAPK – mitogen-activated protein kinase
MAPKAPK – MAPK activated protein kinases MEF – mouse embryonic fibroblasts
MEF I – inactivated mouse embryonic fibroblasts mESC – mouse embryonic stem cell
miRNA – micro RNA mL – millilitre
mM – millimolar
MNase – micrococcal nuclease MNC – mononuclear cell mOsm – milliosmole
MSC – mesenchymal stem cell mtDNA – mitochondrial DNA
NAD+
– nicotinamide adenine dinucleotide oxidised NADH – nicotinamide adenine dinucleotide reduced ncRNA – non-coding RNA
NDHF – normal dermal human fibroblast NFAT – nuclear factor of activated T-cells NG – no glucose
NLB – nuclear lysis buffer NLS – nuclear localisation signal nM – nanomolar
OREBP – osmotic response element binding protein OSKM – Oct4, Sox2, Klf-4, c-Myc cocktail
PBF – physiological buffer with Ficoll PBS – phosphate buffer saline
PCR – polymerase chain reaction PFA – paraformaldehyde
PLZF – promyelocytic leukaemia TF PSC – pluripotent stem cell
qRT-PCR – quantitative real time polymerase chain reaction RFP – red fluorescent protein
xxii
RNA Pol II – RNA Polymerase II
RNA Pol II PhosphoS – RNA Polymerase II phosphorylated in serine RNA-Seq – RNA sequencing
RNS – reactive nitrogen species ROS – reactive oxygen species
RPMI – Roswell Park Memorial Institute rRNA – ribosomal RNA
RTK – receptor tyrosine kinase RVD – regulatory volume decrease RVI – regulatory volume decrease SAPK – stress-activated protein kinase SC – stem cell
SCF – stem cell factor SD – standard deviation
SDS-PAGE – sodium dodecyl sulfate-polyacrylamide gel electrophoresis SEM – standard error mean
SFFV – spleen focus-forming virus sncRNA – small-non-coding RNA SOD – superoxide dismutase SSC/SS – side scatter
TAD – transactivation domain TBS – tris-buffered saline
TBST – tris-buffered saline with tween TF – transcription factor
TonEBP – tonicity-responsive binding protein tRNA – transfer RNA
UCB – umbilical cord blood VPA – valproic acid
ZF – zinc finger
ΔΨm – mitochondrial membrane potential μg – microgram
μL – microliter μm – micrometer μM – micromolar
1
Chapter 1 : Introduction
1.1.
Aim
Stress responses, in human cells, are not fully understood, these are complex and collaborative signalling systems that promote homoeostasis. Physiological levels of stress trigger differentiation and specification of cell fates. Transient hyposmolarity modulation strategies, tailored to the right levels, might constitute a biophysical tool to modulate cellular transcription, metabolism and ultimately cell phenotype and cell fate.
Hyposmotic stress is underexplored but has already been associated with several interesting features like nuclear architecture changes, changes in ribonucleic acid (RNA) genes expression, ionic changes and cytoskeletal modifications (Di Ciano-Oliveira et al., 2006; Finan and Guilak, 2010; Hoffmann et al., 2009; Koivusalo et al., 2009; Lang et al., 1998; De Nadal and Posas, 2015; Okada, 2004; Waldegger et al., 1998; Wehner et al., 2003; Zhao et al., 2016).
Osmolarity is fundamental to a normal embryonic development and extreme osmotic scenarios can be observed in numerous physiological and pathophysiological situations such as renal, articular environments and cancer (Baltz, 2001; Baltz and Tartia, 2009; Halterman et al., 2012; Pedersen et al., 2013; Sontheimer, 2009; Voutouri and Stylianopoulos, 2014; Waldegger et al., 1998).
This work aims to contribute to a better understanding of the relevance of the environmental osmotic modulation on cell physiology and its potential relevance to cell behaviour and phenotype. This can be systematised under the following topics:
To understand the impact of the hyposmotic environment in cell morphology, viability, cell
physiology parameters and metabolism (Chapter 3);
To elucidate the effect of the hyposmotic environment on nuclear and chromatin structure,
chromatin accessibility and the transcription process (Chapter 3);
To understand the impact of the hyposmotic environment on umbilical cord blood stem cell
potency and phenotype (Chapter 4);
To explore the impact of the hyposmotic environment on the induced pluripotency
2
To investigate the impact of the hyposmotic environment on the transdifferentiation process
(Chapter 5);
To examine the impact of the hyposmotic environment on mitochondrial function and the
impact of metabolic fates on alternative splicing events (Chapter 5).
1.2.
Thesis outline
This thesis is divided into seven chapters. The first chapter is a general introduction to subjects which will be explored within the chapters of results. The general introduction contains a description of general environmental stresses and their effect on cell behaviour, with a specific attention to osmotic challenges to the cellular environment. Followed by a summary of cell-based products for potential clinical applications, that can benefit from a more broad knowledge of specific environmental cues to condition the cell performance according to the final therapeutic use.
Materials and methods provide a description of the techniques used during the experimental procedures along this work.
Chapter 3 provides a description of the cellular modifications after application of different hyposmotic modulation schemes. More specifically, parameters like cell size, adenosine triphosphate (ATP) levels, cell membrane potential, reactive oxygen species and mitochondrial function and intracellular calcium levels were evaluated. Also a connection between the osmotic modulation and chromatin state and chromatin marks, RNA polymerase II (RNA Pol II) binding to chromatin, RNA Pol II fully engagement in transcription, transcription speed, RNA Pol II initiation, RNA Pol II in its free form, binding profile of transcription factors and global transcriptional profile were studied.
Chapter 4 provides evidence of the importance of the osmolarity control and the phenotypic impacts that it can have under phenotypic characteristics of umbilical cord blood (UCB) cells. Additionally, explores the potential of hyposmotic modulation within the reprogramming process.
Chapter 5 provides a group of broad results that elucidate some important aspects of the hyposmotic modulation relevance in cell fate decisions and mitochondrial morphology. In addition to the mitochondrial morphology data, the relevance of glucose availability to cell phenotype was also explored. Chapter 6 is a general discussion and the conclusions which we can take from the work developed. It also explores possible avenues of research which can be pursued taking into account the data presented and future challenges which this research area might face.
3
1.3.
Environmental stress cues that impact in cell behaviour
Cells are complex sensors which can perceive and respond to numerous extracellular signals. These extracellular signals can be grouped into different categories like extracellular matrix (ECM) interactions, intercellular interactions and soluble signalling factors (ions, nutrients, cytokines, growth factors). The soluble signalling factor category comprises environmental changes such as alterations in oxidative mechanisms, external pH, nutrient supply, temperature changes and osmotic imbalances. These environmental cues promote the activation of an integrated response that ultimately alters the cell’s phenotypic expression and function as an adaption to the environmental change (Gasiorowski et al., 2013; Kshitiz et al., 2012; de Nadal et al., 2011). The cellular microenvironment is constituted by factors which directly affect the conditions around cells and have a direct or indirect effect on cell’s biophysical and biochemical repertoires (Ozcelik et al., 2014).
The concept of homoeostasis was introduced by Walter Bradford Cannon in 1926 and intended to describe the mechanisms which control the physiological equilibrium within a living organism (Davies, 2016). This term also applies to the cellular environment and to mechanisms which allow cellular equilibrium with its surroundings. Although cellular homoeostasis is the usual cell state, all of its physiological attributes fluctuate within a normal range, the so-called homeostatic range (Figure 1.1).
Figure 1.1 – Schematic illustration of the homoeostatic range concept. Figure adapted from Davies 2016.
On the other hand, stress is usually associated with a negative output, but the consequences of stress can be both harmful and beneficial depending on its intensity, duration and frequency. Exposure to a low dose of a chemical agent or environmental factor which is toxic at high doses can induce an adaptive advantage to the cell or organic system which is called hormesis (Davies, 2016). One of the most widely studied types of experimental hormesis is preconditioning ischemia, that occurs when an organ (the heart or brain, for example) is subjected to brief and mild ischemia. This type of exposure increases the
4
resistance of the cells to this type of stress and can eventually lead to the immortalisation of the cell (Mattson, 2008; Pong, 2004; Yellon and Downey, 2003). Therefore, ischemia is an example of a stress stimulus that exhibits a biphasic dose response, with brief periods being protective and prolonged periods resulting in irreversible cell damage or cell death. The cellular and molecular mechanisms underlying preconditioning ischemia hormesis may involve the activation of oxidative stress-induced cytoprotective signalling pathways involving kinase activation, changes in mitochondria, increased expression of antioxidant enzymes and protein chaperones (Juhaszova et al., 2004; Mattson, 2008).
Nevertheless, the transient exposure to some types of stress might promote a transient adaptation of cellular biochemical components, signalling molecules and transcription profile. These alterations do not promote a new or stronger phenotype, but instead an increased transient resilience to the stressor. This process has recently been suggested to be defined as adaptive homoeostasis (Figure 1.2) by Kelvin Davies (Davies, 2016). Examples of these adaptive responses are very small changes in oxygen, oxidants, temperature, acidity, alkalinity, salt content and others (Ceci et al., 2016; Demirovic and Rattan, 2013; Mattson, 2008; Zhang et al., 2015a). A specific example of these adaptations is the Keep1-Nrf2 (Kelch ECH-associated protein1; nuclear factor erythroid 2-related factor 2) system, where Nrf2 is usually bound to Keep1 in the cytoplasm. Nrf2 is usually found at low cytoplasmic levels because is targeted for proteasome degradation which prevents its nuclear translocation. In the presence of sub-toxic levels of various oxidants, Nrf2 undergoes phosphorylation, escapes proteolytic degradation and suffers nuclear translocation, where it binds and activates transient transcription of antioxidant response elements (Mattson, 2008; Zhang et al., 2015a).
5
This adaptive plasticity of cells to extracellular changes and stressors might present an opportunity to modulate cell fate. In order to achieve this type of control one must understand how toxic and non-damaging stress responses exert their effect in cell behaviour and phenotype. For that a deep knowledge of stress-specific (at the transcription and metabolism level) and general (at organelle function level) responses is required.
1.3.1. Major types of environmental stress stimuli and cellular outputs
The continuous study of cellular stress response has shown that this response is a mixture of diverse molecular mechanisms. Different types of stresses can be grouped into mild, chronic or acute stresses. Classified has alterations in the optimal physical or biochemical conditions for cellular function and viability. The physical and biochemical factors of greatest relevance to eukaryotic cell function include nutrient availability, oxygenation, temperature, pH, and osmolarity (Ho, 2006; Kassahn et al., 2009; Kültz, 2005). In addition to these extracellular factors, intracellular parameters are also relevant to maintain cellular homoeostasis and can also activate stress-related pathways (Cláudio et al., 2013; Simmons et al., 2009). Intracellular conditions can promote activation of stress-related pathways such as the activation of the unfolded protein response during biosynthetic stress which leads to a coordinated inhibition of general protein translation. These biosynthetic stresses can also be induced by external factors which influence the intracellular compartments and its normal biosynthetic pathways (Cláudio et al., 2013; Pakos‐Zebrucka et al., 2016; Simmons et al., 2009) .
The cellular stress response is a widely conserved mechanism of extreme relevance for physiological and pathophysiological conditions and it is characteristic of all the cells. This response is a generalised reaction which is triggered by macromolecule damage (lipids, proteins and deoxyribonucleic acid – DNA) and a major trigger for these damages is cellular redox imbalances. In parallel, environment disturbance can promote a series of stress-specific-induced alterations which are activated by cellular homoeostasis responses. In contrast to the transient nature of the cellular stress response, the cellular homeostatic response persists throughout exposure to the stressor or environmental change (Ho, 2006; Kassahn et al., 2009; Kültz, 2005).
Generically cellular signalling transduction pathways, like the stress response, are comprised of three major levels: a sensor which perceives environmental change; transducers to carry, amplify and integrate the signal; and an effector which promotes an adjustment of cellular function towards the correction of the environmental change and normal cell function (Kültz, 2005). The cellular stress response comprises
6
sensors which detect macromolecular changes within the cellular lipid membrane, DNA and proteins. These sensors will provide upstream signals to the cellular stress response signalling network and promote alterations in cellular growth, activation of macromolecule damage repair mechanisms (DNA repair mechanisms, heat shock protein response among others), protein homeostasis, cytoskeleton organisation, vesicular trafficking, modification of enzymatic activities, modulation of energy metabolism pathways and modulation of oxidative stress response (Jiang et al., 2011; Kassahn et al., 2009; Kültz, 2005; Muralidharan and Mandrekar, 2013; de Nadal et al., 2011; Simmons et al., 2009). In extreme situations where the activation of these pathways is not enough to repair the cell damage and the cellular tolerance limits are surpassed, induction of apoptosis follows. These stress pathways are in close communication with cellular homeostatic signalling networks which are activated by specific environmental changes. Central stress response elements are the chromatin rearrangements, transcriptional changes, posttranscriptional and posttranslational regulation processes (Finan and Guilak, 2010; Guo and Fang, 2014; Kültz, 2005; Malhas and Vaux, 2011; Martins et al., 2012; de Nadal et al., 2011).
All these generic elements within the cellular stress response and homeostatic response, above explored, are illustrated in Figure 1.3.
The ultimate stress response activation goal is to provide the cell with a repertoire of effector proteins, ribonucleic acids (RNAs) and messengers which will restore the normal cell function by induction of specific transcriptional targets. The more studied effectors within the cellular stress response are proteins, but the relevance of RNA molecules like long non-coding RNAs (lncRNAs) and microRNAs (miRNAs) have been more studied in recent years (Huang et al., 2011; Valadkhan and Valencia-Hipólito, 2016; Valgardsdottir et al., 2008).
Although the stress response involves a highly conserved set of protein (around 300), the specificity of this stress response is denoted by a low common percentage of genes, of approximately 30%, which are upregulated during exposure to different stress types as thermal stress, osmostress or oxidative stress (de Nadal et al., 2011).
The tolerance to environmental stress is highly dependent on the species and specific cell types and features such as increased tolerance to a specific stress after preconditioning with the same type of stress (stress-hardening) and increased tolerance to one type of stress after preconditioning with another (cross-tolerance) are commonly observed (Kültz, 2005; Mattson, 2008).
7
Figure 1.3 – Schematic illustration of important aspects of the cellular stress response and interactions with
cellular homoeostasis response. Figure adapted fromKültz 2005.
Stress response mechanisms are also important players in normal development and homoeostasis. For example, impairments in the heat shock response prevent early development in mice (Xiao et al., 1999), and overexpression of the heat shock transcription factor (TF) in Caenorhabditis Elegans results in increased longevity (Garigan et al., 2002; Lund et al., 2002). Additionally, defects in systems related to stress responses contribute to human diseases such as cancer, diabetes (Dhillon et al., 2007; Oyadomari et al., 2002), Alzheimer’s disease (Terro et al., 2002), Parkinson’s disease (Yuzuru et al., 2000), and cardiovascular disease (Pockley, 2002) among others.
One types of stress that is less explored in human cells is the osmotic stress. The next subchapter will explore some specific features associated with the osmotic stress response.
8
1.3.2. The osmotic stress response
Control of cell size might seem a secondary task but it is highly relevant to several cellular functions. Cell size control is crucial for survival and it is not exclusively associated to environment tonicity but also with signalling which interferes with intracellular osmolarity changes as shown in Table 1.1.
Table 1.1 – Cell volume control mechanisms activated in isotonic environmental conditions. Physiological
mechanisms involved in the activation of specific osmolyte transporters. Table adapted from Okada 2004.
Alteration in
cell volume
Cellular function
Cell type
Transporters involved
Increase Absorption
Enterocyte Renal tubular cell
Hepatocyte
Na+ organic solute symport
Increase Insulin response Hepatocyte
Na+-H+ exchanger Na+-K+-2Cl- cotransporter
Na+ pumps Increase Aldosterone response Lymphocyte Na+-H+ exchanger
Increase Excitation Nerve cells Na+ channels
Increase Cell proliferation S-phase entering
cells Nutrient transporter
Increase Cell migration Migratory cells
Na+-H+ exchanger K+ channels Cl- channels
Decrease Secretion Glandular epithelial
cell Cl
channels
Decrease Glucagon response Hepatocyte K
+
channels Cl- channels Decrease Atrial natriuretic
peptide response Cardiac myocyte Na
+ -K+-2Cl- cotransporter Decrease Erythrocyte maturation Reticulocyte K + - Cl- cotransporter
During embryonic development, the zygote maintains its specific diameter for an extended period implying mechanisms of active control over size specification and maintenance. Subsequently, as the embryo suffers successive cleavages into smaller cells, each embryonic stage possesses blastomeres which are maintained with characteristic dimensions (Baltz, 2001). Osmolarity during this developmental process is crucial for successful embryo development. Additionally, to control cell size the pre-implantation embryo uses a unique glycine-mediated osmoregulation mechanism within different osmotic
9
environments in mouse embryos; this is also likely to happen in human embryos (Baltz and Tartia, 2009). Osmolarity control is also fundamental in processes such as placental differentiation (Liu et al., 2009) oocyte metaphase II spindle formation (Mullen et al., 2004) gamete normal function (Pribenszky et al., 2010, 2012) and in vitro culture of mammalian embryos (Cagnone and Sirard, 2016).
On the other hand, some pathophysiological states can lead to a permanent osmotic disturbance either from the extracellular or intracellular environment, as shown in Table 1.2. Additionally, in pathologies such as solid tumours, there are physical constraints to normal diffusion processes and the different osmolarity within different regions of the solid tumour might play a role in cancer progression (Voutouri and Stylianopoulos, 2014).
Table 1.2 – Pathophysiological conditions that lead to an altered environment or intracellular osmolarity.
Table adapted from Okada 2004.
Alteration in osmolarity
Pathophysiologic condition
Increased intracellular osmolarity
Ischemia/hypoxia Epilepsy
Hepatic encephalopathy
Decreased plasma osmolarity
Congenital heart failure Hepatic cirrhosis
Nephrosis
Inappropriate ADH syndrome Myxoedema
Hyponatremia (cancer)
Increased plasma osmolarity
Diarrhoea
Excessive ethanol ingestion Diabetes mellitus Diabetes insipidus
Uraemia Chronic renal failure
Cell volume maintenance mechanisms are very complex, are cell type dependent and still several pathways are not fully understood. Before exploring some of these mechanisms it is important to clarify some basic terms which are many times misinterpreted or misused in the literature. First of all, is important to note that osmolality, osmolarity and tonicity have distinct meanings. While the osmolality is a measure of total solute osmoles per kilogram (Kg) of solvent, taking into account the total solute concentrations (mOsm/Kg); osmolarity is a measure of total osmole per litre (L) of solute, taking into
10
account the total solute concentrations and is a temperature dependent measure (mOsm/L). On the other hand, tonicity considers just the solutes that cannot freely cross the semipermeable cell membrane like Na+, K+, Cl-, HCO3
and glucose (Bersten and Soni, 2009; Rasouli, 2016; Verbalis, 2003). In this way, hyposmolality is always accompanied by hypotonicity but hyperosmolality might not be a synonym of hypertonicity. An example where hyperosmolality is not a synonym for hypertonicity is the excess of urea in plasma, a freely diffusing osmolyte, which induces plasma hyperosmolality without changing tonicity or water movement in the cell because it is evenly distributed between the extracellular and intracellular space (Rasouli, 2016; Verbalis, 2003).
Cells are in general highly permeable to water, this property is closely related to the cellular content of aquaporins (AQPs) and the type of AQPs present, which mediate the type of cellular response (and its intensity) to hyposmotic environments (Galizia et al., 2008; Hoffmann et al., 2009; Liu et al., 2006). In an
isotonic environment the characteristic cell volume is maintained by the active extrusion of Na+
throughout the Na+-K+ pump. This steady state for cell volume regulation is called “double-Donnan
mechanism” or “pump and leak” mechanism and it is schematized in Figure 1.4
Figure 1.4 – Steady-state cell volume regulation under isotonic environment. This steady state cell volume
regulation mechanism, called “double-Donnan mechanism” or “pump and leak”, is observed in the great majority of mammalian cells. Figure adapted from Okada 2004.
11
When cells face an anisosmotic environment, a change in cell volume is observed as a response to the specific extracellular environment tonicity change. The cellular water content and cellular volume are determined by the extracellular concentration of osmotic active compounds and by the extracellular tonicity. The main players in the cell volume maintenance after a tonicity change in the cellular environment can be divided into inorganic osmolytes (mainly Na+, Cl- and K+) and organic osmolytes (mainly taurine, betaine, sorbitol and others).
Therefore, when cells are placed in a hyposmotic environment they will osmotically swell, increasing the cell volume and water content. The cells in this situation will activate regulatory volume decrease (RVD) mechanisms to attempt to return to their normal volume (Figure 1.5) (Hoffmann et al., 2009; Lang et al., 1998; Okada, 2004; Pasantes-Morales et al., 2006; Wehner et al., 2003). During the RVD the cells
release K+, Cl- and promote a water outflow to attain the original cell volume (Figure 1.7). In specific cell
types, a Ca2+ influx is also observed during the RVD process (Hoffmann et al., 2009; Lang et al., 1998;
Wehner et al., 2003). In a later response also organic osmolytes like taurine can be released from swollen cells (Figure 1.7) (Hoffmann et al., 2009; Lang et al., 1998; Wehner et al., 2003). If the tonicity stimulus is transient and cells are swollen in a hyposmotic environment and then placed into an isosmotic environment the cell will sense the environmental change, shrink and activate a regulatory volume
increase (RVI) process. This will, in turn, promote a net gain of K+, Cl-, and intracellular water to promote
an increase of cell volume to their normal volume (Figure 1.5 and Figure 1.7). As a late response, organic osmolytes like taurine, sorbitol and others can be captured by the shrunken cells (Figure 1.7).
Figure 1.5 – Schematic representation of cell volume variations after presenting the cells transiently to a
hyposmotic environment. RVD stands for regulatory volume decrease; RVI stands for regulatory volume increase.
12
Conversely, when cells are placed in a hypertonic environment they will suffer an osmotic shrinkage, and a consequent decrease in the cell volume and water content. The shrunken cells will behave in an opposite manner to the one described for the osmotically swollen cells. Shrunken cells will activate a RVI
process and by a net gain of K+, Cl- and intracellular water they return to their approximate normal cell
volume (Figure 1.6 and Figure 1.7) (Hoffmann et al., 2009; Lang et al., 1998; Okada, 2004; Pasantes-Morales et al., 2006; Wehner et al., 2003). The uptake of organic osmolytes like taurine, sorbitol and others can be seen as a late response of the shrunken cells (Figure 1.7) (Hoffmann et al., 2009; Lang et al., 1998; Okada, 2004; Pasantes-Morales et al., 2006; Wehner et al., 2003). If after transient exposure to a hypertonic environment the cells are placed into an isosmotic environment, the cells will be osmotically swollen and the RVD mechanism will be activated to restore the cell volume (Figure 1.6) as described above (Hoffmann et al., 2009; Koivusalo et al., 2009; Lang et al., 1998; Okada, 2004; Wehner et al., 2003).
Figure 1.6 – Schematic representation of cell volume variations after presenting the cells transiently to a
hypertonic environment. RVI stands for regulatory volume increase; RVD stands for regulatory volume decrease.
Figure adapted from Okada 2004.
All the mechanisms behind the RVD and RVI processes are very complex and involve certain specific ionic channels and osmolyte transporters which are still undiscovered. Nevertheless, the knowledge in this field has been conquered over a long time and the information on the major players in the RVD and RVI is synthesised in Table 1.3.
13
Figure 1.7 – Schematic illustration of cell volume variations after presenting the cells to anisosmotic environments and the main ions involved in cell volume regulatory mechanisms.
14
Table 1.3 – Summary of the main effectors of cell volume regulatory mechanisms. Table adapted from
Koivusalo, Kapus, and Grinstein 2009.
Effector
Substrates
(stoichiometry)
Regulators
Regulatory volume decrease K+ channels
K+ Two pore domain K+
channels (K2P – e.g.
TRAAK, TREK-1, TASK)
Arachidonic acid, leukotrienes, membrane stretch. Large-conductance
channels (BKCa2+)
Leukotrienes, membrane stretch, Ca2+ concentration (μM).
Intermediate conductance channels (IK Ca2+)
Ca2+ concentration (nM). Ca2+ activated channels of
small conductance (SK Ca2+)
Ca2+ concentration (nM). Voltage-gated K+ channels (e.g. Kv1.3, Kv1.5, Kv4.2, Kv4.3, KCNQ1-4) Volume-regulated anion channels Cl-, HCO3-, organic osmolytes (?)
Fatty acids, cholesterol, Rho GTPase, reactive oxygen species, Ca2+, kinases
K+ - Cl- co-transporters
(isoforms 1-4) K
+
, Cl- Kinases
Taurine efflux Taurine Leukotrienes, lysophospholipids, reactive oxygen species, Ca2+, kinases.
Transient receptor
potential channels Ca
2+
Membrane stretch. Regulatory volume increase
Na+ /H+ exchanger Na
+
in exchange for H+ (1:1)
Cholesterol, phosphatidylinositol bisphosphate, membrane deformation, kinases.
Anion exchangers Cl in exchange for HCO3 (1:1) Na+, K+, Cl- co-transporters (isoform 1,2) Na+, K+, Cl -(generally 1:1:2) Kinases Non-selective hyperosmolality-induced cation channels Monovalent cations (mainly Na+) Amiloride-sensitive, Gd3+
and flufenamate-insensitive Phospholipase C, G-proteins.
Amiloride-insensitive, Gd3+ and flufenamate-sensitive Ca 2+ concentration (μM) Amiloride-sensitive, Gd3+ -sensitive Transient receptor potential channels Na + Membrane stretch.
15
Effector
Substrates
(stoichiometry)
Regulators
Organic osmolytes
Taurine: taurine transporter Taurine, Na
+
, Cl
-(1:3:1). Osmotic response element, arachidonic acid. Betaine:
betaine/gamma-aminobutyric acid transporter (BGT1)
Betaine, Na+, Cl
-(1:3:1). Osmotic response element.
Inositol: sodium
myoinositol transporter.
Inositol, Na+
(1:2). Osmotic response element.
Sorbitol: synthesised from glucose by aldose
reductase.
Osmotic response element. Glycerophosphocholine:
synthesised from phosphocholine by phospholipase B.
Osmotic response element.
Ionic changes are also accompanied by changes in the cell membrane potential and mitochondrial function. In regard to the cell membrane potential, there are no comprehensive studies in different cell types, but the hyposmotic environment has been shown to promote stress evoked complex responses with both hyperpolarization and depolarization phases in rat’s aortic endothelial cell layer (Marchenko and Sage, 2000). The maintenance of the cell membrane potential is highly related with the ionic balance between the intracellular and extracellular environment, as represented in Figure 1.8, and therefore an important function that is also altered in anisosmotic environments.
The ionic changes have the potential to impact all the organelles that function in a cytosolic milieu containing several cations and anions. The mitochondria are particularly interesting organelles as the inner mitochondrial membrane is impermeable to cytosolic ions and their flux and concentration in the mitochondrial matrix are controlled by specific channels and exchangers. Any imbalance in the ionic flux can affect the osmotic balance between cytosol and the mitochondrial matrix and promote the water movement between these compartments. The intracellular potassium concentration is considerably higher than other ions and therefore altered potassium fluxes can be a key mediator for mitochondrial matrix volume changes observed with depolarization, calcium overload and the opening of permeability transition pore. In addition to the mitochondrial swelling, osmotic imbalances will also affect the mitochondrial potential. Nevertheless, the experimental data on mitochondrial matrix swelling and mitochondrial potential changes are inconsistent. It has been suggested that a high membrane potential corresponds to the swollen state and that when the potential collapses the mitochondria contract (Garlid and Paucek, 2003; Kaasik et al., 2007). In contrast, several works based on fluorescence microscopy