1
A Work Project, presented as part of the requirements for the Award of a Masters Degree in Finance from the NOVA – School of Business and Economics.
CONTINUOUS IMPROVEMENT LOGISTICS PROJECT
A STUDY ON THE INCREASE OF THE FINISHED GOODS WAREHOUSE OF UNILEVER AT STA. IRIA
José Quirino Gonçalves - 589
A Project carried out on the Finance course, under the supervision of: Prof. Filipe Castro Soeiro
2
Abstract
This project is called Improvement Logistics Project and aims to study an opportunity of expansion of the output in 80% of the Unilever warehouse at Sta. Iria via an increase in exportations for the next two years. This has been done using the Distibuidora Luís Simões tariff rates as basis of comparison for the as-is and to-be situations. For this matter, an allocation of all the costs of the warehouse is prepared and described with the goal of comparing the differences with and without expansion. The results show that a better outcome is achieved with the investment, but the warehouse is yet to prove its efficiency against the distribution company.
3
Table of Contents
1. Purpose of the Project... 4
2. Literature Review ... 5
3. Sta. Iria Warehouse ... 6
3.1. Staff Costs ... 10
3.2. Depreciation ... 13
3.3. Intercompany Charges ... 15
3.4. Canteen ... 15
3.5. Rental & Leases... 16
3.6. Repairs & Maintenance ... 16
3.7. Specialized Works ... 17
3.8. Cleaning... 17
3.9. Others ... 18
3.10. Result analysis ... 19
3.11. Investment Study ... 19
4. Conclusions, Recommendations and Limitations ... 24
4
1. Purpose of the Project
This project aims to study an opportunity of expansion of the Unilever warehouse for FIMA and Knorr products due to an expected increase in exportations that will result in the growth of the output of about 80%. Most of the current exportations are from ambient products and the projected increase of the output is composed by 90% of these. The warehouse uses the distribution company Luís Simões (DLS henceforth) as third party for most of the national clients since they normally request small amounts of product each time. The use of this intermediary has been invaluable for the small drop system but does not make sense for exportations for the reason that international clients are in fact other distribution companies like DLS. The purpose of this project is to study the viability of this expansion against the current situation, while establishing a term of comparison with DLS which serves as benchmark in this study. For the matter, an allocation of the warehouse costs will be done to tariffs similar to the ones used by the distribution company. The final goal is to obtain similar tariffs for the situation after the expansion and to analyze the results.
The understanding of the warehouse was conducted mostly through observation on the site as well as by regular meetings with the supervisory staff of the warehouse and great part of the information was provided by the logistics and finance team.
5
2. Literature Review
While Unilever uses DLS as a third party logistics provider, it is clear the increase in the autonomy of the warehouse at Sta. Iria, this phenomenon is called disintermediation. There is much more written about the subject in the beginning of the century due to the rise of the e-commerce. Authors seem to touch the concept from both sides, some arguing about the threats (Adams 1999 and Berghel 2000) and other about the opportunities (Teixeira 2000) it creates on the supply chain. There are also the authors that do not take a position about the subject and discuss both sides at once (Sampson 2001) and the ones that associate the phenomenon as an evolutionary trend (Blackwell 1997).
On the other hand though, there are some studies conducted by several authors about the use of third party logistics providers (3PL) which is a different, more specific way to address the same question. Most authors opt to provide a view on when and how to use them (Aghazadeh 2003 and McGinnis 1995) concluding that the outcome often depends on a vast set of variables to take into consideration, making each case very particular. In sum the general opinion defends that it is very difficult to address the viability of raising autonomy of parties in the supply chain without fully understanding the particularities of each case.
6
3. Sta. Iria Warehouse
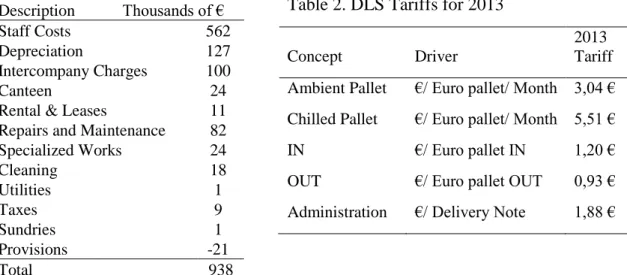
To be able to do a fair allocation, each line from the costs table needs to be understand. Table 1 presents the costs table for 2013, the one used for the allocation process.
Table 1. Warehouse costs by nature for 2013 Description Thousands of € Staff Costs 562 Depreciation 127 Intercompany Charges 100 Canteen 24
Rental & Leases 11 Repairs and Maintenance 82
Specialized Works 24 Cleaning 18 Utilities 1 Taxes 9 Sundries 1 Provisions -21 Total 938
By looking at table 1 alone not much can be pointed out for the purpose of the allocation. The study of the costs should be separated by line. The final result of the allocation is a set of tariffs that can be compared with the ones of DLS, listed in table 2.
But first, the comprehension of how the warehouse is currently working is of the utmost importance. The study makes possible to point out some differences between the operation of this warehouse and a distribution company like DLS which could not be done with the costs table alone and will be key through the allocation process. Below is the flowchart that reproduces all the necessary processes that take a pallet from entering in the warehouse from the attached factories to leave it through the loading dock inside a truck.
Table 2. DLS Tariffs for 2013
Concept Driver
2013 Tariff Ambient Pallet €/ Euro pallet/ Month 3,04 € Chilled Pallet €/ Euro pallet/ Month 5,51 €
IN €/ Euro pallet IN 1,20 €
OUT €/ Euro pallet OUT 0,93 € Administration €/ Delivery Note 1,88 €
8
The flowchart starts with two buffers, represented by triangles which illustrate the two treadmills where the output of each factory comes from. The first of the several activities, represented by rectangles, is to collect the pallets that are sent from the factories via these treadmills and to put them on the rack’s outbound1. This is done by forklift trucks since they
are very mobile and have the ability of lifting pallets to store them on the desired shelf. This is the only activity included in the IN tariff.
The next step is done with another machine. Different machines are represented by different shade colors. To pick up the pallet from the rack’s outbound and store it on the warehouse inventory, a trilateral forklift truck is required due to being able to pick and lift pallets from both sides without having to turn directions. This makes possible to have the racks very close to one another with the distance not much larger of the machine length. If standard forklift trucks were to be used, a lot of space would be wasted as they require a much higher room of maneuver to store a pallet. After being stored, pallets stay on inventory for at least the time required to receive the laboratory decision about the quality of the product. Some products like margarines and products with sugar are analyzed on their microbiological conditions which are relevant for the sake of food security. The laboratory decides whether the product is ok or not, and in case it is not it can either be recovered or destroyed. It is very uncommon for the product to not be on ideal conditions, in fact it is so sporadic that it can be perceived as an outlier in a sample, hence the allocation does not take these cases into account for the purpose of simplicity. Once the laboratory gives the green light about the state of the product, the pallet can finally be sent out from the inventory. The
1The first line of shelves of a rack constitute the outbound, where pallets are placed before
9
trilateral picks up the pallet and puts it back on the rack’s outbound2. All the trilaterals’ work is allocated in the Storage Tariffs, neither IN nor OUT because their activities only exist due to this choice of storing the products.
Afterwards, the processes allocated in the OUT tariff take place. A forklift truck picks up the pallet from the rack’s outbound and put it in the picking zone. From this point forth, there is no more need for lifting pallets, just to move them. Consequently the machines used to do the subsequent transportation are electric pallet jacks, which even though are not able to lift pallets, are very fast at moving them on the ground, and can afford to move two pallets at a time. An employee confers if everything is fine with the pallet before taking it to the loading area. Very rarely there is an issue with the pallet, nevertheless in cases there is, the procedure is to recover the product which can delay the whole process. Again, for the purpose of simplicity these cases are not considered. Generally, after taking the pallet to the loading area, it stays there with all the other pallets that will go in the truck. When the truck arrives, an employee starts loading the pallets on the truck, and this process is done at the same time of the only process allocated for the delivery notes tariff, which is the documentation of the pallets. The documentation includes information such as the sender, receiver, destination, quantity, weight, serial number, articles, tax authority code, etc. This is done for the whole load of pallets that go on the truck, which usually are thirty three and take about five minutes for an employee to process it. Once the truck has all the pallets and the documentation, it leaves the loading dock.
2 Note that the outbound capacity is used by pallets that await to be stored and the ones that just got out of
10
3.1. Staff Costs
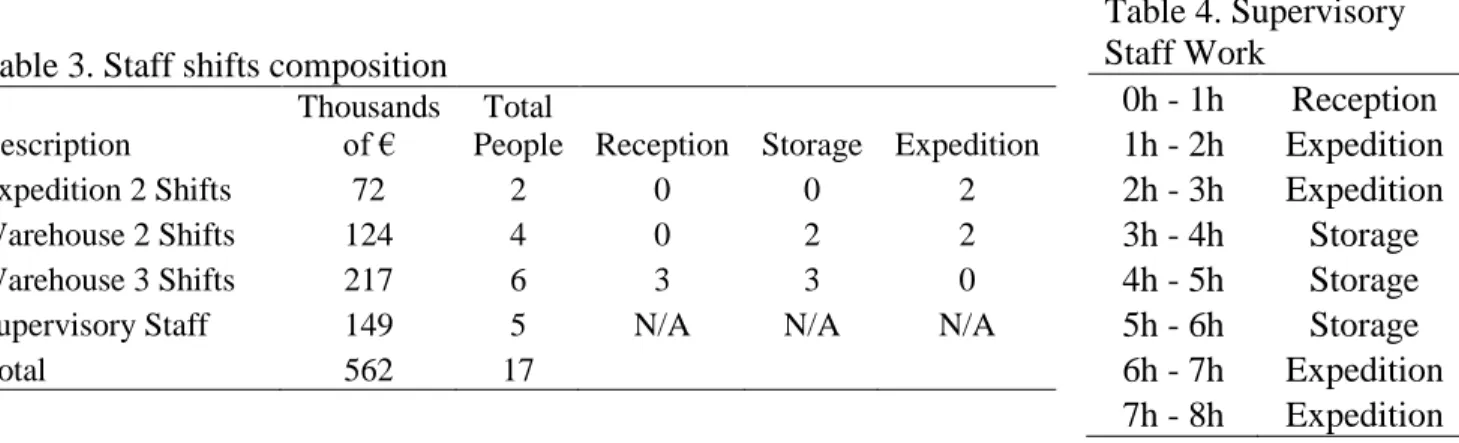
Staff costs are the main expenses of the warehouse, counting with more than half of all the costs of 2013. The staff cost allocation is a delicate one since some wages cost more than others as well as some work shifts3. Table 3 shows the staff divided by shifts and also the shift composition.
Both shifts of expedition contain one employee that work with the electric pallet jacks, and all the activities performed with this machine are allocated in the OUT tariff. The Warehouse 2 shifts contain two people each, one working in a trilateral truck and the other doing expedition work with a forklift, which in the flowchart is the first of the OUT activities. The last 3 shifts are composed by one trilateral truck worker and one forklift worker that does the IN activities in the flowchart. The supervisory staff usually split their work, they do not perform a single task. The warehouse needs supervision in all the activities and the flowchart does not express that, only the documentation activity is presented being the one responsible for the delivery notes. To be able to allocate this part it was asked to the main warehouse
3 For the same job, a shift work is more costly if it has more night hours.
Table 4. Supervisory Staff Work 0h - 1h Reception 1h - 2h Expedition 2h - 3h Expedition 3h - 4h Storage 4h - 5h Storage 5h - 6h Storage 6h - 7h Expedition 7h - 8h Expedition Table 3. Staff shifts composition
Description
Thousands
of € People Reception Storage Expedition Total
Expedition 2 Shifts 72 2 0 0 2
Warehouse 2 Shifts 124 4 0 2 2
Warehouse 3 Shifts 217 6 3 3 0
Supervisory Staff 149 5 N/A N/A N/A
11
supervisor how usually he spends his time aiding between the reception, storage and expedition activities, he divided his 8 hours shift in the way indicated in table 4.
The allocation is now done using the time spent of each staff member in the different activities. But notice that while expedition 2 turns work only in activities allocated in OUT, the supervisory staff when aiding the expedition do all kind of work including documentation, hence the portion of the time for this activity is allocated in the delivery notes tariff. For this, there was needed information about the time that each activity in the flowchart takes and also the total volume of units that went through the flowchart during 2013.
The counting of each activity time was made using the arithmetic mean of a sample where it always included a favorable outcome and an unfavorable one. For instance, when a forklift transports a pallet from the treadmill of the FIMA factory to store it in a rack’s outbound, the time of this activity depends on the rack location. In this case the sample would include the farthest rack and the closest one from the starting point. Table 5 contains the time of each activity per pallet and the percentage of time spent for each activity. For the case of the activities allocated in the IN tariff, the total time is the result of the multiplication between the time of the activity per pallet and the correspondent volume, either the total FIMA volume or the Knorr volume, this is due to the factories entrances being at different distances from the racks’ outbound, more specifically the Knorr factory is further away increasing the average IN activity time in 25 seconds. For all the other activities, the total time uses the total volume, for the reason that it does not make any difference if the process is using a pallet from FIMA or Knorr.
12 Table 5. Activity times
Activity Description
Time per pallet (min)
% of
total time Assigned Tariff Collect pallet from the factory treadmill to the rack's
outbound 14,85%
From FIMA factory 01:00 10,26% IN
From Knorr factory 01:25 4,60% IN
Pick up the pallet from the rack's outbound and store it 20,85%
Ambient pallet 02:00 9,24% Storage - Ambient
Chilled pallet 02:00 17,61% Storage - Chilled
Put the pallet back on the rack's outbound 20,85%
Ambient pallet 02:00 9,24% Storage - Ambient
Chilled pallet 02:00 17,61% Storage - Chilled
Take out the pallet from the outbound to the picking
zone 00:52 11,75% OUT
Pallet conference 00:13 2,95% OUT
Take a pair of pallets from the picking zone to the
loading area 00:43 9,53% OUT
Documentation of pallet 00:09 2,03% Delivery Notes
Loading a pair of pallets on the truck 00:23 5,18% OUT
By looking at the table above, one can conclude that the OUT processes demand much more time from the employees (29,41%) than the IN ones (14,85%). This can be explained by the simplicity of the IN process for this particular warehouse. DLS, being a distributor company, have their IN tariff including more activities such as truck unload and checking whereas this warehouse input is directly done via 2 treadmills attached to the factories.
After taking into consideration the time of each activity per pallet there is still need to split the storage costs in ambient and chilled. This division is done according with the percentage of ambient and chilled pallets. The reason is, the more ambient (chilled) pallets there is, the more time the employees spent in ambient (chilled) storage activities, linearly. In fact this is true for every other activity, but the division is only needed for storage due to the nature of the tariffs.
13
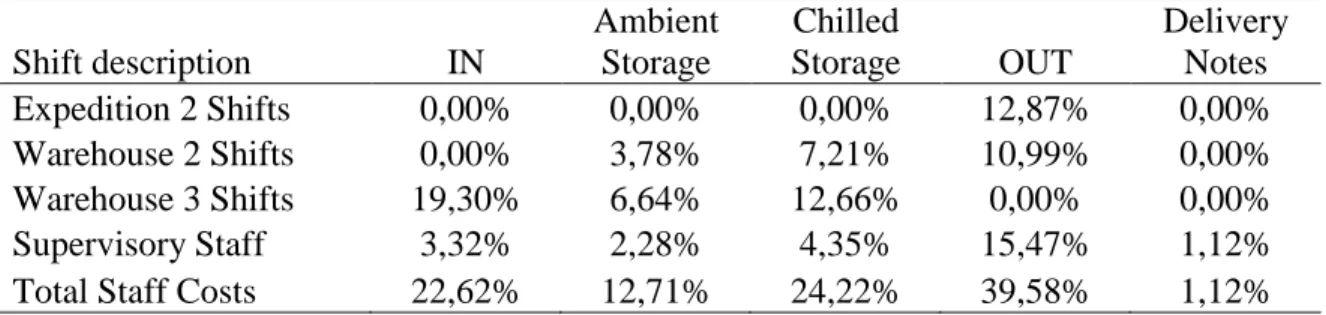
Using the total volume, all the staff costs spent in storage is divided by 34,43% for Ambient Storage tariff and 65,57% for Chilled Storage tariff. Summing up, table 7 shows how the staff costs were divided.
Table 7. Staff Costs Allocation
Shift description IN Ambient Storage Chilled Storage OUT Delivery Notes Expedition 2 Shifts 0,00% 0,00% 0,00% 12,87% 0,00% Warehouse 2 Shifts 0,00% 3,78% 7,21% 10,99% 0,00% Warehouse 3 Shifts 19,30% 6,64% 12,66% 0,00% 0,00% Supervisory Staff 3,32% 2,28% 4,35% 15,47% 1,12%
Total Staff Costs 22,62% 12,71% 24,22% 39,58% 1,12%
3.2. Depreciation
The value of depreciation for 2013 of €127.000 tells nothing for the purpose of allocation, therefore a fully detailed table was provided by the finance team. The table itself is very extensive and the treatment of data took a long time.
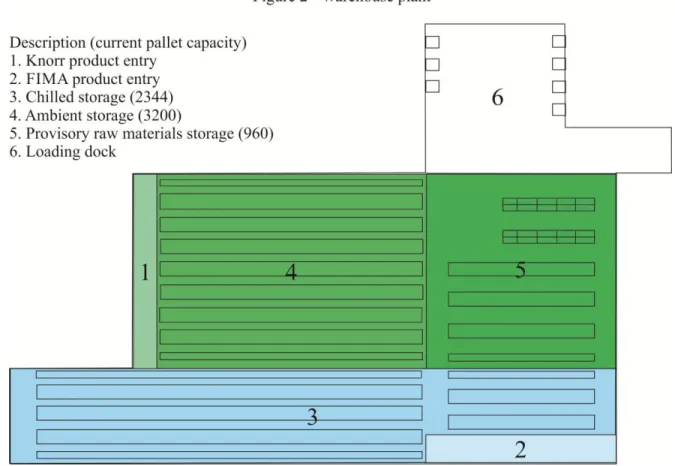
To put it in a nutshell there were 7 criteria used to allocate all lines in the table. All lines related with the building that are not specified for which zone is referred were allocated by area. Figure 2 shows how currently the plant of the warehouse stands.
Table 6. Pallet volume
Factory Ambient Chilled
FIMA 7833 47468
Knorr 17090 0
Total 24923 47468
14
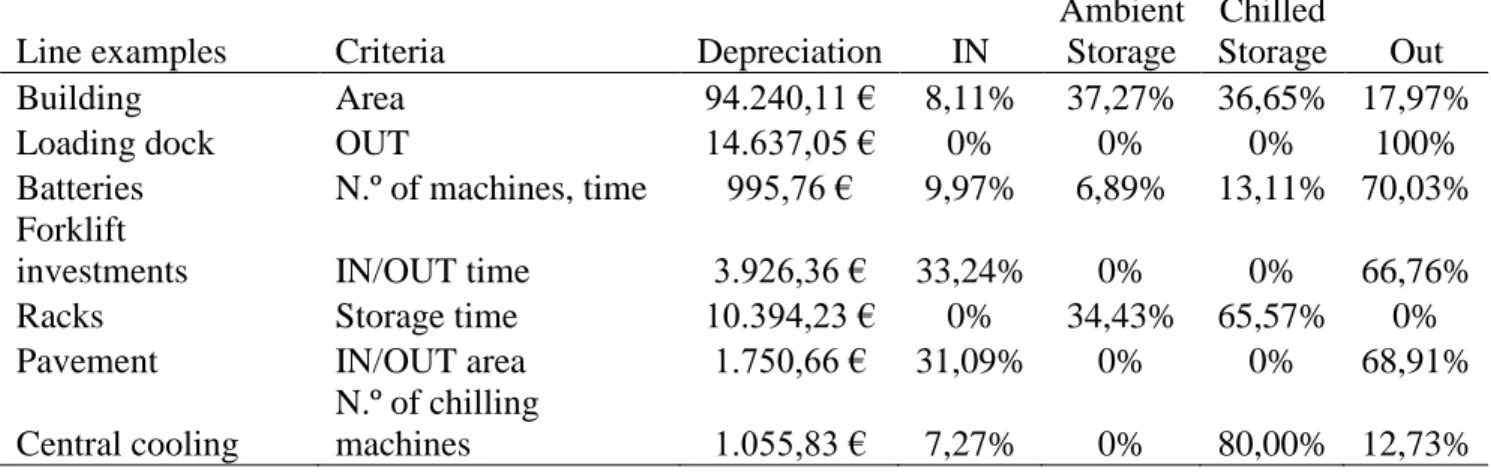
Other lines were also for the building but more specifically, for the loading dock being allocated in OUT. Some lines were related with the batteries or other pieces that were invested in all the machines, the criterion used here was the number of machines that perform on each activity. For the forklifts that divide their work between IN and OUT activities, the time spent was the next criterion to do the allocation. Some lines were relative to storage like the racks, the usual division between the volume of ambient and chilled pallets was used. Additionally, there was a line for an investment in pavement which only refers to the IN and OUT areas, the area was the criterion taken. Moreover, there was a line about an investment in the central cooling. The criterion is the average number of chilling machines being used. Table 8 summarizes the allocation of depreciation.
15 Table 8. Allocation of depreciation
Line examples Criteria Depreciation IN
Ambient Storage
Chilled
Storage Out
Building Area 94.240,11 € 8,11% 37,27% 36,65% 17,97%
Loading dock OUT 14.637,05 € 0% 0% 0% 100%
Batteries N.º of machines, time 995,76 € 9,97% 6,89% 13,11% 70,03% Forklift
investments IN/OUT time 3.926,36 € 33,24% 0% 0% 66,76%
Racks Storage time 10.394,23 € 0% 34,43% 65,57% 0%
Pavement IN/OUT area 1.750,66 € 31,09% 0% 0% 68,91%
Central cooling
N.º of chilling
machines 1.055,83 € 7,27% 0% 80,00% 12,73%
3.3. Intercompany charges
Intercompany charges are in fact refrigeration costs. Only the chilled storage, the entry of products of FIMA and the loading bay are refrigerated. Area is not acceptable as criterion because the use of refrigeration is not linear with the area due to temperature leakages. Therefore the criterion is instead the average number of cooling machines operating. To achieve this, the number was recorded several times through observation until the sample size was big enough. The results are as follows:
Table 9. Intercompany charges costs allocation
IN Storage A Storage F OUT
N.º of cooling machines 1 0 11 1,75
Percentages 7,27% 0,00% 80,00% 12,73%
3.4. Canteen
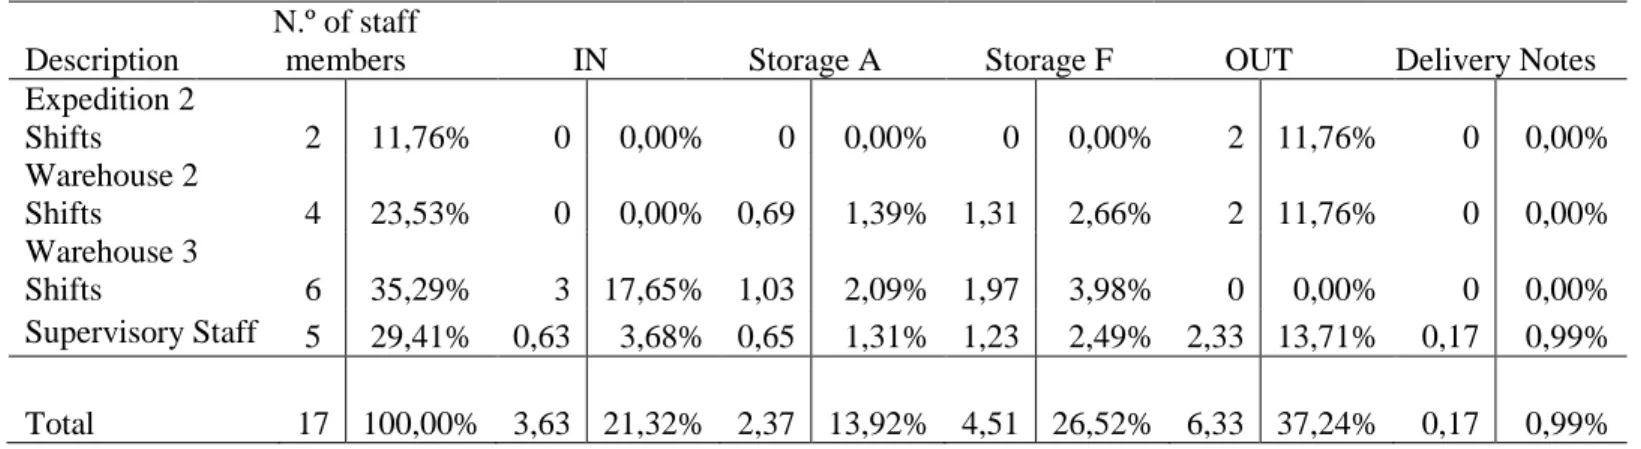
Assuming every staff member uses the canteen every day, the primary criteria to be used is the number of people operating in the activities of each tariff. Then for people
16
allocated in storage, the ambient and chilled pallet volume divide the costs of them, and for the supervisory staff, the time spent is used to divide the canteen costs of these five staff members. The table below shows the final results.
3.5. Rental & Leases
The finance team informed that the low amount of this line refers to 2 forklift trucks. This information was vital to allocate these costs. Looking at the flowchart it is possible to see that forklift trucks work either in IN or OUT activities. The division is then done by the amount of time the machines work on these respective activities.
3.6. Repairs and Maintenance
This line was treated very similarly to depreciation due to a common characteristic. Both lines tell nothing by themselves. Additional information was requested to the finance team and again a very extensive table was given. Likewise, there were different criteria used Table 10. Canteen costs allocation
Description
N.º of staff
members IN Storage A Storage F OUT Delivery Notes
Expedition 2 Shifts 2 11,76% 0 0,00% 0 0,00% 0 0,00% 2 11,76% 0 0,00% Warehouse 2 Shifts 4 23,53% 0 0,00% 0,69 1,39% 1,31 2,66% 2 11,76% 0 0,00% Warehouse 3 Shifts 6 35,29% 3 17,65% 1,03 2,09% 1,97 3,98% 0 0,00% 0 0,00% Supervisory Staff 5 29,41% 0,63 3,68% 0,65 1,31% 1,23 2,49% 2,33 13,71% 0,17 0,99% Total 17 100,00% 3,63 21,32% 2,37 13,92% 4,51 26,52% 6,33 37,24% 0,17 0,99%
Table 11. Rental & Leases allocation
Rental & Leases IN OUT
17
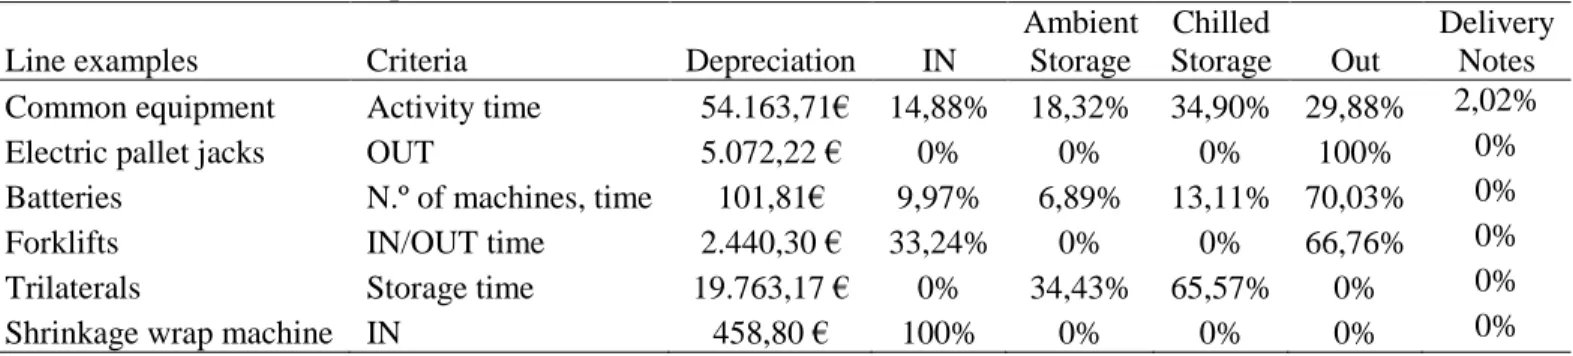
for different lines, totalizing 6 different criteria. Table 12 summarizes the lines in the extensive table with the respective criteria used.
Table 12. Allocation of Repairs & Maintenance
Line examples Criteria Depreciation IN
Ambient Storage Chilled Storage Out Delivery Notes Common equipment Activity time 54.163,71€ 14,88% 18,32% 34,90% 29,88% 2,02%
Electric pallet jacks OUT 5.072,22 € 0% 0% 0% 100% 0%
Batteries N.º of machines, time 101,81€ 9,97% 6,89% 13,11% 70,03% 0%
Forklifts IN/OUT time 2.440,30 € 33,24% 0% 0% 66,76% 0%
Trilaterals Storage time 19.763,17 € 0% 34,43% 65,57% 0% 0%
Shrinkage wrap machine IN 458,80 € 100% 0% 0% 0% 0%
3.7. Specialized Works
Specialized works are in fact extra shifts of the staff, and it is not possible to know what specific tasks composed these extra shifts. Thus, the rates used to do the allocation will be the same as the ones in staff costs.
3.8. Cleaning
The cleaning is done all Saturdays to the whole warehouse. The criterion used is therefore the area where the activities are done.
One thing to notice is despite the much higher volume of chilled pallets, the chilled area is actually a bit lower than the ambient area. Moreover, the ambient products are mostly Knorr products, which do not have any quarantine requirements. Also, the cyclicality that exist should be approximately the same between these ambient and chilled products. This raises the question, is the ambient storage being much more inefficient in comparison to chilled storage? Most likely yes. There is no need to have so much stock for ambient products.
Table 13. Allocation of cleaning
IN Ambient Storage Chilled Storage Out
18
But not only the average daily stock for ambient storage was higher, the volume of pallets delivered was much lower. This means the inventory turnover is lower for the ambient stock, when it should be the other way around according to the quarantine requirements.
3.9. Others
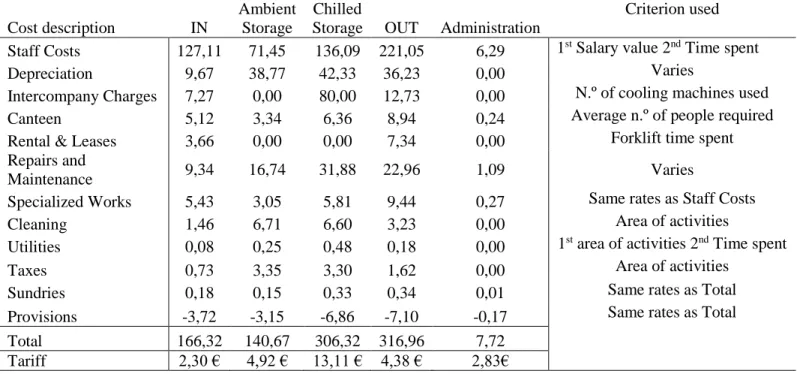
For the remaining costs several criteria was used. Utilities are mainly electricity and water. The criterion used was primarily the area do divide between reception, storage and expedition. Then, to differentiate ambient from chilled storage tariffs and OUT from the delivery notes tariffs, the time spent by the staff was used as criterion. Taxes is the property tax, therefore it uses area as the criterion. For sundries and provisions, the rates used to do the allocation were the ones that would not change the final rates. In the case of sundries is because it is very general line. For provisions is due to the nature of provisions themselves, a provision’s main purpose is to increase the year’s balance accuracy.
Table 14. Allocation results Cost description IN
Ambient Storage
Chilled
Storage OUT Administration
Criterion used Staff Costs 127,11 71,45 136,09 221,05 6,29 1st Salary value 2nd Time spent
Depreciation 9,67 38,77 42,33 36,23 0,00 Varies
Intercompany Charges 7,27 0,00 80,00 12,73 0,00 N.º of cooling machines used
Canteen 5,12 3,34 6,36 8,94 0,24 Average n.º of people required
Rental & Leases 3,66 0,00 0,00 7,34 0,00 Forklift time spent Repairs and
Maintenance 9,34 16,74 31,88 22,96 1,09 Varies
Specialized Works 5,43 3,05 5,81 9,44 0,27 Same rates as Staff Costs
Cleaning 1,46 6,71 6,60 3,23 0,00 Area of activities
Utilities 0,08 0,25 0,48 0,18 0,00 1st area of activities 2nd Time spent
Taxes 0,73 3,35 3,30 1,62 0,00 Area of activities
Sundries 0,18 0,15 0,33 0,34 0,01 Same rates as Total
Provisions -3,72 -3,15 -6,86 -7,10 -0,17 Same rates as Total
Total 166,32 140,67 306,32 316,96 7,72
19
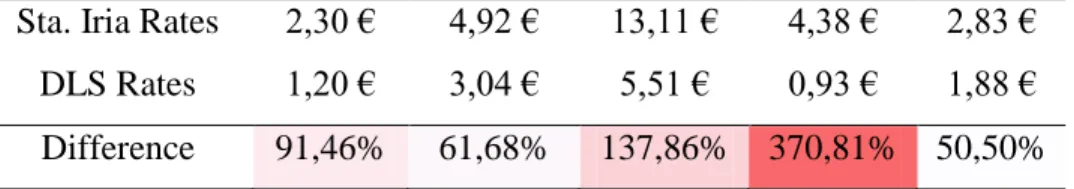
3.10. Result analysis – Sta. Iria vs. DLS
By comparing the results with the DLS tariffs (Table 15) the conclusions are evident. As mentioned already, the IN process of the warehouse is much simpler than the one of the DLS but even for this activities it is almost twice as costly for Sta. Iria. This sort of explains the huge difference for the more complex activities allocated in the OUT tariff. Chilled storage is much more costly than ambient storage and the difference is even higher when compared with DLS. But the much higher inventory turnover compensates a fair amount and the cost per pallet ends up being not that higher. This is a very important issue to note, the tariffs of storage have the cost of one pallet per month, but on average a chilled pallet stays much less time in inventory than an ambient pallet. The actual state seems very poor for the warehouse, but maybe with the opportunity of expansion the results will look more similar.
3.11. Investment Study
It is expected that in two years the overall output of the warehouse is increased by 80%. From this increase 90% is from ambient products and only 10% is from chilled products. The objective is to see the effect on the tariffs with this investment. Even though it is already clear that the tariff that will benefit the most are the ones related with ambient output, the chilled storage can also benefit from economies of scale by increasing the overall output.
Table 15. Sta. Iria vs. DLS tariffs
Sta. Iria Rates 2,30 € 4,92 € 13,11 € 4,38 € 2,83 € DLS Rates 1,20 € 3,04 € 5,51 € 0,93 € 1,88 € Difference 91,46% 61,68% 137,86% 370,81% 50,50%
20
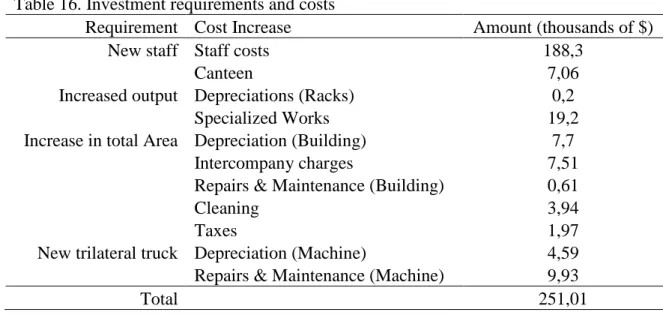
Investment Requirements
To be able to increase the output in 80% some costs will increase in order to face all the requirements. The following table lists all the requirements and the relevant costs they bring.
Table 16. Investment requirements and costs
Requirement Cost Increase Amount (thousands of $)
New staff Staff costs 188,3
Canteen 7,06
Increased output Depreciations (Racks) 0,2
Specialized Works 19,2
Increase in total Area Depreciation (Building) 7,7
Intercompany charges 7,51
Repairs & Maintenance (Building) 0,61
Cleaning 3,94
Taxes 1,97
New trilateral truck Depreciation (Machine) 4,59 Repairs & Maintenance (Machine) 9,93
Total 251,01
New Staff
To know how much staff will be invested first there is the need to analyze how the current one is working to be able to do realistic decisions. For that the total time needed to complete the activities in the flowchart is calculated per employee, note that in reality employees are not always doing these activities since unexpected events happen every day. Table 17. Activities time per worker
IN Storage OUT
(Forklift Trucks)
OUT
(Electric Pallet Jacks)
N.º of employees 3 5 2 2
Total time (minutes) 80935 289560 63341 99247
21
As we can see, there are great disparities among time workers spent doing the activities. The staff that work with the trilateral trucks in storage spent much more time doing the activities than the other ones. The amount of work of each employee of storage (57912) will be used as the productivity target for all the staff in the warehouse. The investment in new staff is done with the assumption that each worker must not work much more than this limit.
With 4 new workers for storage and 1 for the expedition in electric pallet jacks, the time work load is better distributed without exceeding the productivity limit target in a great amount. An increase in amount of workers increase proportionally the canteen costs as the only criterion used is the number of staff. There were 17 staff members before, with 5 more now the canteen costs increase in 29,41%, the same rate of increase in the number of staff.
Increased Output
An increase in output means an increase in capacity, assuming the inventory turnover rate is the same, the increase will be proportional and a higher number of racks is needed. However, there was a space provisionally being used for raw materials. This space has a capacity of 960 pallets which will now being used for ambient storage, however the way it is disposed is for forklift trucks which is a waste. For trilateral trucks the space can be arranged to achieve an estimated capacity of 1500. Only 540 of capacity in new racks is then required Table 18. Activities time per worker after the expansion and investment
IN Storage
OUT (Forklift Trucks)
OUT
(Electric Pallet Jacks)
N.º of employees 3 (+0) 9 (+4) 2 (+0) 3 (+1)
New total time (minutes) 145683 521208 114014 178644
22
for this space and then the other racks will be placed in another area that will be constructed. The amount invested is proportional to the current depreciations of the racks.
The specialized works, being extra shifts will expectedly increase due to the higher work required. It is assumed that these costs increase by the same rate of the increase in the overall output.
Increase in total area
A higher capacity requires an investment in increasing the warehouse area. The space required is calculated using the current proportions of capacity per area.
This increase of 34,34% of the area means that there will be 34,34% overall more costs in depreciations and repairs related with the building, as well as cleaning and property taxes. The increase in intercompany charges is assumed to be the rate of the increase in the chilled area.
Investment in machinery
Each machine used for the activities in the warehouse can take three work shifts per day. This means that there must be at least one third of machines for the number of workers
Table 19. New area needed with investment
Ambient Chilled Total
Current capacity 3200 2344 5544
Increase (80% of 5544 = 4435) 90% of 4435 10% of 4435 4435
New Capacity Required 3992 444
- Raw materials space -1500
Total 2492 444
23
that use them. The investment in new staff was made that only one trilateral truck is needed4. There is only two trilateral trucks and with the expansion, one more is required. With this investment, depreciations and repairs will increase, it is used the average values of yearly depreciation and repairs of the other two trilateral trucks.
Result and analysis
4 See figure 1 for the current number of machines and table 3 for the current number of workers.
Table 21. Allocation results Cost description IN
Ambient Storage
Chilled
Storage OUT Administration
Criterion used
Staff Costs 169,70 135,88 141,21 297,00 6,51 1st Salary value 2nd Time spent Depreciation 9,67 56,65 43,56 36,24 0,00 Varies Intercompany Charges 7,27 0,00 92,38 12,73 0,00 N.º of cooling machines used
Canteen 4,90 7,20 7,48 11,30 0,18 Average n.º of people
required Rental & Leases 3,66 0,00 0,00 7,34 0,00 Forklift time spent Repairs and
Maintenance 10,58 41,08 42,69 26,01 1,24 Varies
Specialized Works 9,77 7,82 8,13 17,10 0,37 Same rates as Staff Costs
Cleaning 1,46 11,93 7,56 3,23 0,00 Area of activities
Utilities 0,06 0,40 0,41 0,13 0,00 1st area of activities 2nd Time spent
Taxes 0,73 5,97 3,78 1,62 0,00 Area of activities
Sundries 0,18 0,22 0,28 0,34 0,01 Same rates as Total
Provisions -3,74 -4,58 -5,96 -7,08 -0,14 Same rates as Total
Total 214,24 262,57 341,53 405,96 8,17
Tariff 1,64 € 3,97 € 12,40 € 3,12 € 1,66 €
Old Tariff 2,30 € 4,92 € 13,11 € 4,38 € 2,83€
Change -28,70% -19,31% -5,42% -28,77% -41,34%
24
The new situation is overall better by taking advantage of economies of scale. Although it still seems that the warehouse can be much more efficient. If the productivity target choice was much more rigorous the rates would be much better, and a reduction of staff costs could be achieved by staff reduction. But that hypothesis would be such a radical change that it could be unrealistic.
4. Conclusions, Recommendations and Limitations
While the choice of investment is overall very good for the warehouse current situation, it is still far from being competitive when comparing with the third party logistics provider DLS. Even though the increase in the autonomy of the warehouse can decrease logistics complexity it is being very inefficient. The costs are too high even when taking advantage of the economies of scale that arise from the expansion opportunity. This happens due to the presence of inefficiencies. While workers could be more efficient by having their workload on the main activities increased, the higher inventory turnover rate for chilled products seem to be a sign of ineffectiveness when most of the ambient products are the ones that do not have any quarantine requirements. It is recommended to do the investment but before doing so one must target the productivity of workers and turnover rates. This project always assumed to not change these variables to not compromise the practicality of the results but more severe targets would certainly increase the warehouse future conditions.
The main limitation of the method used in this work is the nature of the terms of comparison. More specifically the storage rates can lead to wrong perceptions. For instance if the inventory turnover rate suddenly doubles, which is a positive change, for the same number of delivered pallets means the average daily stock inventory decreases, which will
25
make the allocated costs in these tariffs being divided by a lower number ending up with a higher tariff. What it looked like a good thing can be perceived as a bad one using this approach and one should be careful when analyzing this way.
5. References
Articles:Adams, S. 1999. “The disintermediation fallacies.”
Aghazadeh, S.M. 2003, “How to choose an effective third party logistics provider?” Berghel, H. 2000. “Predatory Disintermediation.” vol. 43
Blackwell, R. D. 1997. “From Mind to Market: Reinventing the Retail Supply Chain” Teixeira, D. 2000. “Disintermediation: A positive force for banks.” vol. 92
McGinnis, M.A. Kochunny, 1995, “Third party logistics choice”
Sampson, Scott E. 2001. “The Impact of Disintermediation in Retail Supply Chains”
Books:
Cachon, Gerárd. 2011. “Chapter 3: Understanding the Supply Process: Evaluating Process Capacity.”, In Matching Supply with Demand, second edition, New York: McGraw Hill. Schiraldi, Massimiliano M. 2013. Operations Management. Rijeka, Croatia: Intech