Microcystic Inner Nuclear Layer Changes and
Retinal Nerve Fiber Layer Defects in Eyes with
Glaucoma
Tomoko Hasegawa, Tadamichi Akagi*, Munemitsu Yoshikawa, Kenji Suda, Hiroshi Yamada, Yugo Kimura, Hideo Nakanishi, Masahiro Miyake, Noriyuki Unoki, Hanako Ohashi Ikeda, Nagahisa Yoshimura
Department of Ophthalmology and Visual Sciences, Kyoto University Graduate School of Medicine, Kyoto, Kyoto, Japan
Abstract
Objective
To examine microcystic inner nuclear layer (INL) changes in glaucomatous eyes and to de-termine associated factors.
Design
Retrospective, cross-sectional, observational study.
Methods
Two hundred seventeen eyes of 133 patients with primary open angle glaucoma (POAG), 41 eyes of 32 patients with preperimetric glaucoma and 181 normal eyes of 117 subjects were ultimately included. Microcystic INL lesions were examined with infrared fundus im-ages and with 19 vertical spectral domain optical coherence tomography (SD-OCT) imim-ages in the macular area.
Results
Microcystic INL changes were observed in 6.0% of eyes with POAG, but none of the normal eyes or eyes with preperimetric glaucoma showed microcystic INL changes. The proportion of eyes with advanced glaucoma was significantly larger (P= 0.013) in eyes with
microcys-tic lesions than without. The visual field mean deviation (MD) slope was also significantly worse (P= 0.027) in eyes with microcystic lesions. No significant differences were observed
in age, sex, refraction, axial length, intraocular pressure, or MD value between eyes with and without microcystic INL lesions. In several cases, microcystic INL lesions occurred along with glaucomatous visual field progression. The retinal nerve fiber layer (RNFL) thick-ness (P= 0.013) and ganglion cell layer (GCL) + inner plexiform layer thickness (P= 0.023)
were significantly lower in areas with microcystic lesions than without. The INL was also sig-nificantly thicker (P= 0.002) in areas with microcystic lesions.
OPEN ACCESS
Citation:Hasegawa T, Akagi T, Yoshikawa M, Suda K, Yamada H, Kimura Y, et al. (2015) Microcystic Inner Nuclear Layer Changes and Retinal Nerve Fiber Layer Defects in Eyes with Glaucoma. PLoS ONE 10(6): e0130175. doi:10.1371/journal. pone.0130175
Academic Editor:Friedemann Paul, Charité University Medicine Berlin, GERMANY
Received:November 13, 2014
Accepted:May 18, 2015
Published:June 12, 2015
Copyright:© 2015 Hasegawa et al. This is an open access article distributed under the terms of the Creative Commons Attribution License, which permits unrestricted use, distribution, and reproduction in any medium, provided the original author and source are credited.
Data Availability Statement:All relevant data are within the paper and its Supporting Information files.
Conclusions
Microcystic INL lesions in glaucomatous eyes are closely associated with RNFL and GCL thinning and correlated with worse MD slope. These INL lesions may indicate focal and pro-gressive damage in glaucoma.
Introduction
Glaucoma is a leading cause of blindness throughout the world. It is a progressive optic neu-ropathy, resulting from axonal damage within the optic disc. This subsequently causes retinal nerve fiber layer (RNFL) and retinal ganglion cell layer (GCL) thinning [1–10].
Other retinal layers, including the inner nuclear layer (INL) and outer nuclear layer (ONL), are thought to be less affected by glaucoma, but only a few studies have examined this possibili-ty [11–17]. Spectral-domain optical coherence tomography (SD-OCT) enables the rapid acqui-sition of high axial resolution retinal images, making it possible to analyze individual retinal layer changes in vivo [3–10]. It was recently shown that microcystic changes in the INL may occur in several types of optic nerve diseases, including multiple sclerosis (MS) [18–21], neuro-myelitis optica (NMO) [22–24], idiopathic optic atrophy [19], relapsing isolated optic neuritis [21], comprehensive neuropathy [25], hereditary optic neuropathy [19,26], and trauma [19]. Additionally, microcystic INL changes have been shown to be related to MS severity and recur-rence rates [18,27]. Microcystic INL changes have been previously observed in glaucomatous eyes [19], but their features have not been well characterized.
Macular edema, typically resulting from blood-retinal barrier breakdown [28–30], can be caused by many different conditions, including diabetes, uveitis, retinal vein occlusion, and age-related macular degeneration. Macular edema generally presents as focal leakage, diffuse leakage, or pooling of fluorescein, but microcystic INL lesions related to optic nerve diseases have not been associated with fluorescein leakage [19,26]. On the other hand, intraretinal cystoid spaces without fluorescein leakage can occur in eyes with epiretinal membrane (ERM), vitreomacular traction syndrome, and myopic traction maculopathy. In these conditions, cystoid spaces are closely related to preretinal structures (e.g., partial posterior vitreous detach-ments [PVD] with vitreomacular traction, cortical vitreous layer remnants after PVD, and ERM) and intrinsic retinal properties (e.g., internal limiting membrane [ILM] and retinal arte-riole stiffness) [31–33]. The precise mechanism by which microcystic INL changes develop in optic nerve diseases is not understood, but several potential causes have been suggested, includ-ing retrograde transcellular degeneration, Muller cell dysfunction, vitreous traction, and in-flammation-induced blood-retinal barrier disruptions [18,21,25–27,34].
In this study, we thoroughly analyzed retinal layers in the macula in eyes with glaucoma. We specifically examined features of and associated factors for microcystic INL changes in glaucomatous eyes. Possible mechanisms of development are also discussed.
Methods
Subjects
All investigations adhered to the tenets of the Declaration of Helsinki, and the study was ap-proved by the institutional review board and the ethics committee at Kyoto University Gradu-ate School of Medicine. The nature of the study and its possible consequences were explained
to study candidates, after which written informed consent was obtained from all who participated.
Patients with a glaucoma diagnosis who visited the Glaucoma Service at Kyoto University Hospital between April 2013 and July 2013 were considered for inclusion in this study. Normal subjects who visited our service between Feb 2011 and July 2013 were also included as normal controls (Fig 1). All patients in the database had undergone a comprehensive ophthalmic ex-amination as a routine set of exex-aminations in our service, including best-corrected visual acuity (BCVA) measurement (5 m Landolt chart), refraction, keratometry, slit-lamp examination, axial length measurement (IOLMaster; Carl Zeiss Meditec, Dublin, CA), Goldmann applana-tion tonometry, gonioscopy, indirect ophthalmoscopy, dilated slit-lamp optic nerve head ex-amination, fundus photography, stereo disc photography (3-Dx simultaneous stereo disc camera; Nidek, Gamagori, Japan), red-free fundus photography (Heidelberg Retina Angiogra-phy [HRA] 2; Heidelberg Engineering, Heidelberg, Germany), standard automated perimetry (SAP, 24–2 Swedish interactive threshold algorithm standard program; Humphrey Visual Field Analyzer [HFA], Carl Zeiss Meditec) and imaging with SD-OCT (Spectralis HRA+OCT, Heidelberg Engineering).
Glaucoma diagnoses were made based on the presence of diffuse or localized rim thinning (determined with stereo disc photography) and/or retinal nerve fiber layer defects (NFLD) cor-responding to glaucomatous visual field defects (determined with red-free fundus imaging). Optic disc appearance was independently evaluated by 3 glaucoma specialists (TA, HOI, HN)
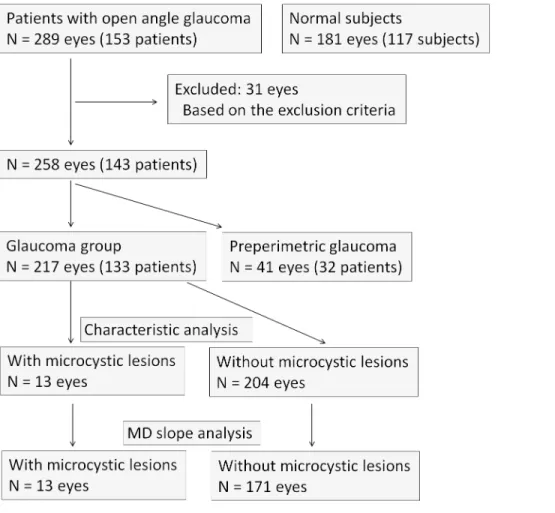
Fig 1. Flowchart of the subjects.
who were masked to all other patient and ocular information. If all 3 examiners were not in agreement with the ocular classification, the group re-reviewed and discussed fundus color and stereo photograph findings until a consensus was reached. Glaucoma stages were determined to be early, moderate, or advanced and were based on HFA visual field findings. Based on Hod-dap-Parrish-Anderson criteria, stages were determined with MD value, number of decreased pattern deviation points and points within the central 5 degrees of vision with a sensitivity<15 dB [35]. Eyes with a normal visual field were classified into either the normal, ocular hyperten-sion or preperimetric glaucoma group, based on disc appearance and the intraocular pressure (IOP). The HFA mean deviation (MD) slope was used to analyze the rate of visual field defect progression. Eyes with at least 4 reliable HFA examinations and 2 or more years of follow-up were included in analyses of MD slope (dB/year) (Fig 1), which utilized automated linear pro-gression analysis (Nidek Advanced Vision Information System [NAVIS], Nidek). IOP analyses were performed with values obtained by averaging IOP measurements made at the first visit in-cluded in this study and the 4 prior consecutive visits.
Patients with a normal anterior chamber on slit-lamp examination and a normal open angle on gonioscopy were included in analyses. Patients were excluded from analyses if BCVA was worse than 20/40 (Snellen equivalent), refractive cylindrical error was more than 3.00 D, SAP visual field results were unreliable (fixation loss>20%, false-positive>15%, or false-negative >33%), or evidence of vitreoretinal disease (e.g., ERM, vitreoretinal traction syndrome, and posterior staphyloma or chorioretinal atrophy with high myopia) was present. Ocular hyper-tension patients were also excluded from the analysis. Patients with diabetes mellitus or any other systemic disease known to affect the eye were also excluded (Fig 1).
Preperimetric glaucoma eyes were excluded from the analysis of the characteristics between eyes with or without INL microcystic lesions (Fig 1).
Imaging and Image Analysis
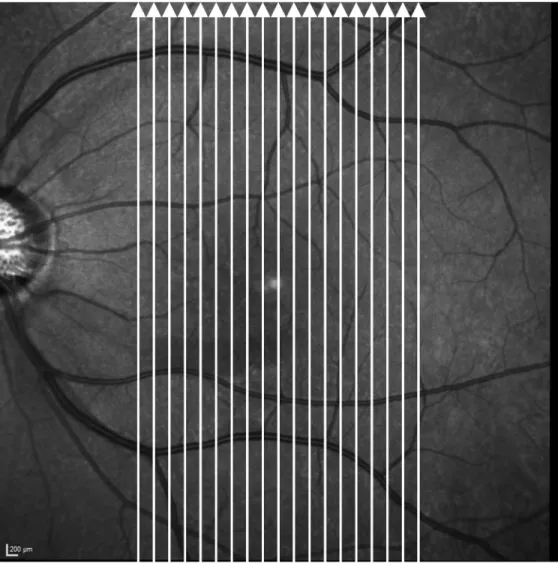
The Spectralis HRA+OCT system was used to scan the macula. Our macular scan protocol scanned a macular area, centered on the fovea, 30° in height and 15° in width. Each retinal scan was made up of 19 vertical line scans (Fig 2), each obtained by averaging 50 B-scans to reduce speckle noise (Figs3Dand4D). Scanning laser ophthalmoscopy images were also obtained with the Spectralis HRA+OCT to examine perimacular hyporeflective patterns, which have been reported to occur with INL microcystic changes in eyes with optic nerve atrophy [19,23]. The OCT scans quality was checked as previously reported (no obvious problems; the OCT sig-nal strength>15 with appropriate averaging of multiple scans; the fundus were well illuminat-ed; the measurement beam placed centrally) [36].
All 19 line scans were manually screened (TH, TA) for the presence of microcystic changes in the INL. To identify the microcystic changes, the same criterion as Gelfand et al. [18] was ap-plied. The microcystic changes were defined as cystic, lacunar areas of hyporeflectivity with clear boundaries, excluding lesions due to speckling artefact, in two or more adjacent B-scans. The evaluators were masked to all other ocular and patient information. If the two evaluators did not agree on INL microcystic changes, all authors reviewed and discussed the scans until a consensus was reached. All NFLDs were diagnosed using fundus photographic and red-free images.
The RNFL, GCL+IPL, INL, and outer retinal (from outer plexiform layer to RPE) thickness were measured at the location of the longitudinally longest microcystic lesion and at the opposite loca-tion (equidistant site from a horizontal line passing through the foveal center). The segmentaloca-tion of the macular scans was performed using custom-made software provided by Heidelberg Engi-neering with manual correction. This segmentation algorithm has been commercially available in Heidelberg Explorer software version 6.0. This analysis was done based on the fact that the ret-inal structures are highly symmetrical at upper and lower hemispheres in normal eyes [3,37]. The condition of a PVD was determined and classified, as was done in a previous report [38], with vertical and horizontal Spectralis OCT scans through the fovea in eyes with microcystic lesions.
Statistical Analysis
All statistical evaluations were performed using commercially available software (SPSS software version 20; IBM, Corp., Armonk, NY). The two-sample t-test or the chi square test was used to Fig 2. The OCT macular scanning protocol.The protocol consisted of 19 vertical scan lines (white arrows) over macular area. The scan was centered on the fovea and had a height of 30° and a width of 15°. Each of the 19 line scans was obtained by averaging 50 B-scans.
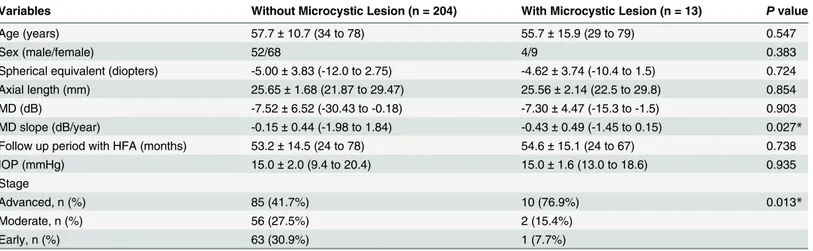
compare mean age, gender, axial length, refraction, MD value, MD slope, IOP, and incidence of advanced stage glaucoma between eyes with and without microcystic INL lesions. Wilcoxon signed-rank test was performed to compare the thickness of each retinal layer between areas with and without microcystic lesions in eyes with microcystic lesions. To determine how each retinal Fig 3. The left fundus of a 44-year-old woman with primary open angle glaucoma and microcystic inner nuclear layer (INL) lesions. A,Infrared image shows perimacular hyporeflective patterns in the region with INL microcystic lesions (white arrows).B, C,Fundus (B) and red-free (C) photographs show retinal nerve fiber layer defects (NFLD, white arrows). Disc hemorrhage was also present at the upper NFLD.D,A Spectralis optical coherence tomography (OCT) image along the yellow line inAshows microcystic INL lesions (yellow arrows). The INL is thicker and the retinal nerve fiber and ganglion cell layers are thinner in the microcystic lesion area. This eye had a partial posterior vitreous detachment (white arrows).E,Pattern deviation map from Humphrey Visual Field Analyzer testing (24–2 Swedish interactive threshold algorithm standard program) showing visual field defects. An absolute scotoma
at the superonasal test points closest to fixation corresponds to the location of the lower NFLD and microcystic INL lesions.F,Magnified OCT image (yellow box inD).
layer was affected by microcystic changes, the thickness of each layer at the INL lesion site and at the equidistant, opposite point were compared using the Spearman rank order correlation coeffi-cient. Statistical significance was defined as aPvalue<0.05. Where applicable, data are presented as mean ± standard deviation.
Fig 4. Right fundus of a 29-year-old woman with primary open angle glaucoma and microcystic inner nuclear layer (INL) lesions. A,The infrared image shows a perimacular hyporeflective pattern in the region with INL microcystic changes (white arrow).B,A fundus photograph shows no evident retinal nerve fiber defect (NFLD).C, A red-free photograph shows NFLD in the region of microcystic INL changes (white arrows).D,A Spectralis optical coherence tomography (OCT) image along the yellow arrow inAshows microcystic INL lesions (yellow arrows). The INL is thicker and the retinal nerve fiber and ganglion cell layers are thinner in the region with microcystic lesions. This eye had a partial posterior vitreous detachment, with the vitreous still attached to the retinal surface above the microcystic lesions (white arrows).E,Pattern deviation map from Humphrey Visual Field Analyzer testing (24–2 Swedish
interactive threshold algorithm standard program) showed superior visual field defects. An absolute scotoma was present at the superonasal test points closest to the fixation.F,A magnified OCT image (yellow box inD).
Results
The medical records of 289 eyes from 153 patients that met the inclusion criteria were re-viewed. Of these, 31 eyes were excluded from analyses because of exclusion criteria or unac-ceptable OCT images. Therefore, 258 eyes from 143 patients were ultimately included in study analyses. The clinical characteristics of included patients are summarized inTable 1. Forty-one eyes were determined to have preperimetric glaucoma and were excluded from the analysis of the characteristics between eyes with or without microcystic INL lesions. A total of 217 eyes (133 patients) were assigned to the glaucoma group, with 95, 58, and 64 eyes having early, moderate, and advanced glaucoma, respectively. The MD slope was analyzed in patients with 4 or more reliable HFA testing results over a minimum follow-up period of two years. This in-cluded 184 eyes (120 patients), 13 (13 patients) of which had microcystic changes (Fig 1). Pa-tients with microcystic changes underwent HFA testing an average of 10.9 ± 7.3 times over 54.6 ± 15.1 months. Patients without microcystic changes underwent HFA testing an average of 10.8 ± 6.0 times over 53.2 ± 14.5 months. The mean follow-up period of all subjects was 53.3 ± 14.5 months. One hundred eighty-one eyes from 117 subjects were included as normal control. The clinical characteristics of normal subjects are also summarized inTable 1. None of the normal eyes manifested microcystic INL changes.
Patients with Microcystic Changes in the Inner Nuclear Layer
Microcystic INL lesions were identified in 13 (13 patients) of 217 eyes (6.0%) with POAG (ex-cluding PPG). No patient had microcystic INL lesions in both eyes. All eyes with microcystic INL lesions had a BCVA of 20/20 (Snellen equivalent) or better. The demographics and clinical findings of patients with POAG with and without microcystic changes are shown inTable 2. There were no significant differences in sex or age between patients with INL lesions and those without. Additionally, there were no significant differences between these groups in refraction, axial length, IOP, or MD value. However, the percentage of eyes with advanced glaucoma was significantly higher (P= 0.013) in eyes with microcystic lesions. The MD slope was also signifi-cantly greater (P= 0.027) in eyes with microcystic lesions. No eyes in the normal or preperi-metric glaucoma groups and only one eye in the early glaucoma stage group had microcystic INL changes.
Table 1. Clinical Characteristics of the Subjects.
Variables POAG including PPG (n = 258 eyes [143 patients]) Normal (n = 181 eyes [117 subjects])
Age (years) 57.5±11.2 (29 to 79) 59.3±14.7 (22 to 85)
Sex (male/female) 143 (62/81) 117 (61/56)
Spherical equivalent (diopters) -4.77±3.70 (-12.0 to 2.75) -2.36±3.23 (-11.50 to 3.00)
Axial length (mm) 25.59±1.68 (21.9 to 29.8) 24.68±1.71 (21.3 to 29.2)
Visualfield mean deviation (dB) -6.46±6.37 (-30.43 to 1.36) -1.43±1.94 (-8.13 to 2.22)
IOP (mmHg) 15.3±2.2 (9.4 to 24.2) 15.3±2.8 (6.0 to 21.0)
Glaucoma stage
Advanced, n (%) 95 (36.8%)
Moderate, n (%) 58 (22.5%)
Early, n (%) 64 (24.8%)
Preperimetric, n (%) 41 (15.9%)
POAG = primary open angle glaucoma, PPG = preperietric glaucoma, IOP = intraocular pressure. Data are presented as mean±standard deviation or number.
Microcystic Lesion Characteristics
Microcystic INL lesions were observed at all retinal quadrants, but were localized to either the superior or inferior hemisphere in all 13 eyes (3 eyes superior, 10 eyes inferior). Visual field de-fects were more severe in the superior hemifield than in the inferior hemifield in all 13 eyes. Therefore, microcystic lesions corresponded with more severe visual field defects in 10 of 13 eyes (76.9%). Microcystic changes were not observed at the foveal center, but between
1113 ± 277μm and 1484 ± 364 away from the foveal center (Figs3Dand4D). Infrared fundus
images revealed perimacular hyporeflective patterns in the area where microcystic lesions were present in 11 of 13 eyes (84.6%; Figs3Aand4A). Spectralis OCT imaging confirmed that PVD was incomplete (paramacular PVD) in 10 eyes (76.9%) (Figs3Dand4D). The remaining 3 eyes (23.1%) had complete PVDs.
Time Course of Microcystic Changes in the Inner Nuclear Layer
Eleven of 13 eyes (84.6%) with microcystic INL lesions had undergone more than two Spectra-lis OCT examinations (mean of 10.6 ± 7.4 times). Microcystic changes increased in 2 of 13 eyes (15.4%) over a 58.0 ± 2.8 month observation period (Fig 5) and remained stable or became in-distinct in 9 eyes over a 33.1 ± 20.4 month observation period. In one eye, microcystic changes appeared before severe visual field defects (Fig 5, same case as shown inFig 3).
Correlation between Microcystic Inner Nuclear Layer Change and
Retinal Nerve Fiber Layer Defects
Apparent NFLDs were observed in 11 of 13 eyes (84.6%) with microcystic changes. Eight of these eyes (72.7%) showed microcystic changes in the same area as the NFLD (Figs3and4). Areas with microcystic changes also had RNFL thinning in 12 of 13 eyes (92.3%), as visible on Spectralis OCT images. Retinal layer thickness changes were quantified by measuring RNFL, GCL+IPL, INL, and the outer retinal (from outer plexiform layer to RPE) thickness in the OCT scan showing the longest longitudinal lesion dimension. The measurements were then com-pared to those taken at the opposite and equidistant location from a horizontal line passing Table 2. Comparison of Subject Characteristics between Primary Open Angle Glaucoma Patients With and Without Microcystic Inner Nuclear Layer Lesion
Variables Without Microcystic Lesion (n = 204) With Microcystic Lesion (n = 13) Pvalue
Age (years) 57.7±10.7 (34 to 78) 55.7±15.9 (29 to 79) 0.547
Sex (male/female) 52/68 4/9 0.383
Spherical equivalent (diopters) -5.00±3.83 (-12.0 to 2.75) -4.62±3.74 (-10.4 to 1.5) 0.724
Axial length (mm) 25.65±1.68 (21.87 to 29.47) 25.56±2.14 (22.5 to 29.8) 0.854
MD (dB) -7.52±6.52 (-30.43 to -0.18) -7.30±4.47 (-15.3 to -1.5) 0.903
MD slope (dB/year) -0.15±0.44 (-1.98 to 1.84) -0.43±0.49 (-1.45 to 0.15) 0.027*
Follow up period with HFA (months) 53.2±14.5 (24 to 78) 54.6±15.1 (24 to 67) 0.738
IOP (mmHg) 15.0±2.0 (9.4 to 20.4) 15.0±1.6 (13.0 to 18.6) 0.935
Stage
Advanced, n (%) 85 (41.7%) 10 (76.9%) 0.013*
Moderate, n (%) 56 (27.5%) 2 (15.4%)
Early, n (%) 63 (30.9%) 1 (7.7%)
IOP = intraocular pressure, MD = mean deviation. Data are presented as mean±standard deviation or number.
*Statistically significant difference (P<0.05) between the groups by two-samplet-test or chi-square test.
through the foveal center (Fig6Aand6B). This comparative method was chosen because reti-nal layer thickness is highly symmetrical between retireti-nal hemispheres in normal eyes [3,37]. The RNFL and GCL+IPL were significantly thinner on the side with microcystic changes than on the side without changes (RNFL: 19.2 ± 16.7μm vs. 33.6 ± 11.6μm,P= 0.013; GCL+IPL:
65.8 ± 22.8μm vs. 91.9 ± 11.8μm,P= 0.023; Fig6Cand6D). However, the INL was
signifi-cantly thicker on the side with microcystic changes (62.2 ± 14.7μm) than on the side without
changes (41.8 ± 9.4μm,P= 0.002,Fig 6E). Outer retinal thickness was not significantly
differ-ent between the affected (169.1 ± 11.5μm) and unaffected (166.5 ± 16.6μm) locations
(P= 0.649,Fig 6F).
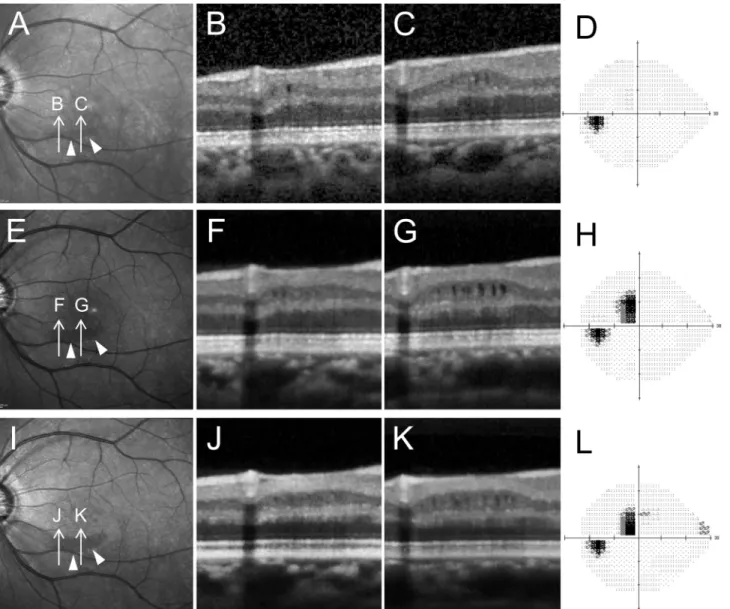
Fig 5. Changes over time in an eye with microcystic inner nuclear layer (INL).Changes appearing before significant visual field damage occurred.A-D, E-HandI-Lshow images and testing obtained in December of 2008, 2012, and 2013, respectively.A, E, I,Infrared images showed perimacular
hyporeflective patterns (arrow heads) becoming more obvious over time.B, C, F, G, J, K,Spectralis OCT images oriented along arrows inA, EandI.D, H andL,Standard automated perimetry testing results (Humphrey Visual Field Analyzer, 24–2 Swedish interactive threshold algorithm standard program gray
scale). Subtle microcystic changes were observed in INL (B, C). It was noticed that localized thinning of retinal nerve fiber layer and ganglion cell layer existed though no severe visual field defects were present (B, CandD). Microcystic changes became more distinct as visual field defects progressed (F, G andH). Microcystic lesion changes became less apparent (F, G, JandK) while the visual field remained stable (H, L).
The difference in INL thickness between affected and unaffected locations (20.5 ± 13.9μm, Fig 6E) was significantly correlated with RNFL thickness differences (-14.5 ± 16.7μm,Fig 6C; ρ= -0.65,P= 0.015) and GCL+IPL thickness differences (-26.1 ± 32.1μm,Fig 6D;ρ= -0.577,
P= 0.039). However, INL thickness differences were not correlated with ganglion cell complex Fig 6. Comparison of retinal nerve fiber layer (RNFL), ganglion cell complex plus inner plexiform layer (GCC+IPL), inner nuclear layer (INL), and outer retinal thickness between at sites with and without microcystic changes.Measurements were taken at the opposite and equidistant site from a horizontal line passing through the foveal center (red line inA) for sites with and without INL lesions.A,An infrared fundus image shows measurement points (white arrows).B,A Spectralis optical coherence tomography (OCT) image along the yellow arrow inA. The RNFL (red bars), GCL+IPL (green bars), INL (yellow bars) and outer retinal thickness (brown bars) measured at sites with and without microcystic lesions (white arrows) and are shown in parts inC, D, E andF, respectively.
thickness differences (-44.5 ± 48.1μm;P= 0.071) and outer retinal thickness differences
(2.6 ± 23.4μm,Fig 6F;P= 0.893).
Discussion
The main finding of this study was that microcystic INL lesions were observed on SD-OCT im-ages in 6.0% eyes with POAG (5.0% if including eyes with preperimetric glaucoma), and the microcystic change location was significantly correlated with that of NFLDs, INL thickening, and RNFL/GCL thinning. Additionally, microcystic lesions were more frequently observed in eyes with advanced stage glaucoma and were significantly associated with worse MD slope of visual field.
Microcystic INL lesions have been observed in eyes with various optic nerve diseases [18–
27]. These microcystic lesions were characterized by an INL hyporeflectivity on OCT B-scans and infrared fundus images. These findings have been reported in about 5% of patients with MS [18,27], a similar incidence to that found in the current study with glaucomatous eyes. Microcystic lesions were equally distributed among the retinal quadrants in MS patients [18], but were mainly observed in the inferior hemisphere in glaucomatous eyes (10 of 13 eyes). This difference in lesion location could result from differences between the two kinds of optic neu-ropathy in optic nerve damage location. Glaucomatous optic neuneu-ropathy occurs, and tends to be more severe, in the inferior quadrants [39], and, based on the results of the current study, microcystic changes are more likely to appear in locations corresponding to visual field defects.
It has been reported that microcystic changes are associated with lower visual acuity in MS patients [18,27]. In the current study, microcystic changes were more likely to be observed in eyes with advanced stage glaucoma (10 of 13 eyes) (Table 2). However, there was no difference in MD value between eyes with POAG with microcystic changes and eyes with POAG and no microcystic changes. Interestingly, there was no eye which manifested microcystic changes with MD value worse than -15.3 dB. There was a significant difference in MD slope between eyes with and without microcystic lesions in eyes with POAG. These results suggest that the microcystic INL lesion is more likely to appear in eyes with rapid progression and without total damage of RNFL and GCL. It was previously reported that younger patients are significantly more likely to develop microcystic changes in eyes with optic neuropathy (excluding glaucoma) [34]. However, we found no significant age difference between patients with and without microcystic changes.
The mechanism by which microcystic changes occur in glaucomatous eyes remains unclear, but several theories have been suggested in patients with other types of optic neuropathy in-cluding MS. These include inflammation induced blood-retinal barrier disruption [18,24,27], Muller cell dysfunction [21], retrograde trans-synaptic degeneration [25,34], vitreous traction [26], and combined of the trans-synaptic degeneration and vitreous traction [40].
We believe that microcystic-like changes are non-specific, non-inflammatory in nature, and are affected, at least in part, by mechanical traction [25,26,40]. Partial PVD, the ILM, and reti-nal arteriole stiffness have all been implicated in causing myopic schisis, which is characterized by an inner retinal separation [32,33]. Eyes with obvious vitreoretinal abnormalities (e.g., ERM and vitreoretinal traction syndrome) were excluded from this study. Only a few eyes had complete PVDs in our study. The vitreous remained attached in the area of microcystic lesions in 76.9% of eyes with microcystic INL lesions (Figs3Dand4D). It should be noted that our tients actually had a lower incidence of complete PVD (23.1%) than that of normal eyes in pa-tients of the same age (48.4%, calculated based on consideration for their ages) [38].
was preserved by ILM and retinal arteriole stiffness. Xin D et al. [41] has reported microcystic changes in the RNFL in glaucomatous eyes and proposed mechanical force as the cause since they were located adjacent to blood vessels and associated with arcuate defects. On the other hand, Brandt et al. [42] has shown that vitreous traction theory is unlikely to be a causative fac-tor in macular microcyst formation using a mechanical model. Green et al. [43] was also oppo-site to vitreous traction theory and stated that there were some cases with complete PVDs with microcystic changes. Indeed, there were also some cases with complete PVDs in our cases. However, we believe that this fact cannot completely deny the mechanical theory. In the cur-rent study, the INL was thicker at the site of the microcystic changes compared to the opposite and equidistant site from a horizontal line passing through the foveal center in the eyes with microcystic lesions. This result is consistent with the previous reports showing thickening of INL and thinning of RNFL and GCL+IPL in NMO or MS patients [22,23,26,27]. We hypoth-esize that ILM and retinal arteriole stiffness themselves may act as scaffolds of retinal thickness and mechanical forces to thicken INL with thinning of RNFL and GCL, which could cause schisis-like microcystic INL changes even after PVDs were occurred.
The retrograde trans-synaptic degeneration mechanism is another theory proposed as a cause of microcystic changes [25,34,44]. It has been reported that trans–synaptic axonal de-generation occurs in the visual pathway of patients with MS [45] and microcystic INL changes in OCT images are very similar to histological findings following retrograde trans-synaptic de-generation from a tumor of the optic nerve [40,46]. Green et al. [47] histologically demonstrat-ed that INL was a prominent site of atrophy in MS eyes. These previous reports support the retrograde trans-synaptic degeneration theory in microcystic INL lesion formation. However, this theory is not likely to be the only pathogenic mechanism in our glaucoma patients because microcystic changes would occur much more frequently in advanced stages of glaucoma if this were the only cause. Additionally, microcystic changes appeared in one eye when only a subtle visual field defect was present and occurred with glaucoma progression. This implies that retro-grade trans-synaptic degeneration was not likely the only cause of microcystic INL lesion development.
The fact that there was no eye which manifested microcystic changes with MD value worse than -15.3 dB might imply the possibility that microcystic changes tend to occur with localized RNFL and GCL thinning rather than widespread RNFL and GCL thinning with severely dam-aged visual field. This fact means that microcystic INL lesion formation could not be explained by only retrograde trans-synaptic degeneration theory. However, we cannot exclude the possi-bility that INL atrophy caused by trans-synaptic degeneration may accelerate mechanical gen-eration of INL microcystic changes together with the INL thickening, the thinning of RNFL and GCL and the stiffness of ILM and retinal arteriole.
The proposed mechanism of inflammation-induced blood retinal barrier disruption seems to be unlikely in glaucomatous cases because fluorescein leakage is not associated with glauco-ma [19,26]. However, it is possible that there are several mechanisms to cause the microcystic INL changes. Blood retinal barrier disruption may affect microcystic INL changes in NMO cases, which are associated with inflammation [48,49] and retinal vascular changes [50]. We cannot deny that the pathogenic mechanism of microcystic INL changes is multifactorial even in glaucoma patients.
progression and relapses in MS patients [27]. Microcystic INL thicknening might offer infor-mation of progressive and focal damage in optic neuropathy including glaucoma.
It is known that SD-OCT allows reproducible measurements of GCC and macular GCC thickness to be made and that these are useful in diagnosing glaucoma [1,3–6,10]. It should be noted that microcystic INL lesions may affect total retinal thickness by increasing INL thick-ness, although total retinal thickness is not generally used for diagnosing and monitoring glau-coma. Furthermore, some eyes with microcystic changes had OCT measurements with obvious GCC autosegmentation errors in areas with microcystic INL lesions (data not shown), even though it was not difficult to manually delineate the GCC. Therefore, physicians should be aware that microcystic lesions may affect automated GCC measurements, depending on the segmentation algorithm used.
This study had several limitations. First, it is a retrospective study and included a relatively high proportion of myopic patients. We chose to include highly myopic eyes in our study be-cause our glaucoma service has many highly myopic glaucoma patients. Therefore, excluding highly myopic patients would have limited our patient numbers and interfered with examining the effect of myopia on microcystic changes. Interestingly, myopia did not statistically affect microcystic lesion development or location. Second, we used a Spectralis OCT macular scan protocol that consisted of 19 vertical line scans to identify microcystic changes [10]. Although this method, in which 50 individual B-scans were averaged to obtain each of the 19 line scans, gave us high quality OCT images, too many averaging of B-scans might lead reduced detection of minute microcystic changes. This scanning protocol is, furthermore, thought to cover almost the entire macula region, but subtle microcystic changes outside of the scanning region could have been overlooked. We defined the microcystic lesions when identified in two or more adja-cent B-scans to avoid false-positive cases. This method possibly underestimated the number of eyes with microcystic lesions. Third, we did not examine associations between fluorescein leak-age and microcystic INL changes because fluorescein angiography had not been routinely per-formed in our patients. However, previous studies did not find leakage in any eye with microcystic INL lesions associated with glaucoma or other optic nerve diseases [19,26].
In conclusion, microcystic INL changes are more frequently observed in eyes with advanced stages of glaucoma without total damage and are associated with progressive visual field defects and localized thinning of RNFL and GCL. Microcystic INL changes may indicate focal and progressive damage in glaucoma.
Supporting Information
S1 File. Specific data of each group.Detail data of POAG group and normal group, and the subjects with microcystic inner nuclear layer lesions.
(XLSX)
Author Contributions
Conceived and designed the experiments: TH TA HN NU HOI NY. Performed the experi-ments: TH MY KS HY YK. Analyzed the data: TH TA MM NU HOI NY. Contributed re-agents/materials/analysis tools: TH TA KS HN. Wrote the paper: TH TA HN HOI NY.
References
2. Quigley HA, Dunkelberger GR, Green WR. Retinal ganglion cell atrophy correlated with automated perimetry in human eyes with glaucoma. Am J Ophthalmol. 1989; 107: 453–464. PMID:2712129
3. Nakano N, Hangai M, Nakanishi H, Mori S, Nukada M, Kotera Y, et al. Macular ganglion cell layer imag-ing in preperimetric glaucoma with speckle noise-reduced spectral domain optical coherence tomogra-phy. Ophthalmology. 2011; 118: 2414–2426. doi:10.1016/j.ophtha.2011.06.015PMID:21924499
4. Kimura Y, Hangai M, Matsumoto A, Akagi T, Ikeda HO, Ohkubo S, et al. Macular structure parameters as an automated indicator of paracentral scotoma in early glaucoma. Am J Ophthalmol. 2013; 156: 907–917 e901. doi:10.1016/j.ajo.2013.06.029PMID:23972895
5. Kotera Y, Hangai M, Hirose F, Mori S, Yoshimura N. Three-dimensional imaging of macular inner struc-tures in glaucoma by using spectral-domain optical coherence tomography. Invest Ophthalmol Vis Sci. 2011; 52: 1412–1421. doi:10.1167/iovs.10-5572PMID:21087959
6. Mwanza JC, Oakley JD, Budenz DL, Chang RT, Knight OJ, Feuer WJ. Macular ganglion cell-inner plex-iform layer: automated detection and thickness reproducibility with spectral domain-optical coherence tomography in glaucoma. Invest Ophthalmol Vis Sci. 2011; 52: 8323–8329. doi:10.1167/iovs.11-7962
PMID:21917932
7. Takayama K, Hangai M, Durbin M, Nakano N, Morooka S, Akagi T, et al. A novel method to detect local ganglion cell loss in early glaucoma using spectral-domain optical coherence tomography. Invest Ophthalmol Vis Sci. 2012; 53: 6904–6913. doi:10.1167/iovs.12-10210PMID:22977136
8. Leung CK, Lam S, Weinreb RN, Liu S, Ye C, Liu L, et al. Retinal nerve fiber layer imaging with spectral-domain optical coherence tomography: analysis of the retinal nerve fiber layer map for glaucoma detec-tion. Ophthalmology. 2010; 117: 1684–1691. doi:10.1016/j.ophtha.2010.01.026PMID:20663563
9. Leung CK, Yu M, Weinreb RN, Lai G, Xu G, Lam DS. Retinal nerve fiber layer imaging with spectral-do-main optical coherence tomography: patterns of retinal nerve fiber layer progression. Ophthalmology. 2012; 119: 1858–1866. doi:10.1016/j.ophtha.2012.03.044PMID:22677426
10. Nakano N, Hangai M, Noma H, Nukada M, Mori S, Morooka S, et al. Macular imaging in highly myopic eyes with and without glaucoma. Am J Ophthalmol. 2013; 156: 511–523 e516. doi:10.1016/j.ajo.2013.
04.028PMID:23777978
11. Choi SS, Zawadzki RJ, Lim MC, Brandt JD, Keltner JL, Doble N, et al. Evidence of outer retinal changes in glaucoma patients as revealed by ultrahigh-resolution in vivo retinal imaging. Br J Ophthalmol. 2011; 95: 131–141. doi:10.1136/bjo.2010.183756PMID:20956277
12. Choi SS, Zawadzki RJ, Keltner JL, Werner JS. Changes in cellular structures revealed by ultra-high resolution retinal imaging in optic neuropathies. Invest Ophthalmol Vis Sci. 2008; 49: 2103–2119. doi:
10.1167/iovs.07-0980PMID:18436843
13. Fan N, Huang N, Lam DS, Leung CK. Measurement of photoreceptor layer in glaucoma: a spectral-do-main optical coherence tomography study. J Ophthalmol. 2011; 2011: 264803. doi:10.1155/2011/ 264803PMID:21845213
14. Guo L, Normando EM, Nizari S, Lara D, Cordeiro MF. Tracking longitudinal retinal changes in experi-mental ocular hypertension using the cSLO and spectral domain-OCT. Invest Ophthalmol Vis Sci. 2010; 51: 6504–6513. doi:10.1167/iovs.10-5551PMID:20688741
15. Nork TM, Ver Hoeve JN, Poulsen GL, Nickells RW, Davis MD, Weber AJ, et al. Swelling and Loss of Photoreceptorsin Chronic Human and Experimental Glaucomas. Arch Ophthalmol. 2000; 118: 235–
245. PMID:10676789
16. Werner JS, Keltner JL, Zawadzki RJ, Choi SS. Outer retinal abnormalities associated with inner retinal pathology in nonglaucomatous and glaucomatous optic neuropathies. Eye (Lond). 2011; 25: 279–289.
doi:10.1038/eye.2010.218PMID:21293495
17. Fazio DT, Heckenlively JR, Martin DA, Christensen RE. The electroretinogram in advanced open-angle glaucoma. Doc Ophthalmol. 1986; 63: 45–54. PMID:3732012
18. Gelfand JM, Nolan R, Schwartz DM, Graves J, Green AJ. Microcystic macular oedema in multiple scle-rosis is associated with disease severity. Brain. 2012; 135: 1786–1793. doi:10.1093/brain/aws098
PMID:22539259
19. Wolff B, Basdekidou C, Vasseur V, Mauget-Faysse M, Sahel JA, Vignal C. Retinal inner nuclear layer microcystic changes in optic nerve atrophy: a novel spectral-domain OCT finding. Retina. 2013; 33: 2133–2138. doi:10.1097/IAE.0b013e31828e68d0PMID:23644558
20. Kaushik M, Wang CY, Barnett MH, Garrick R, Parratt J, Graham SL, et al. Inner nuclear layer thickening is inversley proportional to retinal ganglion cell loss in optic neuritis. PLoS One. 2013; 8: e78341. doi:
10.1371/journal.pone.0078341PMID:24098599
22. Gelfand JM, Cree BA, Nolan R, Arnow S, Green AJ. Microcystic inner nuclear layer abnormalities and neuromyelitis optica. JAMA Neurol. 2013; 70: 629–633. doi:10.1001/jamaneurol.2013.1832PMID:
23529376
23. Kaufhold F, Zimmermann H, Schneider E, Ruprecht K, Paul F, Oberwahrenbrock T, et al. Optic neuritis is associated with inner nuclear layer thickening and microcystic macular edema independently of mul-tiple sclerosis. PLoS One. 2013; 8: e71145. doi:10.1371/journal.pone.0071145PMID:23940706
24. Sotirchos ES, Saidha S, Byraiah G, Mealy MA, Ibrahim MA, Sepah YJ, et al. In vivo identification of morphologic retinal abnormalities in neuromyelitis optica. Neurology. 2013; 80: 1406–1414. doi:10.
1212/WNL.0b013e31828c2f7aPMID:23516321
25. Abegg M, Zinkernagel M, Wolf S. Microcystic macular degeneration from optic neuropathy. Brain. 2012; 135: e225. doi:10.1093/brain/aws215PMID:22960546
26. Barboni P, Carelli V, Savini G, Carbonelli M, La Morgia C, Sadun AA. Microcystic macular degeneration from optic neuropathy: not inflammatory, not trans-synaptic degeneration. Brain. 2013; 136: e239. doi:
10.1093/brain/awt014PMID:23396580
27. Saidha S, Sotirchos ES, Ibrahim MA, Crainiceanu CM, Gelfand JM, Sepah YJ, et al. Microcystic macu-lar oedema, thickness of the inner nuclear layer of the retina, and disease characteristics in multiple sclerosis: a retrospective study. Lancet Neurol. 2012; 11: 963–972. doi:10.1016/S1474-4422(12)
70213-2PMID:23041237
28. Early Treatment Diabetic Retinopathy Study research group. Photocoagulation for diabetic macular edema. Early Treatment Diabetic Retinopathy Study report number 1. Arch Ophthalmol. 1985; 103: 1796–1806. PMID:2866759
29. Marmor MF. Mechanisms of fluid accumulation in retinal edema. Doc Ophthalmol. 1999; 97: 239–249.
PMID:10896337
30. Sugar EA, Jabs DA, Altaweel MM, Lightman S, Acharya N, Vitale AT, et al. Identifying a clinically mean-ingful threshold for change in uveitic macular edema evaluated by optical coherence tomography. Am J Ophthalmol. 2011; 152: 1044–1052 e1045. doi:10.1016/j.ajo.2011.05.028PMID:21861971
31. Johnson MW. Perifoveal vitreous detachment and its macular complications. Trans Am Ophthalmol Soc. 2005; 103: 537–567. PMID:17057817
32. Spaide RF, Fisher Y. Removal of adherent cortical vitreous plaques without removing the internal limit-ing membrane in the repair of macular detachments in highly myopic eyes. Retina. 2005; 25: 290–295.
PMID:15805905
33. VanderBeek BL, Johnson MW. The diversity of traction mechanisms in myopic traction maculopathy. Am J Ophthalmol. 2012; 153: 93–102. doi:10.1016/j.ajo.2011.06.016PMID:21907964
34. Abegg M, Dysli M, Wolf S, Kowal J, Dufour P, Zinkernagel M. Microcystic macular edema: retrograde maculopathy caused by optic neuropathy. Ophthalmology. 2014; 121: 142–149. doi:10.1016/j.ophtha.
2013.08.045PMID:24139122
35. Hodapp E PR, Anderson DR. Clinical decisions in glaucoma. St Louis: Mosby; 1993.
36. Tewarie P, Balk L, Costello F, Green A, Martin R, Schippling S, et al. The OSCAR-IB consensus criteria for retinal OCT quality assessment. PLoS One. 2012; 7: e34823. doi:10.1371/journal.pone.0034823
PMID:22536333
37. Yamada H, Hangai M, Nakano N, Takayama K, Kimura Y, Miyake M, et al. Asymmetry Analysis of Mac-ular Inner Retinal Layers for Glaucoma Diagnosis. Am J Ophthalmol. 2014; 158: 1318–1329 e3. doi:
10.1016/j.ajo.2014.08.040PMID:25194230
38. Itakura H, Kishi S. Evolution of vitreomacular detachment in healthy subjects. JAMA Ophthalmol. 2013; 131: 1348–1352. doi:10.1001/jamaophthalmol.2013.4578PMID:23974841
39. Schiefer U, Papageorgiou E, Sample PA, Pascual JP, Selig B, Krapp E, et al. Spatial pattern of glauco-matous visual field loss obtained with regionally condensed stimulus arrangements. Invest Ophthalmol Vis Sci. 2010; 51: 5685–5689. doi:10.1167/iovs.09-5067PMID:20538998
40. Lujan BJ, Horton JC. Microcysts in the inner nuclear layer from optic atrophy are caused by retrograde trans-synaptic degeneration combined with vitreous traction on the retinal surface. Brain. 2013; 136: e260. doi:10.1093/brain/awt154PMID:23872368
41. Xin D, Talamini CL, Raza AS, de Moraes CG, Greenstein VC, Liebmann JM, et al. Hypodense regions (holes) in the retinal nerve fiber layer in frequency-domain OCT scans of glaucoma patients and sus-pects. Invest Ophthalmol Vis Sci. 2011; 52: 7180–7186. doi:10.1167/iovs.11-7716PMID:21791587
42. Brandt AU, Oberwahrenbrock T, Kadas EM, Lagreze WA, Paul F. Dynamic formation of macular micro-cysts independent of vitreous traction changes. Neurology. 2014; 83: 73–77. doi:10.1212/WNL.
43. Green AJ, Schwartz D, Gelfand J. Reply: Microcysts in the inner nuclear layer from optic atrophy are caused by retrograde trans-synaptic degeneration combined with vitreous traction on the retinal sur-face. Brain. 2013; 136: e261. doi:10.1093/brain/awt155PMID:23872367
44. Sigler EJ, Randolph JC, Charles S. Delayed onset inner nuclear layer cystic changes following internal limiting membrane removal for epimacular membrane. Graefes Arch Clin Exp Ophthalmol. 2013; 251: 1679–1685. doi:10.1007/s00417-012-2253-8PMID:23306785
45. Balk LJ, Steenwijk MD, Tewarie P, Daams M, Killestein J, Wattjes MP, et al. Bidirectional trans-synaptic axonal degeneration in the visual pathway in multiple sclerosis. J Neurol Neurosurg Psychiatry. 2015; 86: 419–424. doi:10.1136/jnnp-2014-308189PMID:24973342
46. Vanburen JM. Trans-synaptic retrograde degeneration in the visual system of primates. J Neurol Neu-rosurg Psychiatry. 1963; 26: 402–409. PMID:14066630
47. Green AJ, McQuaid S, Hauser SL, Allen IV, Lyness R. Ocular pathology in multiple sclerosis: retinal at-rophy and inflammation irrespective of disease duration. Brain. 2010; 133: 1591–1601. doi:10.1093/
brain/awq080PMID:20410146
48. Cree B. Neuromyelitis optica: diagnosis, pathogenesis, and treatment. Curr Neurol Neurosci Rep. 2008; 8: 427–433. PMID:18713580
49. Jacob A, Matiello M, Wingerchuk DM, Lucchinetti CF, Pittock SJ, Weinshenker BG. Neuromyelitis optica: changing concepts. J Neuroimmunol. 2007; 187: 126–138. PMID:17512987
50. Green AJ, Cree BA. Distinctive retinal nerve fibre layer and vascular changes in neuromyelitis optica following optic neuritis. J Neurol Neurosurg Psychiatry. 2009; 80: 1002–1005. doi:10.1136/jnnp.2008.