Analysis of Retinal Layer Thicknesses and
Their Clinical Correlation in Patients with
Traumatic Optic Neuropathy
Ju-Yeun Lee, Kyuyeon Cho, Kyung-Ah Park, Sei Yeul Oh*
Department of Ophthalmology, Samsung Medical Center, Sungkyunkwan University School of Medicine, Seoul, Korea
Abstract
The aims of this study were 1) To evaluate retinal nerve fiber layer (fRNFL) thickness and ganglion cell layer plus inner plexiform layer (GCIPL) thickness at the fovea in eyes affected with traumatic optic neuropathy (TON) compared with contralateral normal eyes, 2) to fur-ther evaluate these thicknesses within 3 weeks following trauma (defined as“early TON”), and 3) to investigate the relationship between these retinal layer thicknesses and visual function in TON eyes. Twenty-nine patients with unilateral TON were included. Horizontal and vertical spectral-domain optical coherence tomography (SD-OCT) scans of the fovea were taken in patients with unilateral TON. The main outcome measure was thickness of the entire retina, fRNFL, and GCIPL in eight areas. Thickness of each retinal layer was com-pared between affected and unaffected eyes. The correlation between the thickness of each retinal layer and visual function parameters, including best corrected visual acuity, color vision, P100 latency, and P100 amplitude in visual evoked potential (VEP), mean devi-ation (MD) and visual field index (VFI) in Humphrey visual field analysis in TON eyes was analyzed. Thicknesses of the entire retina, fRNFL, and GCIPL in SD-OCT were significantly thinner (3–36%) in all measurement areas of TON eyes compared to those in healthy eyes (allp<0.05). Whereas, only GCIPL in the outer nasal, superior, and inferior areas was signif-icantly thinner (5–10%) in the early TON eyes than that in the control eyes (allp<0.01). A significant correlation was detected between retinal layer thicknesses and visual function parameters including color vision, P100 latency and P100 amplitude in VEP, MD, and VFI (particularly P100 latency, MD, and VFI) (r = -0.70 to 0.84). Among the retinal layers ana-lyzed in this study, GCIPL (particularly in the superior and inferior areas) was most corre-lated with these five visual function parameters (r = -0.70 to 0.71). Therefore, evaluation of morphological change of each retinal layer using SD-OCT can help in understanding TON pathophysiology and indirectly assessing visual function. Moreover, evaluation of the mor-phological change of the GCIPL in TON eyes may be useful to assess visual function in patients with early TON.
a11111
OPEN ACCESS
Citation:Lee J-Y, Cho K, Park K-A, Oh SY (2016) Analysis of Retinal Layer Thicknesses and Their Clinical Correlation in Patients with Traumatic Optic Neuropathy. PLoS ONE 11(6): e0157388. doi:10.1371/journal.pone.0157388
Editor:Michael G Anderson, University of Iowa, UNITED STATES
Received:December 23, 2015
Accepted:May 27, 2016
Published:June 13, 2016
Copyright:© 2016 Lee et al. This is an open access article distributed under the terms of theCreative Commons Attribution License, which permits unrestricted use, distribution, and reproduction in any medium, provided the original author and source are credited.
Data Availability Statement:All relevant data are within the paper and its Supporting Information files.
Funding:The authors have no support or funding to report.
Introduction
Previous studies have investigated the functional and morphological changes in the retina fol-lowing optic nerve injury in patients with various optic nerve disorders, such as glaucoma, ischemic optic neuropathy, and optic neuritis.[1–4] Optic nerve injury in animal models devel-ops axonal damage and retinal ganglion cell (RGC) degeneration.[1,3] These degenerative changes lead to morphological changes in the retina and significant thinning of retinal layers.
Spectral-domain optical coherence tomography (SD-OCT) has been widely adopted as non-invasive method to track structural changes in retinal layers. SD-OCT can delineate structures with an axial resolution of 5–7μm,[5] and provides clear imaging of retinal layers to help
diag-nose optic nerve disorders. SD-OCT cross-sectional images provide quantitative morphologi-cal information of retinal layers. Thus, SD-OCT has been used to measure retinal thickness for evaluating structural damages in the peripapillary area and macula in patients with optic nerve disorders.
Peripapillary RNFL (cpRNFL) thickness measured by SD-OCT could be a quantitative marker of optic nerve disorders.[6] Along with cpRNFL, loss of the macular ganglion cell com-plex reflects structural damage to RGCs and their axons following optic nerve damage.[7] The macular ganglion cell complex consists of three retinal layers, including the nerve fiber layer (NFL), the ganglion cell layer (GCL), and the inner plexiform layer (IPL) and can be measured by OCT; thus, many trials have evaluated the macular ganglion cell complex using SD-OCT in patients with many optic nerve disorders.[8–12]
Traumatic optic neuropathy (TON) refers to optic nerve injury secondary to trauma and causes acute axonal loss with severe visual impairment. The mechanism underlying axonal injury-induced RGC degeneration can also occur in patients with TON. A number of pre-clinic studies have demonstrated retinal neural degeneration in animal models of TON using SD-OCT.[1,13,14] They reported early thinning of the cpRNFL and early loss of RGC density after optic nerve injury.[13]
Although many studies have demonstrated morphological or histological changes in the ret-ina of animal models following optic nerve injury,[1,13–17] few studies have clinically assessed morphological changes in retinal layer thickness at the fovea using SD-OCT in patients with early stage TON. In addition, no study has evaluated the relationship between thicknesses of the retinal layers and visual function in patients with TON.
Therefore, the aims of this study were 1) to evaluate the RNFL and GCL + IPL (GCIPL) thicknesses in four different directions of the fovea in TON eyes compared with those in con-tralateral normal eyes, 2) to further evaluate these thicknesses within 3 weeks after trauma (early stage TON), and 3) to investigate the relationship between thicknesses of these retinal layers and visual function in TON eyes.
Methods
This hospital-based retrospective observational study was a single center study performed from 2012 to 2014 in accordance with the tenets of the Declaration of Helsinki. This study was approved by the institutional review board of the Samsung Medical Center. Patient records were anonymized and de-identified prior to analysis.
intracranial lesions were excluded. Patients who underwent SD-OCT more than 3 months after trauma were also excluded.
Unilateral indirect TON was diagnosed by a history of blunt trauma, clinical manifestations with the evidence of optic neuropathy, and magnetic resonance imaging (MRI) of the orbit. TON was characterized by subconjunctival hemorrhage, decreased visual acuity and color vision with a relative afferent pupillary defect in one eye, a normal fundus, and no immediate changes in the optic nerve with MRI findings consistent with optic neuropathy during the early post-traumatic period in the context of a history of non-penetrating trauma to the forehead or malar region. Since indirect TON is a clinical diagnosis typically made when there is evidence of optic neuropathy related to blunt trauma,[18] patients who had a history of blunt trauma and clinical manifestations with the evidence of optic neuropathy but normal MRI findings, were also considered to have TON, and they were enrolled in this study.
T1 and T2 weighted, fat suppressed MRI images were acquired axially through the orbit and some parts of the brain including the intracranial portion of the optic nerve. The images which showed hyper-intensity in the unilateral optic nerve or optic nerve swelling without the pres-ence of optic canal fracture, a displaced bony fragment impinging upon the optic nerve, a metallic foreign body in the orbit, or an optic nerve sheath hematoma were considered to indi-cate‘TON’.
All study participants underwent a detailed ophthalmologic examination, including assess-ment of refraction, best-corrected visual acuity (BCVA), color vision, relative afferent pupillary defect, slit-lamp examination of the anterior segment, tonometry, and a fundus examination. All patients underwent MRI of the orbit, pattern visual evoked potential (VEP) testing, auto-mated perimetry using the central 30–2 VF test (HFA model 460; Humphrey Instruments Inc., San Leandro, CA, USA) and macular and disc SD-OCT at the first visit. Data on sex, age, BCVA, color vision, P100 latency and P100 wave amplitude of the VEP, the mean deviation (MD) value, and visual field index (VFI) on the Humphrey visual field analysis were collected from the electronic records of each patient. Corrected visual acuities were transformed to a log-arithmic scale (logMAR) for statistical analysis.
Color vision data were collected using Ishihara color vision test 24 plate edition. The test was performed in a well-lit room with a light level of approximately 325 lux, and no glare on the patient’s screen. The plates were held 75cm from the subject and tilted so that the plane of the paper was at right angles to the line of vision. The numerals which were seen on plates were stated, and each answer should be given without more than three seconds delay. In this study, since the color vision test was designed to separate the color defectives from those with normal color appreciation, color vision test was performed with 15 plates. Patients who have congenital color vision deficiency were excluded. Color vision was recorded as the number of correct answers in a set of 15 plates.[19]
with simultaneous stimulus and same method regardless of a presence of TON. To verify the data quality, we also performed VEP with binocular stimulation (both eyes simultaneously) as well as monocular stimulation. For example, when a normal response was reported in both eyes whereas a delayed response of the P100 wave was reported in the right eye, VEP was per-formed again for obtaining accurate results based on the possibility of a false response in the right eye. Fixation cooperation was monitored closely by an experienced technician. For accu-rate measurements during the PVEP test, all patients were evaluated by one examiner. Data on latency and amplitude of P100 wave were collected for analysis in this study.
VFI was introduced for estimating the rate of change in visual field on Humphrey field analysis. This index addresses several shortcomings of the MD, and unlike the MD, the VFI expresses the amount of visual field loss as a percentage compared to the sensitivity of a healthy reference group. A VFI of 100% would be observed in a completely normal visual field, whereas a VFI of 0% in a perimetrically blind visual field.[21] Since MD and VFI have a significant cor-relation and can provide equivalent information about the visual field,[22,23] we used both parameters for analysis in this study.
All OCT scans were performed with a SD-OCT that provided 40,000 A-scans/sec with 7μm
optical and 3.5μm digital axial resolution. Horizontal and vertical SD-OCT scans of the fovea
were obtained in all subjects. All OCT images were converted to grey scale for better visualiza-tion and accurate analysis. The thickness of each retinal layer was measured manually using in the SD-OCT caliper instrument.
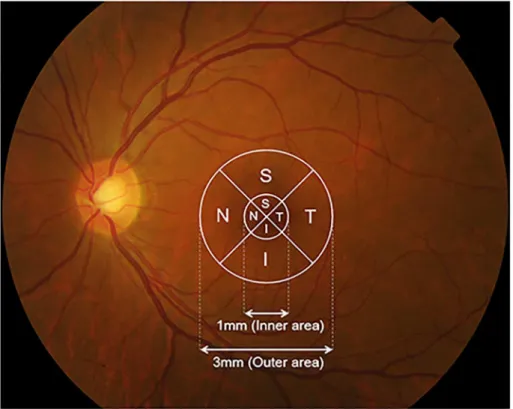
Image measurements were similar to published methods.[24] Thickness at the foveal center was defined as the mean value from horizontal and vertical scans. The thickness values for the inner areas, including the inner superior, inner nasal, inner temporal, and inner inferior areas were measured in the ETDRS central circular 1000μm-diameter area (500μm in either
direc-tion from the foveal center) (Fig 1). Thicknesses of the outer areas, including the outer supe-rior, outer nasal, outer temporal, and outer inferior areas were measured in the ETDRS circular 3000μm-diameter area (1500μm in either direction from the foveal center). The only
modifica-tion compared to the standard ETDRS was that we measured thickness values in four direc-tions even in the smallest circular 1000μm-diameter area.
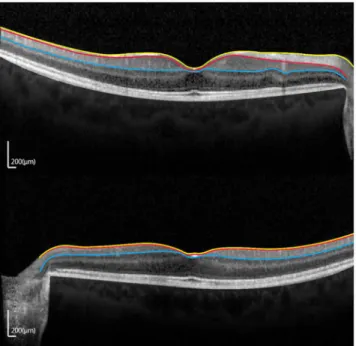
Based on this method, thicknesses of the RNFL (fRNFL), GCIPL, and entire retina in the outer areas and thicknesses of the GCIPL and entire retina in the inner areas were measured manually (Fig 2). Since occasionally the automatic boundary line in SD-OCT software did not exactly fit the real boundary of the retinal layer, we measured each thickness value manually with the SD-OCT instrument for a more accurate analysis.
The thicknesses of each retinal layer in affected eyes were compared with measurements at corresponding points in contralateral unaffected eyes. The images were taken by an experi-enced technician. Two experiexperi-enced examiners (J.L and K.C), who were blinded to the study results, analyzed all images.
Inter-observer reproducibility was evaluated based on the intraclass correlation coefficient (ICC). The two examiners evaluated the images again, and the same images were used for this evaluation. The intra-observer ICC value was also calculated after this analysis.
Results
A total of 29 patients were enrolled (23 males and 6 females; mean age, 42 ± 22 years; range, 8–81 years). All patients had a history of blunt trauma and reported visual impairment just after trauma. The mean time between trauma and the first SD-OCT scan was 5.6 ± 4.0 weeks (40 ± 30 days). Among all subjects, 10 were classified as early TON within 3 weeks after trauma, and their mean time between trauma and the first SD-OCT scan was 1.5 ± 1.0 weeks
Fig 1. Thickness data from the map of each layer were grounded within 2 concentric circles.The retinal areas are displayed on a fundus photograph.
doi:10.1371/journal.pone.0157388.g001
Fig 2. A representative spectral domain optical coherence tomography image obtained in the left eye of one subject in this study.(RNFL, retinal nerve fiber layer; GCIPL, ganglion cell and inner plexiform layer).
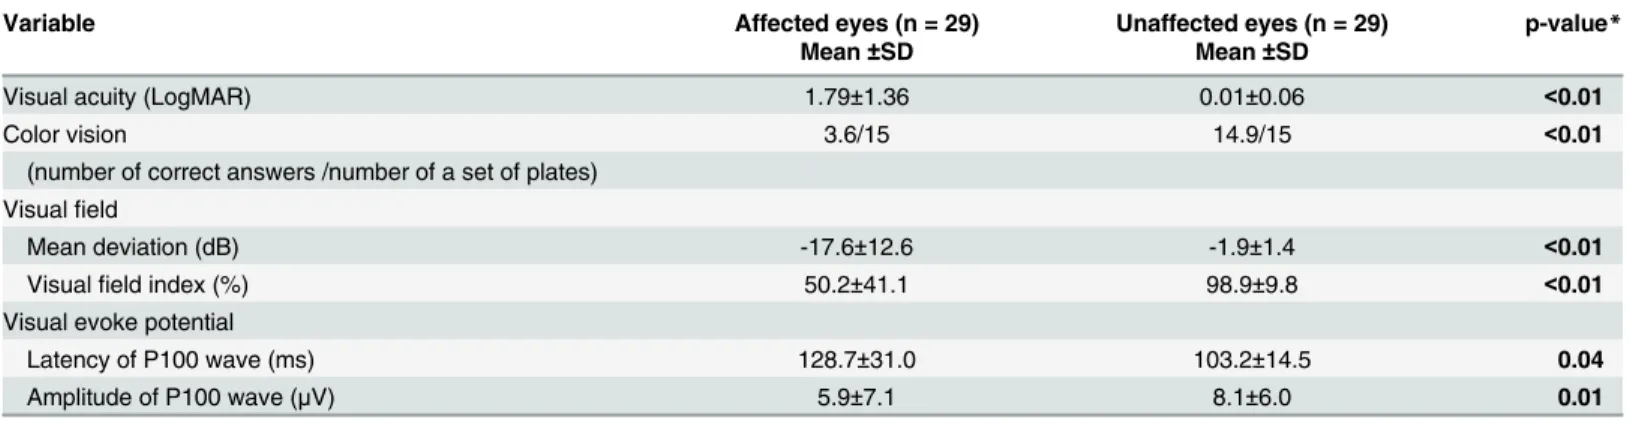
(12 ± 7 days). Intraocular pressure was within the normal range in every case. No patient had a history of surgery due to a mid-facial or orbital fracture or optic neuropathy. The patient demographics are shown inTable 1.Table 2presents the descriptive statistics of functional and vision testing, including LogMAR visual acuity, Ishihara color vision test, the Humphrey visual field analysis, and PVEP. Significant differences were observed between affected eyes and unaf-fected eyes for nine parameters.
Comparison of retinal layer thicknesses at the foveal center in patients
with TON
Thicknesses of the entire retina, fRNFL, and GCIPL in patients with all stages of TON are pre-sented inTable 3. All measurements decreased significantly (Fig 3).
Comparison of retinal layer thickness at the foveal center in patients with
early TON
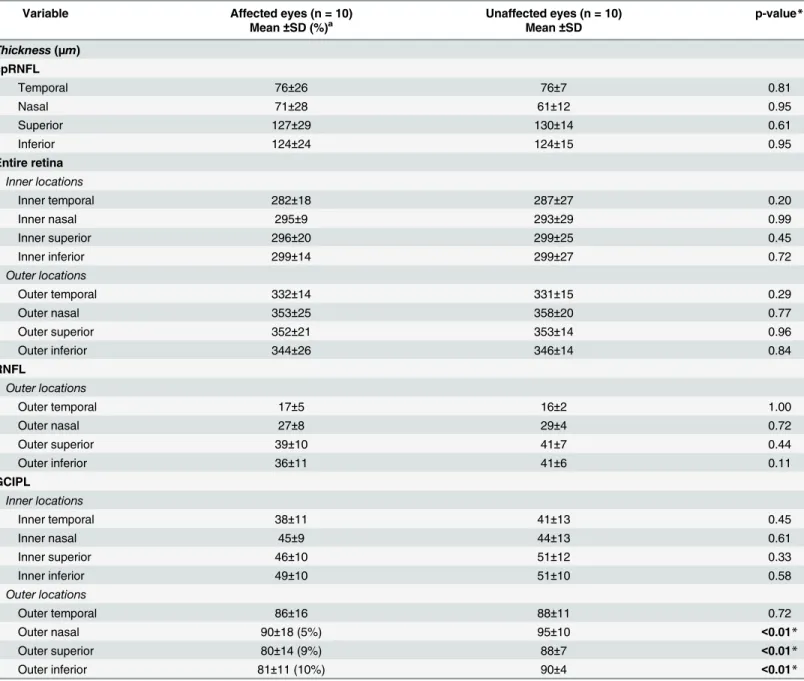
Thicknesses of the entire retina, fRNFL, and GCIPL in patients with early TON are presented inTable 4. GCIPL thickness measurements at the outer nasal, superior, and outer inferior areas showed significant reductions (allp =0.005) (Fig 4). No marked reduction in cpRNFL, entire retina, or fRNFL thicknesses was observed in any area.
Table 1. Demographics of patients with unilateral traumatic optic neuropathy.
Variable Affected eyes (n = 29) Unaffected eyes (n = 29) p-value*
Mean±SD Mean±SD
Age (years) 42±22
-Gender (male/female) 23/6
-Interval between trauma and OCT (days) 40±30 (range, 3–90)
-Refractive error (prism diopter) -1.69±2.26 -1.33±1.51 0.25
Intraocular pressure (mmHg) 16.1±3.5 14.5±3.0 0.59
*paired t test
doi:10.1371/journal.pone.0157388.t001
Table 2. Descriptive statistics of the functional and vision tests in all patients.
Variable Affected eyes (n = 29) Unaffected eyes (n = 29) p-value*
Mean±SD Mean±SD
Visual acuity (LogMAR) 1.79±1.36 0.01±0.06 <0.01
Color vision 3.6/15 14.9/15 <0.01
(number of correct answers /number of a set of plates) Visualfield
Mean deviation (dB) -17.6±12.6 -1.9±1.4 <0.01
Visualfield index (%) 50.2±41.1 98.9±9.8 <0.01
Visual evoke potential
Latency of P100 wave (ms) 128.7±31.0 103.2±14.5 0.04
Amplitude of P100 wave (μV) 5.9±7.1 8.1±6.0 0.01
*p<0.05, Wilcoxon sign-rank test
Correlation between retinal layer thickness and visual function
The correlations between the retinal layer thickness measurements and visual function are pre-sented inTable 5. The MD and VFI on the Humphrey field analysis were significantly corre-lated with entire retina, fRNFL, and GCIPL thicknesses. P100 latencies were significantly negatively correlated with outer temporal and outer superior fRNFL thicknesses and all GCIPL
Table 3. Retinal layer thicknesses measured by spectral domain optical coherence tomography in both eyes of all patients with unilateral trau-matic optic neuropathy.All measurements were significantly smaller in TON eyes than those in unaffected eyes. (Wilcoxon sign rank test).
Variable Affected eyes (n = 29) Unaffected eyes (n = 29) p-value*
Mean±SD (%)a Mean
±SD
Thickness(μm) cpRNFL
Temporal 59±25 (23%) 77±14 <0.01*
Nasal 51±26 (20%) 64±15 <0.01*
Superior 101±35 (22%) 129±17 <0.01*
Inferior 98±37 (21%) 124±16 <0.01*
Entire retina
Inner locations
Inner temporal 278±10 (3%) 289±22 <0.01*
Inner nasal 286±20 (3%) 296±26 <0.01*
Inner superior 290±18 (3%) 299±21 <0.01*
Inner inferior 291±17 (3%) 298±21 0.03*
Outer locations
Outer temporal 319±22 (4%) 333±15 <0.01*
Outer nasal 335±30 (6%) 358±22 <0.01*
Outer superior 336±28 (6%) 356±17 <0.01*
Outer inferior 327±29 (5%) 344±18 <0.01*
fRNFL
Outer locations
Outer temporal 14±6 (12%) 16±3 <0.01*
Outer nasal 20±10 (29%) 28±5 <0.01*
Outer superior 27±14 (32%) 40±5 <0.01*
Outer inferior 27±12 (36%) 42±6 <0.01*
GCIPL
Inner locations
Inner temporal 33±12 (25%) 44±14 <0.01*
Inner nasal 35±12 (26%) 47±13 <0.01*
Inner superior 37±16 (26%) 50±12 <0.01*
Inner inferior 38±15 (25%) 51±12 <0.01*
Outer locations <0.01*
Outer temporal 72±21 (20%) 90±9 <0.01*
Outer nasal 74±23 (24%) 97±13 <0.01*
Outer superior 71±19 (20%) 89±9 <0.01*
Outer inferior 73±17 (19%) 90±9 <0.01*
SD, standard deviation; cpRNFL, peripapillary retinal nervefiber layer; fRNFL, foveal retinal nervefiber layer; GCIPL, ganglion cell layer and inner plexiform layer
a% change of the affected eye compared with the contralateral eye *p<0.05, Wilcoxon sign-rank test
thickness measurements. Peak to peak P100 amplitude was significantly positively correlated with the GCIPL thickness measurements at all areas, except the outer temporal and outer nasal areas. In addition, color vision was significantly positively correlated with the inner nasal and inner superior GCIPL thickness measurements. LogMAR BCVA was not associated with the retinal thickness measurements.
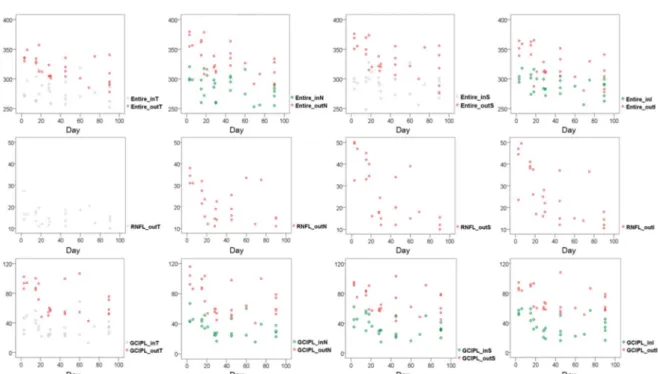
Correlation between retinal thickness and the time after injury
The correlations between retinal thickness measurements and the time after injury are pre-sented inFig 5. All retinal thickness measurements except for outer temporal areas of the entire retina, fRNFL and GCIPL and inner superior area of entire retina were negatively correlated with the time of injury.
Intraobserver reproducibility and interobserver variability was all over 0.80. Excellent agree-ment was determined for intra- and inter-observer ICC reproducibility for all retinal layer thickness measurements.
Discussion
Several studies have reported retinal layer thickness to investigate reduced retinal activity fol-lowing optic nerve injury. Kanamori et al. reported a longitudinal change in thicknesses of the entire retina, cpRNFL, and RGC complex at 2,3,4,12 and 20 weeks after trauma in four patients. Cunha et al. also investigated progressive macular and cpRNFL thickness reduction over the first 12 weeks following traumatic optic neuropathy in three patients.[25] However, most studies had small sample sizes and did not evaluate the relationship between morphological changes in the retina and visual function in patients with TON. Furthermore, most studies esti-mated cpRNFL to evaluate axonal loss and few studies have focused on foveal RNFL in patients with TON. Therefore, we conducted this study with a larger sample size and evaluated retinal
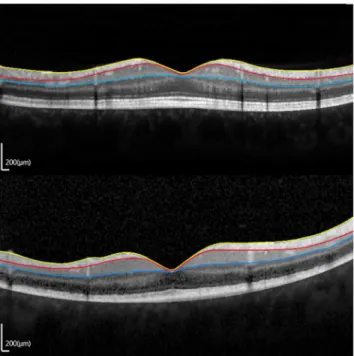
Fig 3. Optical coherence tomography scan images (1:1 pixel views) showing the representative images in eyes with unilateral traumatic optic neuropathy (TON).(A) Contralateral normal eye. (B) TON eye. (RNFL, retinal nerve fiber layer; GCIPL, ganglion cell layer and inner plexiform layer.).
layer thicknesses at the fovea, including the entire retina, fRNFL, and GCIPL using SD-OCT and the relationship between these retinal layer thicknesses and clinical parameters in patients with unilateral TON.
We demonstrated significant thinning of RNFL, GCIPL, and total macular thicknesses at the fovea in TON eyes. As TON results in loss of RGCs and their axons, damage likely affected
Table 4. Retinal layer thicknesses measured by spectral domain optical coherence tomography in both of patients with early traumatic optic neu-ropathy (within 3 weeks after trauma).Outer superior and outer inferior GCIPL thicknesses were significantly thinner in the affected eyes than those in unaffected eyes (Wilcoxon sign-rank test).
Variable Affected eyes (n = 10) Unaffected eyes (n = 10) p-value*
Mean±SD (%)a Mean
±SD
Thickness(μm)
cpRNFL
Temporal 76±26 76±7 0.81
Nasal 71±28 61±12 0.95
Superior 127±29 130±14 0.61
Inferior 124±24 124±15 0.95
Entire retina
Inner locations
Inner temporal 282±18 287±27 0.20
Inner nasal 295±9 293±29 0.99
Inner superior 296±20 299±25 0.45
Inner inferior 299±14 299±27 0.72
Outer locations
Outer temporal 332±14 331±15 0.29
Outer nasal 353±25 358±20 0.77
Outer superior 352±21 353±14 0.96
Outer inferior 344±26 346±14 0.84
RNFL
Outer locations
Outer temporal 17±5 16±2 1.00
Outer nasal 27±8 29±4 0.72
Outer superior 39±10 41±7 0.44
Outer inferior 36±11 41±6 0.11
GCIPL
Inner locations
Inner temporal 38±11 41±13 0.45
Inner nasal 45±9 44±13 0.61
Inner superior 46±10 51±12 0.33
Inner inferior 49±10 51±10 0.58
Outer locations
Outer temporal 86±16 88±11 0.72
Outer nasal 90±18 (5%) 95±10 <0.01*
Outer superior 80±14 (9%) 88±7 <0.01*
Outer inferior 81±11 (10%) 90±4 <0.01*
SD, standard deviation; cpRNFL, peripapillary retinal nervefiber layer; fRNFL, foveal retinal nervefiber layer; GCIPL, ganglion cell layer and inner plexiform layer
a% change of the affected eye compared with the contralateral eye
*p<0.05, Wilcoxon sign-rank test
the RNFL and GCL. In addition, RGC synapses are located in the IPL; thus, changes in this layer are also expected following an optic nerve injury. Hence, we evaluated GCL plus IPL (GCIPL) thickness to assess all possible changes in TON. As GCIPL accounts for up to 40% of total retinal thickness, total retinal thickness can also decrease along with a reduction in GCIPL thickness.[25] These findings agree well with previous studies. A number of authors docu-mented morphological changes in retinal layers by SD-OCT following indirect or direct optic nerve injury which could lead to optic neuropathy.[1,13,14,26] Liu et al. demonstrated a strong correlation between RGC density and retinal layer thickness, and reported an exponen-tial decline in the number of RGCs and significant thinning of corresponding retinal layers on SD-OCT following optic nerve crush in mice.[1] These morphologic changes detected by SD-OCT have also been reported in humans. Kanamori et al. reported that cpRNFL and GCL thicknesses are stable within 1 week after trauma but start to decrease within 2 weeks.[27] Cunha et al. reported a 12% reduction in total macular thickness over 5 weeks in patients with TON.
Interestingly, the timing of the morphological changes in the retina needs special mention with regard to the timing of optic atrophy. Optic disc becomes progressively pale and atrophic 3–5 weeks after trauma.[18] At the timing of OCT, we did not detect any significant change in optic nerve head on the fundus examination or on disc SD-OCT. We detected a tendency for mean fRNFL thickness to decrease, whereas there was a marked reduction in GCIPL thickness at the outer nasal, superior, and inferior locations. This result suggests that the morphological changes in GCIPL may precede the changes in fRNFL in early TON and that it may occur before optic atrophy. This neurodegenerative progression observed early TON is supported by early loss of RGC soma.[1,3] Munguba et al. reported that RGC soma counts initially decline faster than NFL thicknessin vivoas an overall measurable change following optic nerve injury in animal model.[13] The histology data showed a>80% reduction in surviving RGCs 3 weeks
Fig 4. Vertical optical coherence tomography scan images (1:1 pixel views) showing a representative image in eyes with traumatic optic neuropathy (TON) within 3 weeks after trauma (early TON).(A) TON eye. (B) Contralateral unaffected eye. (RNFL, retinal nerve fiber layer; GCIPL, ganglion cell layer and inner plexiform layer.)
following optic nerve injury. Mouse RNFL appeared unchanged until70% RGC loss occurred.[26] In addition, fRNFL thickness on SD-OCT does not decreased exponentially in patients with early TON.[28] Thus, these findings support the acute nature of optic nerve injury in which morphological changes derived from early RGC cell body and dendrite loss precede those from axonal loss and optic nerve atrophy.
Furthermore, our results show segmented RGC loss according to location after trauma. A 5–10% reduction in GCIPL thickness was observed at the outer nasal, superior, and inferior areas in patients with early TON, and thinning of the GCIPL was more distinct in the outer superior and inferior areas than that in the outer nasal area. This pattern of the early GCIPL damage is similar to glaucomatous damage in which relatively large reduction of GCIPL in the superior and inferior area, whereas sparing the GCIPL in the temporal area. In glaucoma,
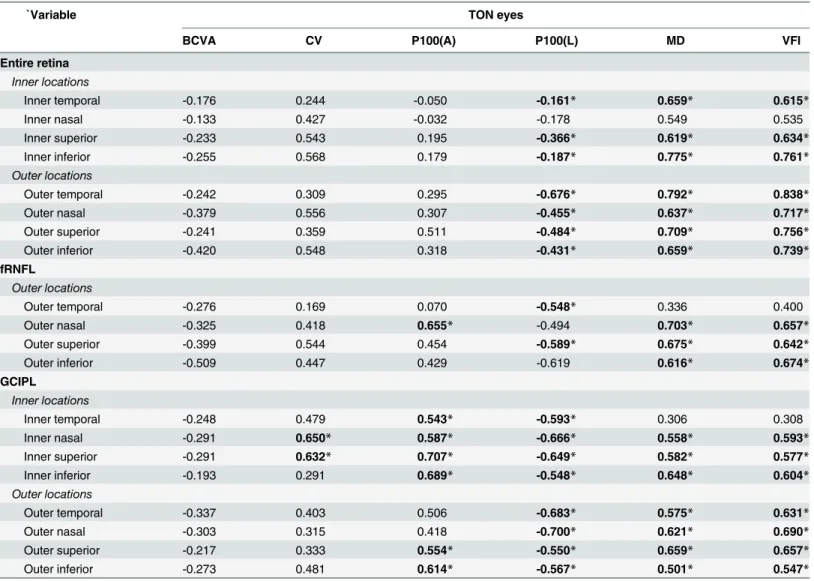
Table 5. Correlation between retinal layer thickness measurements and visual function.
`Variable TON eyes
BCVA CV P100(A) P100(L) MD VFI
Entire retina
Inner locations
Inner temporal -0.176 0.244 -0.050 -0.161* 0.659* 0.615*
Inner nasal -0.133 0.427 -0.032 -0.178 0.549 0.535
Inner superior -0.233 0.543 0.195 -0.366* 0.619* 0.634*
Inner inferior -0.255 0.568 0.179 -0.187* 0.775* 0.761*
Outer locations
Outer temporal -0.242 0.309 0.295 -0.676* 0.792* 0.838*
Outer nasal -0.379 0.556 0.307 -0.455* 0.637* 0.717*
Outer superior -0.241 0.359 0.511 -0.484* 0.709* 0.756*
Outer inferior -0.420 0.548 0.318 -0.431* 0.659* 0.739*
fRNFL
Outer locations
Outer temporal -0.276 0.169 0.070 -0.548* 0.336 0.400
Outer nasal -0.325 0.418 0.655* -0.494 0.703* 0.657*
Outer superior -0.399 0.544 0.454 -0.589* 0.675* 0.642*
Outer inferior -0.509 0.447 0.429 -0.619 0.616* 0.674*
GCIPL
Inner locations
Inner temporal -0.248 0.479 0.543* -0.593* 0.306 0.308
Inner nasal -0.291 0.650* 0.587* -0.666* 0.558* 0.593*
Inner superior -0.291 0.632* 0.707* -0.649* 0.582* 0.577*
Inner inferior -0.193 0.291 0.689* -0.548* 0.648* 0.604*
Outer locations
Outer temporal -0.337 0.403 0.506 -0.683* 0.575* 0.631*
Outer nasal -0.303 0.315 0.418 -0.700* 0.621* 0.690*
Outer superior -0.217 0.333 0.554* -0.550* 0.659* 0.657*
Outer inferior -0.273 0.481 0.614* -0.567* 0.501* 0.547*
BCVA, best corrected visual acuity; CV, color vision; P100(A), peak to peak amplitude of P100 wave in visual evoked potential; P100(L), latency of P100 wave in visual evoked potential; MD, mean deviation in Humphreyfield analysis; VFI, visualfield index in Humphreyfield analysis; fRNFL, foveal retinal nervefiber layer; GCIPL, ganglion cell layer and inner plexiform layer
*p<0.05, spearman correlation
arcuate fibers passing through the superior and inferior portions of the laminar cribrosa are generally known as the most vulnerable zone due to less connective tissue support, whereas the temporal portion is the last to be damaged.[29] In TON, at the moment of trauma, an instanta-neous external force can cause injury in the lamina cribrosa particularly the vulnerable superior and inferior portions, and this can lead to axonal damage in the injured areas. Although the reason for this result is unclear, it is assumed that mechanisms responsible for death of RGCs in TON may be partially consistent with glaucoma. This neurodegenerative progression pro-vides valuable information regarding early TON pathophysiology.
We also found a significant correlation between structural damage to the retina and visual function change. The results showed that greater thinning of the RNFL and GCIPL was corre-lated with a visual field defect. We observed a 30% reduction in RNFL thickness and at least a 25% reduction in GCIPL thickness in eyes with TON. One study reported that a reduction of at least 25% in the RGC complex is correlated with statistical abnormalities in automated perime-try.[30] The results of the present study accord well with previous studies that report the corre-lation between structural damage to the axons of the optic nerve and visual field defect in various optic neuropathies.[31–36] Dotan et al. demonstrated a significant correlation between cpRNFL thickness and MD of the visual field (r = 0.457) in non-arteritic anterior ischemic optic neuropathy.[33] Le and associates also reported a significant regional correlation between GCC loss, RNFL loss, and visual field defects in glaucoma.[34] In addition, Lennartsson and the associates demonstrated that reduced cpRNFL thickness was correlated with MD in patients with immature optic radiation which causes severe RNFL loss.[36] Based on these studies, we can consider fRNFL and GCIPL thickness as useful predictors for visual field defects in patients with TON.
We observed that the mean MD value in the eye unaffected with TON was -1.9 dB in this study. This can be explained by the fact that four patients had cataract which could affect MD in unaffected eyes. These four patients had normal color vision, no optic disc pallor, neither
Fig 5. Multi-panel figures showing correlations between retinal thickness and the time after injury using Spearman correlation.(red and green:p<0.05, gray: not significant).
p100 delay nor p100 amplitude decrease, and no abnormal MRI findings. Hence, we consid-ered that these eyes were not affected by TON, and we enrolled them in this study. Despite this condition, the mean MD value was normal within -2.0 dB in eyes unaffected by TON.[37]
We also detected a significant correlation between retinal layer thickness and the PVEP results. VEP has long been used as an objective test of visual function, and it is compatible with RGC function.[38,39] Prolonged P100 latency is more reliable than reduced P100 wave ampli-tude to evaluate visual function.[40] In this study, P100 latency was correlated with retinal layer thickness measurements in 17 areas, whereas P100 amplitude was correlated with retinal layer thickness measurements in only seven areas. Among all retinal layers analyzed in this study, the GCIPL was most correlated with the PVEP parameters, and some GCIPL thickness values were strongly correlated with PVEP parameters (>0.7). These findings suggest that we can anticipate visual function based on thicknesses of the retinal layers, especially the GCIPL. However, one study reported that PVEP did not have any significant correlation with RNFL thickness. In this study, results showed that the degree of correlation between PVEP parame-ters and entire retina and RNFL thickness was not very strong (<0.7). Thus, caution should be exercised while interpreting this data. However, since there is no study that evaluated the corre-lation between PVEP parameters and GCIPL thickness, further well-controlled study is needed to verify this relatively strong relationship between PVEP and GCIPL.
Notably, GCIPL (particularly at the superior and inferior areas) was the most correlated with visual function parameters among the retinal layers analyzed in this study. It seems that GCIPL was highly associated with visual function in TON. Therefore, evaluating GCIPL damage in TON eyes compared with contralateral normal eyes may be useful to assess visual function.
The following limitations were encountered in this study. First, this was a single-center study and the sample size was relatively small. Second, longitudinal changes in the thickness of each retinal layer after trauma could not be evaluated. We speculate that post-traumatic fRNFL and GCIPL thicknesses may progress to become abnormally thin because of gradual axon degeneration from post-traumatic autophagy. Therefore, further studies detecting longitudinal changes are necessary. Third, color vision data were collected by well-trained ophthalmology residents as part of routine clinical evaluation using Ishihara test which is not perfectly suitable for a precise diagnosis of acquired color vision abnormalities. Hence, although the color vision data were useful for analysis in this study since they were all recorded in the same way, caution should be exercised while comparing this data with other studies.
Because of the retrospective nature of this study, we could not perform electroretinogram (ERG) to evaluate RGC dysfunction in all patients. We expected that thinning of the GCIPL in TON may be correlated with the amplitude decrease in ERG. Moreover, in addition to the parameters including MD and VFI, a more detailed approach that attempts to match retinal thickness in certain locations with retinal light sensitivity in these areas is needed to establish better correlation between structure and function. Finally, there was a potential for some mea-surement errors because each retinal layer thickness was measured manually, not using soft-ware. However, the measurements were done by two masked observers, and good inter-and intra-observer agreement was demonstrated in most areas of measurement.
assess morphological damage and visual function change in patients with early TON. Further studies with large sample sizes are required to verify our results.
Supporting Information
S1 Table. Difference in retinal thickness between unaffected eyes and affected eyes in early traumatic optic neuropathy.
(DOCX)
Author Contributions
Conceived and designed the experiments: JL SO. Performed the experiments: JL KC. Analyzed the data: JL. Contributed reagents/materials/analysis tools: KP SO. Wrote the paper: JL SO. Contributed to review and revise the manuscript: KP. Drafted and revised the manuscript: JL. Reviewed and approved the final version of the manuscript: SO.
References
1. Liu Y, McDowell CM, Zhang Z, Tebow HE, Wordinger RJ, Clark AF. Monitoring retinal morphologic and functional changes in mice following optic nerve crush. Invest Ophthalmol Vis Sci. 2014; 55: 3766–
3774. doi:10.1167/iovs.14-13895PMID:24854856
2. Miki A, Endo T, Morimoto T, Matsushita K, Fujikado T, Nishida K. Retinal nerve fiber layer and ganglion cell complex thicknesses measured with spectral-domain optical coherence tomography in eyes with no light perception due to nonglaucomatous optic neuropathy. Jpn J Ophthalmol. 2015; 59: 230–235. doi:10.1007/s10384-015-0386-0PMID:25963074
3. Yukita M, Machida S, Nishiguchi KM, Tsuda S, Yokoyama Y, Yasuda M, et al. Molecular, anatomical and functional changes in the retinal ganglion cells after optic nerve crush in mice. Doc Ophthalmol. 2015; 130: 149–156. doi:10.1007/s10633-014-9478-2PMID:25560383
4. Munemasa Y, Kitaoka Y. Autophagy in axonal degeneration in glaucomatous optic neuropathy. Prog Retin Eye Res. 2015; 47: 1–18. doi:10.1016/j.preteyeres.2015.03.002PMID:25816798
5. Seibold LK, Mandava N, Kahook MY. Comparison of retinal nerve fiber layer thickness in normal eyes using time-domain and spectral-domain optical coherence tomography. Am J Ophthalmol. 2010; 150: 807–814. doi:10.1016/j.ajo.2010.06.024PMID:20888550
6. Gabriele ML, Wollstein G, Ishikawa H, Xu J, Kim J, Kagemann L, et al. Three dimensional optical coher-ence tomography imaging: advantages and advances. Prog Retin Eye Res. 2010; 29: 556–579. doi:
10.1016/j.preteyeres.2010.05.005PMID:20542136
7. Tan O, Chopra V, Lu AT, Schuman JS, Ishikawa H, Wollstein G, et al. Detection of macular ganglion cell loss in glaucoma by Fourier-domain optical coherence tomography. Ophthalmology. 2009; 116: 2305–2314 e2301–2302. doi:10.1016/j.ophtha.2009.05.025PMID:19744726
8. Rosenberg R, Marill AF, Fenolland JR, El Chehab H, Delbarre M, Marechal M, et al. Evaluation of the new Canon HS-100 SD-OCT: Reproducibility of macular ganglion cell complex (GCC) thickness mea-surement in normal, hypertensive and glaucomatous eyes. J Fr Ophtalmol. 2015; 38: 832–843. doi:10. 1016/j.jfo.2015.03.015PMID:26494495
9. Arintawati P, Sone T, Akita T, Tanaka J, Kiuchi Y. The applicability of ganglion cell complex parameters determined from SD-OCT images to detect glaucomatous eyes. J Glaucoma. 2013; 22: 713–718. doi:
10.1097/IJG.0b013e318259b2e1PMID:22668975
10. Renard JP, Fenolland JR, El Chehab H, Francoz M, Marill AM, Messaoudi R, et al. Analysis of macular ganglion cell complex (GCC) with spectral-domain optical coherence tomography (SD-OCT) in glau-coma. J Fr Ophtalmol. 2013; 36: 299–309. doi:10.1016/j.jfo.2013.01.005PMID:23541535
11. Nakano N, Hangai M, Nakanishi H, Mori S, Nukada M, Kotera Y, et al. Macular ganglion cell layer imag-ing in preperimetric glaucoma with speckle noise-reduced spectral domain optical coherence tomogra-phy. Ophthalmology. 2011; 118: 2414–2426. doi:10.1016/j.ophtha.2011.06.015PMID:21924499
12. Cennamo G, Auriemma RS, Cardone D, Grasso LF, Velotti N, Simeoli C, et al. Evaluation of the retinal nerve fibre layer and ganglion cell complex thickness in pituitary macroadenomas without optic chias-mal compression. Eye (Lond). 2015; 29: 797–802.
13. Munguba GC, Galeb S, Liu Y, Landy DC, Lam D, Camp A, et al. Nerve fiber layer thinning lags retinal ganglion cell density following crush axonopathy. Invest Ophthalmol Vis Sci. 2014; 55: 6505–6513. doi:
14. Rovere G, Nadal-Nicolas FM, Agudo-Barriuso M, Sobrado-Calvo P, Nieto-Lopez L, Nucci C, et al. Comparison of Retinal Nerve Fiber Layer Thinning and Retinal Ganglion Cell Loss After Optic Nerve Transection in Adult Albino Rats. Invest Ophthalmol Vis Sci. 2015; 56: 4487–4498. doi:10.1167/iovs. 15-17145PMID:26193926
15. Levkovitch-Verbin H, Quigley HA, Kerrigan-Baumrind LA, D'Anna SA, Kerrigan D, Pease ME. Optic nerve transection in monkeys may result in secondary degeneration of retinal ganglion cells. Invest Ophthalmol Vis Sci. 2001; 42: 975–982. PMID:11274074
16. Chen T, Ma J, Wang Y, Li D, Zhong Y. Morphological evaluation of the optic nerve and retina in the rat model of non-arteritic anterior ischemic optic neuropathy. Zhonghua Yan Ke Za Zhi. 2015; 51: 592–
596. PMID:26696576
17. Parrilla-Reverter G, Agudo M, Nadal-Nicolas F, Alarcon-Martinez L, Jimenez-Lopez M, Salinas-Navarro M, et al. Time-course of the retinal nerve fibre layer degeneration after complete intra-orbital optic nerve transection or crush: a comparative study. Vision Res. 2009; 49: 2808–2825. doi:10.1016/j. visres.2009.08.020PMID:19715716
18. Miller NR, Walsh FB, Hoyt WF. Walsh and Hoyt's clinical neuro-ophthalmology. 6th ed. Philadelphia: Lippincott Williams & Wilkins; 2005.
19. Boone MI, Massry GG, Frankel RA, Holds JB, Chung SM. Visual outcome in bilateral nonarteritic ante-rior ischemic optic neuropathy. Ophthalmology. 1996; 103: 1223–1228. PMID:8764790
20. Odom JV, Bach M, Brigell M, Holder GE, McCulloch DL, Tormene AP, et al. ISCEV standard for clinical visual evoked potentials (2009 update). Doc Ophthalmol. 2010; 120: 111–119. doi: 10.1007/s10633-009-9195-4PMID:19826847
21. Bengtsson B, Heijl A. A visual field index for calculation of glaucoma rate of progression. Am J Ophthal-mol. 2008; 145: 343–353. PMID:18078852
22. Valeria B, Benjamin MD, Eduardo M, Laura C, Faisal A, Cillino S, et al. Comparison of global visual field indices (MD,VFI), GPA II change and cluster analysis of visual field progression in glaucoma. Investigative Ophthalmology & Visual Science, 2014; 55;5633
23. Gazala M, Arpan C, Saurin G, Reema R, Nitin T. Relationship of a new visual field index, the VFI, with Mean deviation (MD) in 30–2 and 24–2 threshold tests examined by Humphrey field analyzer in POAG patient. Gujarat medical journal, 2014; 69;93–95
24. Park KA, Kim J, Oh SY. Analysis of spectral domain optical coherence tomography measurements in optic neuritis: differences in neuromyelitis optica, multiple sclerosis, isolated optic neuritis and normal healthy controls. Acta Ophthalmol. 2014; 92: e57–65. doi:10.1111/aos.12215PMID:
23889747
25. Cunha LP, Costa-Cunha LV, Malta RF, Monteiro ML. Comparison between retinal nerve fiber layer and macular thickness measured with OCT detecting progressive axonal loss following traumatic optic neu-ropathy. Arq Bras Oftalmol. 2009; 72: 622–625. PMID:20027397
26. Chauhan BC, Stevens KT, Levesque JM, Nuschke AC, Sharpe GP, O'Leary N, et al. Longitudinal in vivo imaging of retinal ganglion cells and retinal thickness changes following optic nerve injury in mice. PLoS One. 2012; 7: e40352. doi:10.1371/journal.pone.0040352PMID:22768284
27. Kanamori A, Nakamura M, Yamada Y, Negi A. Longitudinal study of retinal nerve fiber layer thickness and ganglion cell complex in traumatic optic neuropathy. Arch Ophthalmol. 2012; 130: 1067–1069. doi:
10.1001/archophthalmol.2012.470PMID:22893082
28. Shi W, Wang HZ, Song WX, Yang WL, Li WY, Wang NL. Axonal loss and blood flow disturbances in the natural course of indirect traumatic optic neuropathy. Chin Med J (Engl). 2013; 126: 1292–1297.
29. Quigley HA, Addicks EM. Regional differences in the structure of the lamina cribrosa and their relation to glaucomatous optic nerve damage. Arch Ophthalmol. 1981; 99: 137–143. PMID:7458737
30. Kerrigan-Baumrind LA, Quigley HA, Pease ME, Kerrigan DF, Mitchell RS. Number of ganglion cells in glaucoma eyes compared with threshold visual field tests in the same persons. Invest Ophthalmol Vis Sci. 2000; 41: 741–748. PMID:10711689
31. Wheat JL, Rangaswamy NV, Harwerth RS. Correlating RNFL thickness by OCT with perimetric sensi-tivity in glaucoma patients. J Glaucoma. 2012; 21: 95–101. doi:10.1097/IJG.0b013e31820bcfbePMID:
21336150
32. Shin HY, Park HY, Jung KI, Choi JA, Park CK. Glaucoma diagnostic ability of ganglion cell-inner plexi-form layer thickness differs according to the location of visual field loss. Ophthalmology. 2014; 121: 93–
99. doi:10.1016/j.ophtha.2013.06.041PMID:23962652
34. Le PV, Tan O, Chopra V, Francis BA, Ragab O, Varma R, et al. Regional correlation among ganglion cell complex, nerve fiber layer, and visual field loss in glaucoma. Invest Ophthalmol Vis Sci. 2013; 54: 4287–4295. doi:10.1167/iovs.12-11388PMID:23716631
35. Alasil T, Wang K, Yu F, Field MG, Lee H, Baniasadi N, et al. Correlation of retinal nerve fiber layer thick-ness and visual fields in glaucoma: a broken stick model. Am J Ophthalmol. 2014; 157: 953–959. doi:
10.1016/j.ajo.2014.01.014PMID:24487047
36. Lennartsson F, Nilsson M, Flodmark O, Jacobson L. Damage to the immature optic radiation causes severe reduction of the retinal nerve fiber layer, resulting in predictable visual field defects. Invest Ophthalmol Vis Sci. 2014; 55: 8278–8288. doi:10.1167/iovs.14-14913PMID:25377222
37. Yaqub M. Visual fields interpretation in glaucoma: a focus on static automated perimetry. Community Eye Health. 2012; 25: 1–8.
38. Towle VL, Harter MR. Objective determination of human visual acuity: pattern evoked potentials. Invest Ophthalmol Vis Sci. 1977; 16: 1073–1076. PMID:914482
39. Parisi V, Miglior S, Manni G, Centofanti M, Bucci MG. Clinical ability of pattern electroretinograms and visual evoked potentials in detecting visual dysfunction in ocular hypertension and glaucoma. Ophthal-mology. 2006; 113: 216–228. PMID:16406535