Estimation of genetic parameters for production traits in pig
breeds in Croatia
Smetko, A., Škorput, D., Luković, Z., Mahnet, Ž., Klišanić, V.,
Špehar, M.
Poljoprivreda/Agriculture
ISSN: 1848-8080 (Online)
ISSN: 1330-7142 (Print)
http://dx.doi.org/10.18047/poljo.21.1.sup.34
Poljoprivredni fakultet u Osijeku, Poljoprivredni institut Osijek
INTRODUCTION
Genetic evaluation approaches had huge impact on the efficiency of pork production in the last decades. Since 2005, mixed model methodology known as Best Linear Unbiased Prediction (BLUP, Henderson, 1973) has been used as standard procedure for genetic evaluation (Vincek et al., 2004) of production traits used in Croatian pig breeding programme. This approach predicts the genetic potential of the animal based on its own per-formance and of all phenotyped relatives. Genetic pro-gress can be achieved for traits that are heritable such as growth rate, backfat thickness (BF) (Ferraz et al., 1993), feed efficiency, muscle thickness and hind leg mass (Hermesch et al., 2000) which can be measured directly. Those traits emphasize the performance traits associated with efficient muscle development. The most important of them are minimum backfat and maximum growth rate. Both traits are of economic importance and since they are also highly heritable, they can be improved by selection. Improvement of these traits through breeding will likely be of use in the form of bet-ter feed efficiency, heavier weaning weights and more rapid development of gilts for breeding. The objective of this study was to update genetic parameters for
produc-tion traits: backfat thickness and test time (TT) for field tested pigs in Croatia.
MATERIAL AND METHODS
Data used for the estimation of genetic parameters and breeding value prediction were collected on fam-ily farms by Croatian Agricultural Agency employees. Data were taken from database of Croatian Agricultural Agency. Backfat thickness was measured on alive ani-mals at the end of the test with ultrasound (Renco® ultrasound). Data were edited and records were deleted if: a) test date was unknown, b) herd was unknown and c) animals were from different breed than those included in the analysis. Additionally, animals were excluded from the analysis if they had less than 75 and more than 140 kg and were younger than 120 and older than 360 days at the end of the test. Backfat thickness of ana-lysed animals was limited within the range from 3.5 to 25 mm. The animals were grouped by herd and season and groups having less than 3 animals were excluded. DOI: 10.18047/poljo.21.1.sup.34
ESTIMATION OF GENETIC PARAMETERS FOR PRODUCTION
TRAITS IN PIG BREEDS IN CROATIA
Smetko, a.(1), Škorput, d.(2), luković, Z.(2), Mahnet, Ž.(1), Klišanić, v.(1), Špehar, M.(1)
Original scientific paper
SUMMarY
Genetic parameters for backfat thickness and test time were updated and used in genetic evaluation for field tested pigs in Croatia. data consisted of 9,406 animals with measurements for production traits recorded from 2000 to 2014. The number of animals in pedigree was 10,728. Production traits were modelled using a single trait animal model including the following fixed class effects: breed, sex, classifier, season, and herd. Weight at the end of the test was included as linear regression in the model for backfat. direct additive genetic effect, interaction herd-year-season of testing and common litter effect were included as random effects. variance com-ponents were estimated using reMl method as implemented in the vCe-6 program. The estimated heritabilities were 0.28±0.03 for backfat thickness and 0.12±0.02 for test time. litter effect accounted from 15 to 24% of phenotypic variation, while herd-year-season of testing explained additional 24 and 28% of variability for analysed traits.
Key-words: genetic parameters, pig, breeding, heritability, genetic trend
147
A. Smetko et al.: ESTIMATION OF GENETIC PARAMETERS FOR PRODUCTION TRAITS ...
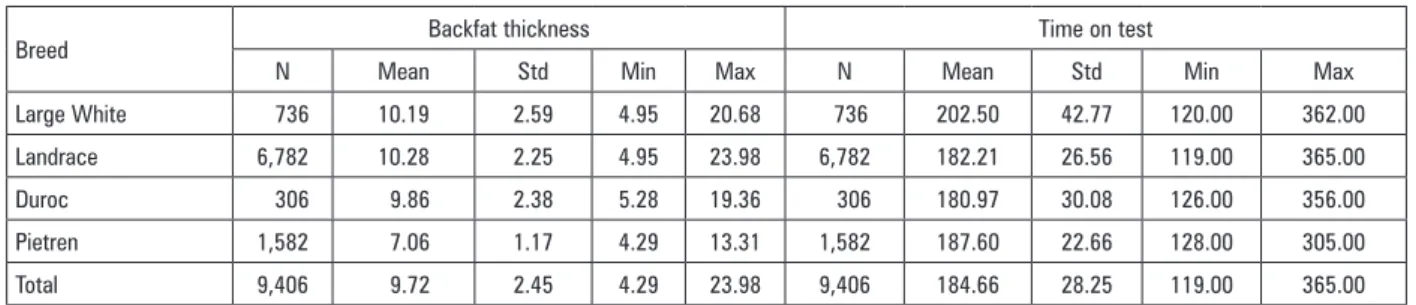
Average values for BF and TT are shown in Table 1. As expected, Pietrain has lowest BF (7.06 mm), while Landrace had the greatest value for BF (10.28 mm). Breed with the shortest TT was Duroc (180.97 days) and breed with the longest duration of the test was Large White. Correction was made for TT where weight at the end of the test was set to the 105 kg representing the
average weight of the tested gilts in Croatia. Correction was made in a way that average weight of 105 kg is multiplied with number of days in the test for an animal divided with real weight of the animal. After data editing out of total number of data (15,296) for production traits (BF, TT) 9,406 records were used in further analysis.
Table 1. Average backfat thickness and testing age for analysed breeds
Breed Backfat thickness Time on test
N Mean Std Min Max N Mean Std Min Max
Large White 736 10.19 2.59 4.95 20.68 736 202.50 42.77 120.00 362.00
Landrace 6,782 10.28 2.25 4.95 23.98 6,782 182.21 26.56 119.00 365.00
Duroc 306 9.86 2.38 5.28 19.36 306 180.97 30.08 126.00 356.00
Pietren 1,582 7.06 1.17 4.29 13.31 1,582 187.60 22.66 128.00 305.00
Total 9,406 9.72 2.45 4.29 23.98 9,406 184.66 28.25 119.00 365.00
All animals with records and their relatives tracing back for three generations were included in the pedigree file (Table 2). The total number of animals involved in the pedigree was 10,728 and it was tracking back three generations. There were 87.7% animals with production records (generation 0) in the pedigree. Sires and dams, parents of those animals, represented additional 9.6%
of the animals. Proportion of animals in the second and third generation decreased (2.5% and 0.2%) due to poor structure at the beginning of data collection. Animals were descendants of 1,030 parents in total. Time span in which data were collected relates to the animals born from beginning of 2,000 and animals tested until end of 2014.
Table 2. Structure of the pedigree
Item
Number of generations in pedigree
All
0 1 2 3
n % n % n % N % n %
Male 3,566 33.2 374 3.5 171 1.6 17 0.2 4,128 38.5
Female 5,840 54.4 656 6.1 97 0.9 7 0.1 6,600 61.5
All 9,406 87.7 1030 9.6 268 2.5 24 0.2 10,728 100.0
Choice of the effects in the fixed part of the model was made by the effect significance, as well as coefficient of determination (R2) and degrees of freedom for the model. Random part of the model included effects frequently used in the model according to literature review. It consisted of genetic part referred to direct additive genetic effect and environmental effects. The environmental effects
were further partitioned to a permanent environmental effect within the parity and contemporary group.
The model [1] that best fit BF and TT [2] was determined with fixed effects as follows: breed (Bi), sex (Sj), classifier (Ck), season (Ml), and herd effect (Om). Additionally, weight at end of test (xijklmno), nested with-in breed was with-included with-in the model [1] as a covariable.
[1]
[2]
Random part was same in both models. It con-sisted of contemporary group defined as interaction of herd-year-season of testing (hn), common litter environ-mental effect (li) referred to permanent environmental effect within the parity, direct additive genetic effect (aio) and residual error (eijklmno).
RESULTS AND DISSCUSION
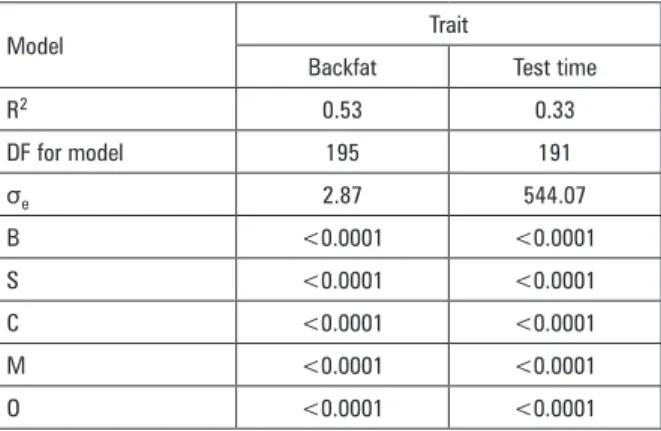
The proportion of variation accounted for fixed part of the model for BF was 53.21%. On the other hand, fixed part of the model for TT explained lower proportion of variation (33.25%). All listed effects in the model were significant (p<0.0001) as shown in Table 3.
Table 3. Coefficients of determination, degrees of freedom (DF), standard deviation for residual (σe),
p-values of fixed effects
Model Trait
Backfat Test time
R2 0.53 0.33
DF for model 195 191
σe 2.87 544.07
B <0.0001 <0.0001
S <0.0001 <0.0001
C <0.0001 <0.0001
M <0.0001 <0.0001
O <0.0001 <0.0001
R2- coefficient of determination, DF for model- degrees of freedom for model, σe- standard deviation for residual, B - breed effect; S - sex effect; C - classifier effect; M – season effect; O - herd effect
Estimated genetic parameters for BF and TT are shown in Table 4. Additive genetic variance for BF and TT was in the range of estimations observed for BF and TT in analysis of family farms (Škorput, 2013). Additive genetic variance for BF was higher compared to estimates of Malovrh and Kovač (1999) for German Landrace (0.23 mm2) and Large White (0.25 mm2), but lower than Swedish Landrace (0.38 mm2). Estimated heritability was 28% for BF and 12% for TT. Vincek et al. (2004) reported similar heritability estimates being in the interval from 0.02 to 0.29 for BF and from 0.04 and 0.20 for TT based on data from three Croatian farms for Swedish and Dutch Landrace, Large White, Pietrain and their crosses. Malovrh and Kovač (1999) obtained herit-ability from 0.11 to 0.35 for BF of gilts and from 0.23 to 0.40 for boars estimated for Swedish landrace, Large White, and German Landrace on big farms in Slovenia. However, heritability in this paper was lower in compari-son to estimated heritabilities by Škorput (2013), where the same breeds were used. Time span of analysed animals in Škorput (2013) was from 1998 to 2008.
Table 4. Covariance component estimates ±standard error for backfat thickness and test time at family farms
Trait Va Vl Vhys Ve h2 l2 hys2 e2
BF* 0.80±0.08 0.69±0.04 0.69±0.06 0.97±0.05 0.28±0.03 0.15±0.01 0.23±0.02 0.33±0.02
TT 56.58±10.53 134.64±7.48 134.64±8.00 172.93±7.43 0.12±0.02 0.24±0.01 0.28±0.01 0.36±0.02
BF*- backfat thickness; TT- time on test; Va- additive genetic variance ; Vl– variance of common litter environment; Vhys- variance of herd-year-season interaction; Ve- residual variance, h2- heritability; l2- ratio for common litter, hys2- ratio for herd-year-season interaction, e2- ratio for residual
Heritability estimated by Imboonta et al. (2007) for BF and TT was higher than in our analysis (0.61±0.02 BF and 0.38±0.02 for average daily gain which can be compared to TT). For the analysis they used Landrace sows from Thailand coming from one nucleus herd. This can explain better connectivity of their data. Similar to previously compared studies, Bidanel et al. (1994) esti-mated higher heritability for TT and BF in Large White and French Landrace populations (0.25, 0.45 and 0.23 and 0.55) compared to the current study. Generally, heritability estimated on field test data are lower in comparison to data collected in stations (Peškovičová et al., 2002). Selection practices have shortened TT and together with this improved the average daily gain, BF thickness and other traits of pig carcass (Imboonta et al. 2007). However, correlation between selection for pro-duction traits and decreased reproductive performance has been reported. Production traits are necessary to combine in selection programme.
Interaction herd-year-season of testing explained 23% of phenotypic variance in BF and higher proportion (28%) for TT. Common litter effect explained 15% of total
phenotypic variance for BF, whereas for TT common litter variance obtained 24% of phenotypic variance. Malovrh and Kovač (1999) reported common litter vari-ance for BF to be lower in smaller breeds for Slovenian Swedish Landrace, Large White, and German Landrace. In their case, common litter variance explained 14% of phenotypic variance, being similar to our findings. On the contrary, common litter variance explained higher proportion of phenotypic variance (23% for BF) in the study of Škorput (2013). Similar proportion of common litter variance (26%) was obtained for TT.
149
A. Smetko et al.: ESTIMATION OF GENETIC PARAMETERS FOR PRODUCTION TRAITS ...
Figure1. Genetic trends for backfat and time on test with number of animals per year
CONCLUSION
Data structure affected the estimation of genetic parameters and prediction of breeding values. Heritability estimates for BF (0.28) and for TT (0.12) were lower compared to literature estimates for those traits due to specific data structure and low connectivity between the farms. Future perspective for genetic evaluation of pigs included in National pig breeding programme is to include additional production trait measures and esti-mate breeding values for fertility traits.
LITERATURE
1. Bidanel, J.P., Ducos, A., Guéblez, R., Labroue, F. (1994): Genetic parameters of backfat thickness, age at 100 kg and ultimate pH in on-farm tested French Landrace and Large White pigs. Livestock Production Science, 40(3): 291-301.
2. Ferraz, J.B.S., Johanson, R.K. (1993): Animal model esti-mation of genetic parameters and response to selection for litter size and weight, growth and backfat in closed seedstock populations of Large White and Landrace swine. J. Anim. Sci., 71: 850-858.
3. Henderson, C.R. (1973): Sire evaluation and genet-ic trends. Journal of Animal Science, Vol. 1973 No. Symposium, p. 10-41.
doi: http://dx.doi.org/1973.1973Symposium10x 4. Hermesch S., Luxford B.G., Graser, H.U. (2000): Genetic
parameters for lean meat yield, meat quality, reprodu-ction and feed efficiency traits for Australian pigs: 2. Genetic relationships between production, carcase and meat quality traits. Livest Prod Sci., 65: 249-259.
doi: http://dx.doi.org/10.1016/S0301-6226(00)00152-4 5. Imboonta N., Rydhmer L., Tumwasorn, S. (2007): Genetic
parameters for reproduction and production traits of Landrace sows in Thailand. J. Anim. Sci., 85: 53-59. doi: http://dx.doi.org/10.1016/j.livsci.2006.12.001 6. Kovač, M., Groneveld, E. (2002): VCE-5 User’s Guide
and Reference Manual Version 5.1. Institute of Animal Science and Animal Husbandry, FAL, D-31535 Neustadt, Germany.
7. Malovrh, Š., Kovač, M. (1999): Genetic correlati-ons between test station and on-farm performance for backfat thickness and daily gain. Acta Agraria Kaposvariensis, 3(2): 145-154.
8. Peškovičová, D., Wolf, J., Groeneveld, E., Wolfová, M. (2002): Simultaneous estimation of the covariance structure of traits from field test, station test and litter recording in pigs. Livest. Proc Sci., 77: 155-165. doi: http://dx.doi.org/10.1016/S0301-6226(02)00064-7 9. SAS Institute Inc. 2001. The SAS System for Windows,
Release 9.3. SAS Institute Inc., Cary, North Carolina. 10. Škorput, D. (2013): Evaluation of genetic parameters for
productive and reproductive traits in pig population in Republic of Croatia. PhD thesis, Faculty of Agronomy, University of Zagreb, 96 pages.
11. Vincek, D., Gorjanc, G., Malovrh, Š., Luković, Z., Kapš, M., Kovač, M. (2004): Odabir i stupnjevanje nazimica koristeći BLUP. Stočarstvo, 58(3): 179-190.