* Corresponding author:
E-mail: [email protected]
Received: January 24, 2018
Approved: September 4, 2018
How to cite: Kaufmann DS, Bertol I, Santos MAN, Bagio B, Mecabô Júnior J, Borg H. Impacts of pig slurry applied to two different soils on nutrient transport by runoff. Rev Bras Cienc Solo. 2019;43:e0180011.
https://doi.org/10.1590/18069657rbcs20180011
Copyright: This is an open-access article distributed under the terms of the Creative Commons Attribution License, which permits unrestricted use, distribution, and reproduction in any medium, provided that the original author and source are credited.
Impacts of Pig Slurry Applied to Two
Different Soils on Nutrient Transport
by Runoff
Danieli Schneiders Kaufmann(1)
, Ildegardis Bertol(1)*
, Maria Aparecida do Nascimento
dos Santos(1)
, Barbara Bagio(1)
, José Mecabô Júnior(1)
and Heinz Borg(2)
(1) Universidade do Estado de Santa Catarina, Centro de Ciências Agroveterinárias, Programa de
Pós-Graduação em Ciência do Solo, Lages, Santa Catarina, Brasil.
(2) Faculty of Natural Sciences III, Martin-Luther-Universität Halle-Wittenberg, Halle (Saale), Saxony-Anhalt, Germany.
ABSTRACT: Runoff in agricultural areas with intensive application of pig slurry can transport significant amounts of nutrients. This study evaluates the effects of different pig slurry (PS) application rates (0, 50, 100, and 200 m3 ha-1) on nutrient loss through runoff during soybean cultivation under no-tillage. It was conducted at two sites in southern Brazil, one on an Alfisol (27° 43’ south and 50° 3’ west) and one on an Inceptisol (27° 47’ south and 50° 18’ west). The PS was applied to the soil once at the beginning
of the soybean cycle. Each plot was 11 m long in the direction of the slope and 3.5 m
wide. To induce runoff, artificial rainfall was applied in four different tests (T1, T2, T3, T4),
with an intensity of 65 mm h-1 for 90 minutes. The first test was performed one day after
PS application, while the other tests were performed throughout the soybean cycle. During each test, runoff samples were collected at 10-min intervals after the beginning of runoff. The runoff amount and the NO3
-, NH 4
+
, P, and K+
concentrations in the runoff were measured. In T1, nutrient transport from the Alfisol and the Inceptisol increased with increasing PS doses. In some cases, this effect was still noticeable in T2 and T3, but not in the last test (T4). The transported amounts of NO3-, NH
4
+, P, and K+ decreased as the period between PS application and simulated rainfall increased. Regardless of the soil and the treatment, NO3
was transported in the greatest quantities, followed by K+, NH4
+, and P.
Keywords: organic fertilization, artificial rainfall, nutrient loss.
INTRODUCTION
In the south of Brazil, pig farming, mostly under a confinement regime, is an important economic activity. The intense production and the generation of a large volume of residues in small family farms, sometimes concentrated in a limited area, have led to significant environmental problems (Basso et al., 2017). In the state of Santa Catarina,
47,000 m3 day-1 of pig slurry (PS) are produced (ABCS, 2014).
Pig slurry is applied to the soil as an organic fertilizer, replacing or supplementing the recommended mineral fertilization (Carvalhal et al., 2014). Up to the first half of 2014, the maximum permitted amount of organic fertilizers applied to crops was 50 m³ ha-1
yr-1,
but in the second half of 2014, Normative Instruction No. 11 was modified and, from
then, the application of organic fertilizers to the soil has been following the agronomic
recommendations as outlined in the Fertilization and Liming Manual (CQFS-RS/SC, 2004),
with application rates determined according to soil analysis, the nutritional needs of the
crop to be fertilized, nutrient contents, and the agronomic efficiency index of nutrients for each type of organic fertilizer (Fatma, 2014). However, due to the difficulties in the supervision by the environmental agency and the lack of incentives to farmers, the rules for the application of organic fertilizers are rarely followed, with significant risks for soil,
water, and air quality.
Water contamination due to the application of PS to a soil can be caused by the transport of nutrients such as nitrogen (N), phosphorus (P), potassium (K), copper (Cu), zinc (Zn), and others contained in PS by runoff and drainage from the soil profile (Dal
Bosco, 2007). The nutrients can either be adsorbed to the solid particles (mineral and
organic) in the soil or dissolved in the runoff water (Barrows and Kilmer, 1963). Their concentrations in the runoff water varies with rainfall (Barrows and Kilmer, 1963), soil type, and concentration in the soil (Seganfredo et al., 1997; Silva et al., 2012),
but also with the agricultural management practices employed, such as the cropping system, the soil preparation method, and the frequency and form of the application
of fertilizers and correctives (Barrows and Kilmer, 1963; Seganfredo et al., 1997;
Guadagnin et al., 2005; Gilles et al., 2009). Nutrients from organic fertilizers such as
PS are more easily transported by runoff due to their lower density when compared to mineral fertilizers (Barrows and Kilmer, 1963). Moreover, the superficial application of PS or fertilizers without incorporation into the soil also facilitates nutrient transport by runoff (Cassol et al., 2002). Among the nutrients present in PS, N, P, and K usually occur in higher levels; of these, N and P pose an imminent risk of water pollution
(Basso et al., 2005; Assmann et al., 2007).
Nitrate (NO3
-) and ammonium (NH4 +
) are the two inorganic forms of N used by plants.
While nitrate is mainly maintained in solution and most readily available for plant absorption, ammonium ions are mostly kept in the cation exchange complexes in the soil (Schoonover and Crim, 2015).
Since N deficiencies in crops are widespread and can lead to low crop yields, N fertilizers are often applied excessively. As a result, substantial losses of N may occur through ammonia volatilization or, since it is extremely mobile, nitrate leaching from the soil profile. In addition, excess N in a soil can lead to incomplete denitrification, resulting in the release of nitrous oxide into the atmosphere (Basso, 2003; Schoonover and
Crim, 2015).
large amounts of N from the soil. Moreover, this makes the addition of nitrogen fertilizer
in corn crops unnecessary.
The excess of NO3- in drinking water is a concern for several reasons. Most importantly, it can cause the blue-baby syndrome in newborns (Boink and Speijers, 2001), but in addition, when NO3- is converted into nitrosamines and nitrosamides in the human body,
it becomes a potential carcinogen. It can also lead to poor congenital formations, mainly
in the central nervous system (Ward et al., 2005).
In addition to being an excellent source of N for plants, PS is a significant source of P and K (Assmann et al., 2007). Most of the natural P in a soil is derived from mineral weathering and the decomposition of organic matter. However, the contents of plant-available P are generally very low in soils, since most of the P is insoluble (Schoonover and Crim, 2015). Unlike NO3-, which is mobile in the soil profile, P readily binds to soil minerals and is therefore often transported with sediments in runoff (Klein and Agne, 2012). However, transport of P through the soil profile into groundwater can also occur when large amounts are applied to the soil surface several times in succession
(Basso et al., 2005).
Potassium, considered a mobile element, is susceptible to leaching; however, its dynamics is determined, in part, by the exchange of ions and the adsorption by clays (Oren et al., 2004). Environmentally, K is not considered a potential contaminant, and there are no regulations that indicate a threshold value of K in water bodies.
The quality standard of water bodies in Brazil is established by Resolution Conama
357 (Conama, 2005). For freshwater bodies of class 1, class 2, and class 3, Conama 357 states a limit of 10 mg L-1 for NO3
-. For total ammonium nitrogen, the threshold,
besides varying with the class and type of flow (lentic, intermediate, or lotic), depends on the pH of the water. For P, the limit varies according to the class and flow type of the water body. The most restrictive values are 3.7 mg L-1
for total ammonium nitrogen and 0.02 mg L-1 for P.
An excess of N and P in water triggers the widely investigated eutrophication phenomenon
(Smith and Schindler, 2009; Bachmann et al., 2013; Fontana et al., 2014; Smith et al.,
2014; Andrietti et al., 2016; Grilo et al., 2016; Wiegand et al., 2016).
In the literature, there are numerous studies on the effect of PS application on nutrient losses from a field. Studies focused on comparisons between the application of PS, which
is an organic fertilizer, and mineral fertilizer (Bertol et al., 2005, 2010; Santos et al.,
2015; Tomer et al., 2016), evaluations of different rates and amounts of PS applied
(Ceretta et al., 2005, 2010; Mecabo Júnior et al., 2014; Sacomori et al., 2016), comparisons
of PS application with different organic sources, such as aviary manure (Oliveira et al., 2015) or bovine manure (Lourenzi et al., 2014), evaluations of different time intervals between the application of PS and the occurrence of the first rain event (Smith et al., 2007; Flynn et al., 2013), comparisons of the PS application method, with or without incorporation into the soil (Allen and Mallarino, 2008), or the application of PS in different management systems (Pinheiro et al., 2016).
However, there is a lack of studies evaluating the loss of nutrients after the application of PS as a crop develops; in addition, studies carried out in large field plots, such as
those used in the present study (38.5 m2
), are scarce. Most studies have been performed
using plots of only 1 m2 and are therefore not very representative. Hence, the objective of this study was to evaluate the effects of different PS application rates on nutrient loss through runoff during the development of a soybean crop under no-tillage on large plots considered to be representative of field conditions. To induce runoff, the
MATERIALS AND METHODS
Site description
The study was conducted during the spring/summer 2013/2014 in two experimental
areas, one near the city of São José do Cerrito and the other near the city of Lages, both located in the state of Santa Catarina, Brazil. The coordinates of the São José do
Cerrito site are 27° 43’ south and 50° 31’ west, at an approximate elevation of 800 m.
The soil is a Nitossolo Bruno aluminoférrico húmico (Santos et al., 2013), an Alfisol (Soil
Survey Staff, 2014), with 280 g kg-1
of sand, 100 g kg-1
of silt, and 620 g kg-1 of clay (Barbosa et al., 2012) and with a clayey texture (USDA, 2017). The experimental area of Lages is located at 27° 47’ south and 50° 18’ west at an approximate elevation of 900
m. The soil is a Cambissolo Húmico alumínico léptico (Santos et al., 2013), an Inceptisol
(Soil Survey Staff, 2014), with 196 g kg-1
of sand, 412 g kg-1
of silt, and 392 g kg-1
of clay
(Ramos et al., 2014) and with a silty clay loam texture (USDA, 2017).
According to the classification of Köppen system, the climate in both areas is of type
Cfb: subtropical, humid, rainy, with fresh summers. Mean annual rainfall ranges between 1,450 to 1,650 mm (Inmet, 1992).
In each site, eight plots were constructed; each plot was 11 m long and 3.5 m wide, with a total area of 38.5 m2, as recommended by Embrapa (1975). Thus, the
useful area at each site was 308 m2. The longest side of each plot was arranged in
the direction of the slope of the terrain. The mean slope of the terrain in Nitossolo
(Alfisol) and Cambissolo (Inceptisol) was 0.140 and 0.135 mm-1, respectively. To hydraulically isolate the sides and the upper ends of each plot, galvanized metal
sheets with a height of 0.2 m were used, which were buried in the soil at a depth of 0.1 m. In addition, in each plot, at the lower end, a collection system was installed
to concentrate the runoff. This system was composed of a galvanized metal trough coupled to a 6-m long PVC pipe.
Treatments and experimental design
The experimental design was completely randomized, and four treatments with two replicates were evaluated at each site. Therefore, each site had eight plots, and each plot covered an area of 38.5 m2. The treatments consisted of four amounts of PS
(0, 50, 100, and 200 m3 ha-1 yr-1), applied to the soil surface in a soybean crop (Glycine
max). The amounts were based on Fatma’s Normative Instruction No. 11 (Fatma, 2000),
which, at the time our experiments were initiated (2013), established 50 m3 ha-1 yr-1 as the maximum rate of PS which could be applied to crops. Our intention was to test this rate, as well as double and quadruple rates, because the majority of farmers did not
respect this 50 m3 ha-1 yr-1 limit.
The work at São José do Cerrito (Nitossolo - Alfisol) started at the end of the autumn/winter
2013 cropping season, after research conducted by Mecabo Júnior et al. (2014) on a turnip crop (Raphanus raphanistrum). At the end of its growth, the turnip crop was cut
and left on the soil to serve as mulch. Soybeans were sown as the follow-up crop. The preparation of the experimental area at Lages (Cambissolo - Inceptisol) started at
the end of the autumn/winter harvest of 2012, after an experiment conducted by Ramos et al. (2014) had ended. From this moment on, the soil did not experience any type of management. As a result, spontaneous plant development occurred, predominantly Papuan grass (Brachiaria plantaginea). In April 2013, this cover was cut and removed
from the plots. Afterwards, all plots were plowed twice with three discs on different
days, once in the direction of the slope and once against the direction of the slope.
their growth cycle, they were cut and left on the ground to serve as mulch. Afterwards,
soybeans were sown.
In both experimental areas, the soybeans (Glycine max, cultivar Brasmax Força RR)
were sown in November 2013 with a manual planter. The line spacing was 0.5 m, with seven lines per plot. During the soybean cycle, herbicide, insecticide, and fungicide were applied. On the Nitossolo - Alfisol, there was turnip residue, while on the Cambissolo -
Inceptisol, there was black oat residue on the soil surface.
Pig slurry application
Pig slurry was applied to the soil surface on each plot once, soon after soybean germination and one day before the first simulated rainfall test. The PS was applied manually with the aid of watering cans and consisted of a mixture of feces, urine, water, and other residues from cleaning the pig facilities. Prior to use, it was stored in stabilization ponds. Prior to this experiment, previous crops on the two experimental sites had already received applications of PS at the same rates used in this work. That is, the experiment was already outlined, and the same parcel that received 50 m3 ha-1 yr-1
at the first time received the same rate at the subsequent applications. This logic was also repeated in the other plots, which received 0, 100, and 200 m3 ha-1 yr-1
of PS for both sites. On Nitossolo,
the PS had already been applied once on the black oats, once on the corn, and once on
the forage turnip, while on the Cambissolo, the PS had already been applied once on the
black oat cultivation. Thus, with the application of PS on soybean, the Nitossolo received
PS four times and the Cambissolo two times.
Simulated rain tests and rain simulators
In each treatment, four artificial rainfall events were applied, each at a constant rate
of 65 mm h-1 and for a duration of 90 minutes. The intensity of 65 mm h-1 follows the recommendations by Wischmeier and Smith (1978).
On both soils (Nitossolo and Cambissolo), the first rainfall test (T1) was performed one
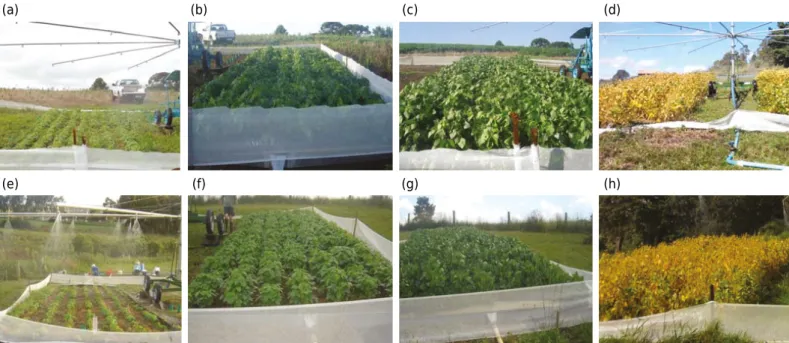
day after the application of PS, and the subsequent rainfall tests were performed 20, 40, and 110 days after PS application (T2, T3, and T4, respectively). The soybean crop at the time of each rainfall test is shown in figure 1.
Figure 1. Pictures of the soybean crop at the time of the four rainfall applications on the Nitossolo - Alfisol and the Cambissolo - Inceptisol. Nitossolo: a = T1, b = T2, c = T3, and d = T4; Cambissolo: e = T1, f = T2, g = T3, and h = T4.
(a) (b) (c) (d)
Between each simulated rainfall test, natural rainfall events occurred. Ten days before
the T1 test, 42 mm of natural rain precipitated; between tests T1 and T2, 72 mm of natural rain precipitated; between T2 and T3, 125 mm; and between T3 and T4, 345 mm of natural rainfall occurred.
The rains were applied with rainfall simulators with rotating arms. On the Nitossolo, a
Swanson-type simulator was used, in which the arms are driven by an engine (Swanson, 1965). A buoyancy-type simulator, developed by Bertol et al. (2012), where the movement of the arms occurs due to the water pressure, was used in the experiment conducted on the Cambissolo.
Both simulators have 10 arms, with each arm being 7.5 m long and with three sprinklers (type S.S.CO. VEEJET 80/100) mounted on it (Meyer and McCune, 1958). The sprinklers were installed at 2.5 m above ground level and simultaneously wetted the area of two plots. In the experiment on the Nitossolo, the water was pumped from a nearby river,
while in the experiment on the Cambissolo, water was obtained from a lake.
The parameters NO3-, NH 4
+, P, K+, and pH were determined in the waters used in the simulated rainfall events, with the following results: NO3- = 0.030 mg L-1; NH4+ = <0.001 mg L-1; P = <0.001 mg L-1
; K+ = 0.034 mg L-1 in the river water and NO3
= 0.014 mg L-1; NH4
+
= <0.001 mg L-1; P = <0.001 mg L-1; K+ = 0.042 mg L-1 in the lake water. The pH
was 6.9 for the river and 6.6 for the lake water. Sampling and analysis of the runoff water
During the simulated rainfall, the flow was measured at intervals of 10 minutes. For this, a graduated bucket was used to measure the volume and a stopwatch to mark the time, and the runoff rate was calculated accordingly (Cogo, 1981). In addition, subsamples were collected in 0.25-L vessels for the determination of nitrate (NO3-), ammonium (NH
4 +), phosphorus (P), and potassium ions (K+).
Immediately after collection, the samples for the nutrient analyses were placed in an icebox, transported to the laboratory, and stored at temperatures between -1 and -4 °C until the analyses. The samples where then thawed and directly analyzed for NO3
-, NH4 +
, and K+,
using an ion exchange chromatograph (Dionex, model ICS-90) and following the standards outlined in the Usepa Method 300.0 (Pfaff, 1993) and the Usepa Method 300.1 (Hautman and Munch, 1997). To determine P, the method of Murphy and Riley (1962) was used. After thawing, the samples were filtered through a 0.45-μm cellulose ester membrane and then analyzed with a molecular absorption spectrophotometer (Model Spekol, Analytik Jena). According to these procedures, the species of P analyzed was dissolved reactive phosphorus.
Analysis of the PS
In the PS, the same nutrients were analyzed as in the runoff water (NO3-, NH 4
+, P, and
K+), plus pH and dry matter content (DM). The pH was determined with a potentiometer, while DM was evaluated by weighing the samples and drying them in an oven at 105 °C
until constant weight.
For the determination of the nutrients in the PS, the solid and liquid phases were separated. The liquid phase was then analyzed via ion exchange chromatography, while for the solid phase, it was first necessary to perform a digestion and extraction process for the
desired cations and anions. For the cations, digestion followed the Usepa 3051A method
(Usepa, 2007), while for the extraction of the anions, the methodology elaborated by Stanisic et al. (2011) was adopted. The characteristics of the PS are presented in table 1.
Data analysis
The mean concentration and the mean of the total mass of the nutrients were weighted
weighted in relation to the following runoff volumes: 34, 8, 3, and 19 mm, respectively,
for T1, T2, T3, and T4. For the Cambissolo, the flow volumes adopted for the weighting
were 34, 18, 5, and 11 mm, respectively, for T1, T2, T3, and T4. The data for total nutrient mass in the runoff were subjected to analysis of variance, and the means, when different between treatments, were compared with Tukey’s test for 5 % significance, using the software package ASSISTAT 7.7 (Silva and Azevedo, 2016).
RESULTS AND DISCUSSION
The nutrient concentrations in the runoff from the Nitossolo and Cambissolo plots after
simulated rainfall are displayed in figure 2. The total nutrient mass in the runoff is shown
in table 2.
During the first rainfall test (T1) on the Nitossolo (Figure 2), the concentrations of all
nutrients in the runoff from the treatments which had received PS were above those of the treatment which had not received PS. In general, in the second rainfall test (T2), the
nutrient concentrations in all treatments became similar, and after the third (T3) and fourth
test (T4), it was no longer possible to perceive a difference in nutrient concentrations in the runoff due to the different rates of PS applied. Similarly, in the Cambissolo treatments,
the nutrient concentrations in the runoff from T1 were also higher in the treatments which had received PS than in those without PS (Figure 2). This effect was still visible in T2, but the different amounts of PS applied practically no longer affected the nutrient concentrations in the runoff from T3 and T4.
For both Nitossolo and Cambissolo, T1 showed a clear difference in nutrient concentrations
in the runoff between the treatments which had received PS and that which had not. Also, the concentrations generally increased with the amount of PS applied. In the subsequent
rainfall tests (T2, T3, and T4) the concentrations began to decrease and equalize, and
the different PS application rates had no impacts because a part of the nutrients applied by the PS was absorbed by the crop and the other part was lost during the events of natural rainfall and simulated rainfall. This behavior is also verified by table 2, which shows the total nutrient mass transported by the runoff in each treatment during the
four simulated rainfall tests.
Both the mean concentration (Figure 2) and the total mass (Table 2) of all nutrients in the
runoff from all treatments of both soils were higher in T1, with a tendency to decrease in
the subsequent tests (T2 and T3) to increase in the last test (T4). The increase in mean concentration and total mass in the last test (T4) occurred for practically all nutrients in
almost all treatments. This can be explained by the decomposition of the oat and turnip residue from the previous cultivation and, mainly, by the decomposition of soybean leaves from the current crop. Almost certainly, the mineralization of organic matter due
to the decomposition of this material contributed to this increase in both soils. A similar
Table 1. Characterization of the pig slurry (PS) applied to the Nitossolo and the Cambissolo
Property Nitossolo - Alfisol Cambissolo - Inceptisol
pH 6.40 7.00
DM (%) 0.35 0.38
NO3
(mg L-1
) 14,871 11,912
NH4 +
(mg L-1) 21 32
P (mg L-1
) 1,345 5,466
K+
(mg L-1
) 18,617 26,206
0 2 4 6 8 10 12
T1 T2 T3 T4 T1 T2 T3 T4
0.0 0.2 0.4 0.6 0.8 1.0 1.2 0 1 2 3 4 5 6 7 8
Cambissolo – Inceptisol
0 10 20 30 40 50 60 70
Nitossolo – Alfisol
K
+ (mg L -1 )P
(mg L
-1 )N H4 + (mg L -1 )N O3 - (mg L
-1 )
PS 0 PS 50 PS 100 PS 200 Limit
Figure 2. Influences of pig slurry (PS) application rate (0, 50, 100, and 200 m3
ha-1) on the mean concentrations of NO
3-, NH4+, P, and
K+
in runoff water from four simulated rainfall tests (T1, T2, T3, and T4) carried out during soybean cultivation on a Nitossolo and a
Table 2. Influence of pig slurry (PS) application rates (0, 50, 100, and 200 m3
ha-1
) on the means of the total mass ± standard
deviation of NO3
-, NH4 +
, P, and K+
in runoff water from four simulated rainfall tests (T1, T2, T3, and T4) carried out during soybean cultivation on a Nitossolo - Alfisol and a Cambissolo -Inceptisol. In addition, for each nutrient, we evaluated the total mass applied
via PS and carried by the runoff, as well as the percentage loss in relation to the amount applied (%)
Treatment Total applied T1 T2 T3 T4 Total carried %
Nitossolo - Alfisol NO3- (kg ha-1)
PS 0 0.00 0.82 ± 0.15 a(1)
0.13 ± 0.03 a 0.12 ± 0.04 a 2.86 ± 0.27 a 3.93 0.0
PS 50 2.76 3.15 ± 2.36 a 0.30 ± 0.05 a 0.12 ± 0.02 a 2.53 ± 0.28 a 6.10 100.0
PS 100 5.52 4.78 ± 1.12 a 0.45 ± 0.31 a 0.15 ± 0.01 a 2.92 ± 0.37 a 8.29 100.0
PS 200 11.04 7.70 ± 7.48 a 0.31 ± 0.14 a 0.13 ± 0.06 a 2.86 ± 0.08 a 11.01 99.7 NH4
+ (kg ha-1
)
PS 0 0.00 0.154 ± 0.033 a 0.012 ± 0.006 a 0.003 ± 0.002 a 0.028 ± 0.012 a 0.20 0.0
PS 50 1.04 0.442 ± 0.015 a 0.009 ± 0.003 a 0.004 ± 0.001 a 0.033 ± 0.015 a 0.49 47.1
PS 100 2.07 0.779 ± 0.367 a 0.047 ± 0.044 a 0.006 ± 0.001 a 0.024 ± 0.009 a 0.86 41.3
PS 200 4.15 0.714 ± 0.209 a 0.015 ± 0.001 a 0.004 ± 0.001 a 0.034 ± 0.027 a 0.77 18.5
P (kg ha-1
)
PS 0 0.00 0.158 ± 0.016 b 0.039 ± 0.013 a 0.012 ± 0.002 a 0.075 ± 0.017 a 0.28 0.0
PS 50 1.70 0.243 ± 0.050 bc 0.045 ± 0.002 a 0.011 ± 0.003 a 0.062 ± 0.016 a 0.36 21.2
PS 100 3.41 0.362 ± 0.002 a 0.064 ± 0.006 a 0.012 ± 0.001 a 0.072 ± 0.029 a 0.51 15.0
PS 200 6.82 0.287 ± 0.024 ac 0.041 ± 0.005 a 0.011 ± 0.003 a 0.061 ± 0.016 a 0.40 5.9 K+
(kg ha-1
)
PS 0 0.00 1.71 ± 0.26 a 0.35 ± 0.19 a 0.06 ± 0.01 a 1.40 ± 0.09 a 3.53 0.0
PS 50 5.21 3.51 ± 0.37 a 0.41 ± 0.16 a 0.10 ± 0.01 a 2.02 ± 0.51 a 6.04 100.0
PS 100 10.41 2.86 ± 0.55 a 0.49 ± 0.00 a 0.07 ± 0.01 a 1.49 ± 0.08 a 4.91 47.1
PS 200 20.83 2.38 ± 0.79 a 0.36 ± 0.03 a 0.07 ± 0.01 a 1.61 ± 0.50 a 4.42 21.2
Cambissolo - Inceptisol
NO3
(kg ha-1
)
PS 0 0.00 6.43 ± 1.74 b 0.90 ± 0.68 a 0.12 ± 0.02 a 0.44 ± 0.16 a 7.89 0.0
PS 50 2.64 9.36 ± 3.88 ab 1.59 ± 0.04 a 0.09 ± 0.06 a 0.71 ± 0.30 a 11.76 100.0
PS 100 5.28 12.21 ± 3.12 ab 4.03 ± 2.26 a 0.11 ± 0.03 a 0.36 ± 0.04 a 16.71 100.0
PS 200 10.55 17.32 ± 0.55 a 11.45 ± 5.53 a 0.14 ± 0.00 a 0.80 ± 0.56 a 29.71 100.0 NH4
+ (kg ha-1
)
PS 0 0.00 0.222 ± 0.089 c 0.019 ± 0.011 a 0.003 ± 0.001 a 0.014 ± 0.013 a 0.26 0.0
PS 50 1.58 0.690 ± 0.039 bc 0.026 ± 0.003 a 0.006 ± 0.001 a 0.011 ± 0.003 a 0.73 46.2
PS 100 3.17 1.416 ± 0.476 b 0.026 ± 0.001 a 0.005 ± 0.002 a 0.023 ± 0.016 a 1.47 46.4
PS 200 6.34 2.498 ± 0.115 a 0.033 ± 0.003 a 0.004 ± 0.004 a 0.013 ± 0.003 a 2.55 40.2
P (kg ha-1
)
PS 0 0.00 0.021 ± 0.012 b 0.007 ± 0.001 a 0.002 ± 0.001 a 0.006 ± 0.001 a 0.04 0.0
PS 50 2.10 0.074 ± 0.009 ab 0.041 ± 0.043 a 0.002 ± 0.000 a 0.009 ± 0.006 a 0.13 6.0
PS 100 4.21 0.140 ± 0.107 ab 0.041 ± 0.040 a 0.003 ± 0.001 a 0.007 ± 0.000 a 0.19 4.5
PS 200 8.41 0.262 ± 0.031 a 0.052 ± 0.004 a 0.008 ± 0.005 a 0.013 ± 0.006 a 0.34 4.0 K+ (kg ha-1
)
PS 0 0.00 2.16 ± 0.53 a 0.42 ± 0.02 a 0.08 ± 0.04 a 0.42 ± 0.02 a 3.08 0.0
PS 50 9.29 2.87 ± 0.69 a 0.71 ± 0.11 a 0.07 ± 0.03 a 0.48 ± 0.06 a 4.13 44.5
PS 100 18.58 3.71 ± 1.18 a 0.60 ± 0.26 a 0.07 ± 0.03 a 0.64 ± 0.13 a 5.02 27.0
PS 200 37.17 3.96 ± 0.14 a 0.74 ± 0.31 a 0.07 ± 0.02 a 0.59 ± 0.22 a 5.36 14.4
(1) Means followed by the same letters do not differ at the 5 % probability level according to the Tukey test. For NO 3
-, NH4
+ , and K+
behavior has been observed by Mecabo Júnior et al. (2014). It is believed that the greatest effect was from the decomposition of soybean leaves, because significant leaf fall was observed only at the end of the crop cycle (Figure 1), whereas oat and turnip residues were already present at sowing. Another factor that may have influenced the increase in the total nutrient mass in the runoff from the T4 test is the fact that the runoff also increased in this test in all treatments from both soils compared to the previous test (T3). Comparing the nutrient concentrations in the runoff from the Nitossolo and Cambissolo
(Figure 2) with resolution 357 of Conama (2005), we observed that in the first rainfall test (T1), the NO3
concentrations in the runoff from the Nitossolo were higher than the limit of 10 mg L-1 in the two treatments which received PS, namely PS 100 and PS 200,
and in all treatments of the T4 test. In the Cambissolo, the NO3
concentrations were
above the limit in all treatments in the T1 test and in two treatments, PS 100 and PS
200, in the T2 test. Note that in the Cambissolo, the limit for NO3- was exceeded even in the treatment with the lowest PS application rate.
Concentrations of NH4
+ in the runoff did not exceed the maximum threshold of 3.7 mg L-1
(the most restrictive Conama value) in any treatment or rainfall test in the Nitossolo
(Figure 2). For the Cambissolo (Figure 2), this limit was exceeded only in the first rainfall test in PS 100 and PS 200. In contrast, the P limit of 0.02 mg L-1 (the most restrictive Conama value) was exceeded in the runoff from all treatments in all simulated rainfall tests for both soils (Figure 2), but this behavior was more pronounced in the Nitossolo. This
can be explained by the initial concentration of P in the soils, which was 26 mg kg-1
for the Nitossolo and 12 mg kg-1 for the Cambissolo, considered very high and medium/high, respectively, according to the Fertilization and Liming Manual (CQFS-RS/SC, 2004). Hence, the application of PS as fertilizer increased the concentrations of the nutrients NO3 -and P in the runoff from the Nitossolo and of the nutrients NO3-, NH
4
+, and P in the runoff
from the Cambissolo (Figure 2) to the point where they exceeded the thresholds stated
by the Brazilian legislation. This may result in the pollution of surface water receiving inflow containing these nutrients. The same consequence of the application of PS on the
concentrations of NH4 +
, NO3
-, P-, Zn2+, and Cu2+
in runoff from a Oxisol (Latossolo) was
observed by Oliveira et al. (2015). In view of this, the application of PS as fertilizer to soils must be constantly monitored to reduce the environmental risks.
Nutrients losses in both soils are linked to chemical-physical properties. While, for example, in the PS 200 treatment (Figure 2), the concentrations of P in the Nitossolo runoff decreased
over time (direction T1 > T4) from 0.84 to 0.31 mg L-1 (2.7 times lower), in the Cambissolo runoff, they decreased from 0.76 to 0.11 mg L-1 (6.9 times lower). This decrease is due to the lower clay content (39 %) of the Cambissolo and the lower Cation Exchange Capacity
- CEC; according to the Manual of Fertilization and Liming (CQFS-RS/SC, 2004), its CEC is considered average. Thus, nutrients are more easily solubilized, while in the Nitossolo, the
interaction of solute with clay, which is present at higher concentrations (62 %), impeding nutrient loss. Figure 2 and table 2 show this effect for other elements, such as for NH4+ and K+. The NO3- does not follow the same general trend presented for the other elements because nitrogen can be lost to the soil by various processes such as adsorption and fixation of ammonia, immobilization by microorganisms, mineralization, nitrification, erosion, volatilization, water losses, leaching (Sengik et al., 2001), absorption by plants (Shen et al., 2003), and adsorption to the sediment (Yano et al., 2000; Søvik and Syversen, 2008). Plants, with the exception of legumes and other groups that fix molecular nitrogen
(N2) in symbiosis with microorganisms, absorb mineral nitrogen mainly in the nitric (NO3-)
and ammonia (NH4 +
) forms, whereas in the soil, the organic form predominates, implying the transformation of organic N to mineral N through heterotrophic microorganisms
(Sèguy et al., 2001). This explains, for example, that in the PS 200 treatment (Figure 2),
the NH4
+ of T1 to T4 showed a decay rate of 2.10 to 0.18 mg L-1 (11.66 times lower) for
The Cambissolo showed a loss pattern higher than that of the Nitossolo, regardless
of the applied dose, except for PS 0, where we observed oscillations caused by the incorporation of nutrients by the leguminous plants. Regardless of the soil and the
treatment, the nutrient with the highest mean concentration in and with the highest
total mass transported by the runoff was NO3-, followed by K+, NH4+, and P (Figure 2 and Table 2). This differs from the results of Ceretta et al. (2010) with 12 applications of PS on an Alfisol (Planossolo) between 2002 and 2007; the authors observed that the K+ transport via runoff was higher than that of P, which in turn was higher than that of N. Considering the nutrient mass lost in the runoff in each rainfall test (Table 2), for the Nitosol, a statistical difference only appeared between treatments in the T1 test for the nutrient P. In the Cambissolo, also only in the T1 test, the treatments were statistically
different for all nutrients except K.
Based on our results, an effect of the different PS application rates on the masses of the studied nutrients was significant only in the first rainfall test (T1), performed only 15 hours after PS application. This implies that intense rainfall soon after the application of PS without its incorporation into the soil increases the risk of nutrient loss by runoff,
which has also been concluded by Allen and Mallarino (2008). Smith et al. (2007) found
that, when applied to the surface of a pasture, PS posed a higher risk to water quality
when rainfall occurred one day after the application compared to mineral fertilizer or
chicken litter applied at the same rate. As time elapsed between the application of PS and the simulated rainfall, the risk of N and P loss through runoff decreased. European
legislation stipulates that chemical or organic fertilizers are not allowed to be applied to
the soil if heavy rainfall is anticipated within 48 hours after application (SI, 2014). When testing this and two other, smaller time intervals (48, 24, and 12 hours), Flynn et al. (2013) confirmed that a safe time interval between the application of PS and the first rain event must not be less than 48 hours to limit the transport of P and sediments by runoff. Regarding the amount of nutrients lost in relation to those applied via PS (Table 2), in general, 100 % of the NO3- applied were lost in all treatments for both soils. These losses can be explained by the low N demand by the soybean crop due to biological N fixation and by the high mobility of NO3
-. The lost amounts of the other nutrients in both
soils were less than 50 % of the amount applied via PS. Among these, the nutrient lost at a lower percentage was P (less than 21 % in the Nitossolo and less than 6 % in the Cambissolo), which is explained by its low mobility in the soil. In this sense, it can be
said that the amounts of nutrients lost by the surface flow in relation to the amounts applied via PS are considerable, especially for NO3
-.
In light of our results, with respect to the mean nutrient concentrations and the total
mass of nutrients in the runoff from both the Nitossolo and the Cambissolo, there
was a definite effect of PS on water quality in the first rainfall test (T1). In some cases, this effect was still noticeable after T2 and T3. After T4, no effect of the rate of PS application was noticed. After T1, the mean concentration and total mass of all nutrients evaluated in the runoff increased with increasing PS application rates. This corroborates the observations by Ceretta et al. (2005), who found that concentrations of mineral nitrogen and available phosphorus in runoff were directly related to the PS
applications of 0, 20, 40, and 80 m3 ha-1. Similarly, Ceretta et al. (2010) observed that an increase in the amount of PS added (0, 20, 40, and 80 m3 ha-1) increased the losses of N, P, and K by surface runoff.
CONCLUSIONS
The transport of NO3
-, NH4 +
, P, and K+
by runoff from a Nitossolo - Alfisol and Cambissolo -
In some cases, an effect of the amount of PS applied on the nutrient transport by runoff
was still noticeable in subsequent simulated rainfalls (T2 and T3), but not any more in
the last simulated rainfall event (T4). The transported amounts of NO3
-, NH4 +
, P, and K+
, originating from the PS, decreased with an increasing period between PS application and the simulated rainfall events. Regardless of the soil and the treatment, NO3
was transported by runoff in the greatest
quantities, followed by K+, NH4 +
, and P.
The Cambissolo - Inceptisol showed a higher nutrient loss pattern than the Nitossolo -
Alfisol, regardless of the applied dose, except for PS 0, for which we observed oscillations
caused by the incorporation of nutrients by the leguminous plants.
The amount of nutrients lost via surface flow in relation to that applied via PS is considerable, especially for NO3
-.
According to the nutrient concentrations in the runoff evaluated for the Nitossolo - Alfisol
and the Cambissolo - Inceptisol, it is unclear whether the PS doses applied in this study
result in significant environmental problems. For such an evaluation, it is also necessary to consider the drained flow and the lateral flow, as the runoff represents only a small part of the water flow in the soil. In addition, the water samples from the runoff contains suspended solids at concentrations different from those found in water bodies, usually assessed for comparison purposes with the environmental resolution.
ACKNOWLEDGMENTS
To the CNPq, Capes, and Udesc-CAV for the financial support for conducting the research and the CNPq and Capes for the research scholarship.
REFERENCES
Allen BL, Mallarino AP. Effect of liquid swine manure rate, incorporation, and timing of rainfall on phosphorus loss with surface runoff. J Environ Qual. 2008;37:125-37. https://doi.org/10.2134/jeq2007.0125
Andrietti G, Freire R, Amaral AG, Almeida FT, Bongiovani MC, Schneider RM. Índices de qualidade da água e de estado trófico do rio Caiabi, MT. Rev Ambient Agua. 2016;11:162-75.
https://doi.org/10.4136/ambi-agua.1769
Assmann TS, Assmann JM, Cassol LC, Diehl RC, Manteli C, Magiero EC. Desempenho da mistura forrageira de aveia-preta mais azevém e atributos químicos do solo em função da aplicação de esterco líquido de suínos. Rev Bras Cienc Solo. 2007;31:1515-23.
https://doi.org/10.1590/S0100-06832007000600028
Associação Brasileira de Criadores de Suínos - ABCS. Produção de suínos: teoria e prática. Brasília, DF: ABCS; 2014.
Bachmann RW, Hoyer MV, Canfield Jr DE. The extent that natural lakes in the United States of America have been changed by cultural eutrophication. Limnol Oceanogr. 2013;58:945-50.
https://doi.org/10.4319/lo.2013.58.3.0945
Barbosa FT, Bertol I, Werner RS, Ramos JC, Ramos RR. Comprimento crítico de declive relacionado à erosão hídrica, em três tipos e doses de resíduos em duas direções de semeadura direta. Rev
Bras Cienc Solo. 2012;36:1279-90. https://doi.org/10.1590/S0100-06832012000400022
Barrows HL, Kilmer VJ. Plant nutrient losses from soils by water erosion. In: Norman AG, editor. Advances in Agronomy. New York: Academic Press; 1963. p. 303-16.
Basso CJ, Ceretta CA, Durigon R, Poletto N, Girotto E. Dejeto líquido de suínos: II - perdas de nitrogênio e fósforo por percolação no solo sob plantio direto. Cienc Rural. 2005;35:1305-12.
https://doi.org/10.1590/S0103-84782005000600012
Basso CJ, Muraro DS, Girotto E, Silva DRO, Silva AN. Poultry litter and swine compost as nutrients sources in millet. Biosci J. 2017;33:288-96. https://doi.org/10.14393/BJ-v33n2-33059 Bertol I, Bertol C, Barbosa FT. Simulador de chuva tipo empuxo com braços movidos
hidraulicamente: fabricação e calibração. Rev Bras Cienc Solo. 2012;36:1905-10.
https://doi.org/10.1590/S0100-06832012000600024
Bertol OJ, Rizzi NE, Favaretto N, Lana MC. Phosphorus loss by surface runoff in
a no-till system under mineral and organic fertilization. Sci Agric. 2010;67:71-7. https://doi.org/10.1590/S0103-90162010000100010
Bertol OJ, Rizzi NE, Favaretto N, Lavoranti OJ. Perdas de nitrogênio via superfície e subsuperfície em sistema de semeadura direta. Floresta. 2005;35:429-42. https://doi.org/10.5380/rf.v35i3.5200
Boink A, Speijers G. Health effect of nitrates and nitrites, a review. Acta Hortic. 2001;563:29-36.
https://doi.org/10.17660/ActaHortic.2001.563.2
Carvalhal R, Barbosa GC, Miyazawa M. Teor de nitrogênio no solo pela aplicação de dejetos de suínos e cama de aviário em Latossolo Vermelho eutroférrico. Syn Scy. 2014;9:1-4.
Caovilla FA, Sampaio SC, Pereira JO, Vilas Boas MA, Gomes BM, Figueirêdo AC. Lixiviação de nutrientes provenientes de águas residuárias em colunas de solo cultivado com soja. Rev Bras
Eng Agric Ambient. 2005;9:283-7.
Cassol EA, Levien R, Anghinoni I, Badelucci MP. Perdas de nutrientes por erosão em diferentes métodos de melhoramento de pastagem nativa no Rio Grande do Sul. Rev Bras Cienc Solo.
2002;26:705-12. https://doi.org/10.1590/S0100-06832002000300015
Ceretta CA, Basso CJ, Vieira FCB, Herbes MG, Moreira ICL, Berwanger AL. Dejeto líquido de suínos: I - perdas de nitrogênio e fósforo na solução escoada na superfície do solo, sob plantio direto. Cienc Rural. 2005;35:1296-304. https://doi.org/10.1590/S0103-84782005000600011 Ceretta CA, Girotto E, Lourenzi CR, Trentin G, Vieira RCB, Brunetto G. Nutrient transfer by runoff under no tillage in a soil treated with successive applications of pig slurry. Agr Ecosyst Environ. 2010;139:689-99. https://doi.org/10.1016/j.agee.2010.10.016
Cogo NP. Effect of residue cover, tillage-induced roughness and slope length on erosion and related parameters [thesis]. West Lafayette: Purdue University; 1981.
Comissão de Química e Fertilidade do Solo - CQFS-RS/SC. Manual de adubação e calagem para os estados do Rio Grande do Sul e Santa Catarina. 10. ed. Porto Alegre: Sociedade Brasileira de Ciência do Solo; 2004.
Conselho Nacional do Meio Ambiente - Conama. Resolução no
357, de 17 de março de
2005: Dispõe sobre a classificação dos corpos de água e diretrizes ambientais para o seu enquadramento, bem como estabelece as condições e padrões de lançamento de efluentes, e dá outras providências. Brasília, DF: Diário Oficial da República Federativa do Brasil; 2005.
p. 58-63.
Dal Bosco TC. Poluição difusa decorrente da aplicação de água residuária da suinocultura em solo cultivado com soja sob condições de chuva simulada [dissertação]. Cascavel: Universidade Estadual do Oeste do Paraná; 2007.
Empresa Brasileira de Pesquisa Agropecuária - Embrapa. Recomendações gerais do encontro sobre uso do simulador de chuva em pesquisa de conservação de solo no Brasil. In: Encontro Nacional Sobre Pesquisa de Erosão com Simuladores de Chuva. Londrina: IAPAR; 1975. p. 107-20.
Flynn CJO, Healy MG, Wilson P, Hoekstra NJ, Troy SM, Fenton O. Chemical amendment of pig slurry: control of runoff related risks due to episodic rainfall events up to 48 hours after application. Environ Sci Pollut Res. 2013;20:6019-27.
Fontana L, Albuquerque ALS, Brenner M, Bonotto DM, Sabaris TPP, Pires MAF, Cotrim MEB, Bicudo DC. The eutrophication history of a tropical water supply reservoir in Brazil. J Paleolimnol. 2014;51:29-43. https://doi.org/10.1007/s10933-013-9753-3
Fundação do Meio Ambiente de Santa Catarina - Fatma. Instrução Normativa nº 11, Suinocultura. Florianópolis, SC; 2014 [cited 2016 Nov 14]. Available from: http://www. sideropolis.sc.gov.br/uploads/273/arquivos/654746 _in_11_Suinocultura.pdf.
Fundação do Meio Ambiente de Santa Catarina - Fatma. Instrução Normativa nº 11, Suinocultura. Florianópolis, SC; 2000 [cited 2013 Sep 8]. Available from: http://www.fatma. sc.gov.br/ index.php? option=com_ docman&task=cat _view&gid=3 2&Itemid=83.
Gilles L, Cogo NP, Bissani CA, Bagatini T, Portela JC. Perdas de água, solo, matéria orgânica e nutriente por erosão hídrica na cultura do milho implantada em área de campo nativo, influenciadas por métodos de preparo do solo e tipos de adubação. Rev Bras Cienc Solo.
2009;33:1427-40. https://doi.org/10.1590/S0100-06832009000500033
Grilo CF, Boina CD, Pinto TKO, Vicente MA, Castro EVR, Barroso GF, Neto RR, Santos CC. A survey of the eutrophication state of an urbanized tropical estuary, the case of the great vitória estuarine system, Brazil. Braz J Aquat Sci Technol. 2016;20:21-8. https://doi.org/10.14210/bjast.v20n1.5230
Guadagnin JC, Bertol I, Cassol PC, Amaral AJ. Perdas de solo, água e nitrogênio por erosão hídrica em diferentes sistemas de manejo. Rev Bras Cienc Solo. 2005;29:277-86.
https://doi.org/10.1590/S0100-06832005000200013
Hautman DP, Munch DJ. Method 300.1: determination of inorganic anions in drinking water by ion chromatography, Revision 1. Ohio: Usepa; 1997 [cited 2014 Nov 14]. Available from: https:// www.epa.gov/sites/production/ files/2015-06/documents/epa-300.1.pdf.
Instituto Nacional de Meteorologia - Inmet. Normais climatológicas do brasil 1961-1990. Brasília-DF; 1992 [cited 2016 Sep 12]. Available from: http://www.inmet.gov.br/portal/index. php?r=clima/normaisClimatologicas
Klein C, Agne SAA. Fósforo: de nutriente à poluente. Rev Elet em Gestão, Educação e Tecnologia
Ambiental. 2012;8:1713-21. https://doi.org/10.5902/223611706430
Lourenzi CR, Ceretta CA, Cerini JB, Ferreira PAA, Lorensini F, Girotto E, Tiecher TL, Schapanski DE, Brunetto G. Available content, surface runoff and leaching of phosphorus forms in a typic hapludalf treated with organic and mineral nutrient sources. Rev Bras Cienc Solo. 2014;38:544-56.
https://doi.org/10.1590/S0100-06832014000200019
Mecabo Júnior J, Bertol I, Barbosa FT, Oselame GS. Erosão hídrica influenciada por uma aplicação de dejeto líquido de suínos no solo cultivado em semeadura direta. Rev Bras Cienc Solo. 2014;38:1601-11. http://dx.doi.org/10.1590/S0100-06832014000500025
Meyer LD, McCune DL. Rainfall simulator for runoff plots. Agr Eng. 1958;39:644-8.
Murphy J, Riley JP. A modified single solution method for determination of phosphate in natural
waters. Anal Chim Acta. 1962;27:31-6. https://doi.org/10.1016/S0003-2670(00)88444-5
Oliveira JGR, Barbosa GMC, Tavares Filho J, Torres EC. Perda de solo e água e riscos ambientais da concentração de nutrientes no escoamento superficial em solo cultivado no sistema de plantio direto e submetido a adubações orgânicas e mineral. Rev Bras Geogr Fis.
2015;8:93-112.
Oren O, Yechieli Y, Boehlke JK, Dody A. Contamination of groundwater under cultivated fields in an arid environment, Central Arava Valley, Israel. J Hydrol. 2004;209:312-28. https://doi.org/10.1016/j.jhydrol.2003.12.016
Owens LB, Malone RW, Shipitalo MJ, Edwards WM, Bonta JV. Lysimeter study of nitrate leaching from a corn-soybean rotation. J Environ Qual. 2000;29:467-74. https://doi.org/10.2134/jeq2000.00472425002900020015x
Pinheiro A, Kaufmann DS, Kaufmann V, Castro NMR. Fluxo de cátions e de ânions após a aplicação de dejetos líquidos suínos em dois sistemas de manejo do solo sob chuva simulada. REGA. 2016;13:1-10. https://doi.org/10.21168/rega.v13n1.p1-10
Ramos JC, Bertol I, Barbosa FT, Marioti J, Werner RS. Influência das condições de superfície e do cultivo do solo na erosão hídrica em um Cambissolo húmico. Rev Bras Cienc Solo.
2014;38:1587-600. https://doi.org/10.1590/S0100-06832014000500024
Sacomori W, Cassol PC, Ernani PR, Miquelluti DJ, Comin JJ, Gatiboni LC. Concentração de nutrientes na solução do subsolo de lavoura fertilizada com dejeto líquido de suínos. Rev Cienc Agrov. 2016;15:245-58. https://doi.org/10.5965/223811711532016245
Santos HG, Jacomine PKT, Anjos LHC, Oliveira VA, Oliveira JB, Coelho MR, Lumbreras JF, Cunha TJF. Sistema brasileiro de classificação de solos. 3. ed. rev. ampl. Rio de Janeiro: Embrapa
Solos; 2013.
Santos SCG, Menezes JFS, Benites VM. Lixiviação de nitrogênio em um Latossolo vermelho cultivado com soja após aplicação de dejetos líquidos de suínos. Gl Sci Technol. 2015;8:49-60. https://doi.org/10.14688/1984-3801/gst.v8n2p49-60
Schoonover JE, Crim JF. An introduction to soil concepts and the role of soils in watershed management. J Contemp Water Res Educ. 2015;154:21-47.
https://doi.org/10.1111/j.1936-704X.2015.03186.x
Seganfredo ML, Eltz FLF, Brum ACR. Perdas de solo, água e nutrientes por erosão em sistemas de culturas em plantio direto. Rev Bras Cienc Solo. 1997;21:287-91.
Sèguy L, Bouzinac S, Maronezzi AC. Sistemas de cultivo e dinâmica da matéria orgânica. Campinas: Instituto Agronômico de Campinas; 2001. (Informações Agronômicas, 96). Sengik E, Martins EM, Silva MAG, Palangana DC. Volatilização de amônia em amostras de um Nitossolo tratado com uréia e submetidos a diferentes teores de água. Sci Agrar Paran.
2001;1:99-111.
Shen QR, Ran W, Cao ZH. Mechanisms of nitrite accumulation occurring in soil nitrification.
Chemosphere. 2003;50:747-53. https://doi.org/10.1016/S0045-6535(02)00215-1
Silva FAS, Azevedo CAV. The Assistat Software version 7.7 and its use in the analysis of experimental data. Afr J Agric Res. 2016;11:3733-40. https://doi.org/10.5897/AJAR2016.11522 Silva GRV, Souza ZM, Martins Filho MV, Barbosa RS, Souza GS. Soil, water and nutrient losses by interrill erosion from green cane cultivation. Rev Bras Cienc Solo. 2012;36:963-70.
https://doi.org/10.1590/S0100-06832012000300026
Smith DR, Owens PR, Leytem AB, Warnemuende EA. Nutrient losses from manure and fertilizer applications as impacted by time to first runoff event. Environ Pollut. 2007;147:131-7.
https://doi.org/10.1016/j.envpol.2006.08.021
Smith VH, Schindler DW. Eutrophication science: where do we go from here? Trends Ecol Evol. 2009;24:201-7. https://doi.org/10.1016/j.tree.2008.11.009
Smith VH, Dodds WK, Havens KE, Engstrom DR, Paerl HW, Moss B, Likens GE. Comment: Cultural eutrophication of natural lakes in the United States is real and widespread. Limnol Oceanogr. 2014;59:2217-25. https://doi.org/10.4319/lo.2014.59.6.2217
Soil Survey Staff. Keys to soil taxonomy. 12th ed. Washington, DC: United States Department of Agriculture, Natural Resources Conservation Service; 2014.
Søvik AC, Syversen N. Retention of particles and nutrients in the root zone of a vegetative buffer zone - effect of vegetation and season. Boreal Environ Res. 2008;13:223-320. Stanisic SM, Ignjatović LM, Stević MC, Đorđević AR. A comparison of sample extraction
procedures for the determination of inorganic anions in soil by ion chromatography. J Serb Chem Soc. 2011;76:769-80. https://doi.org/10.2298/JSC100911069S
Statutory Instruments - SI. Number 31 of European Union (good agricultural practice for
Swanson NP. Rotating-boom rainfall simulator. Trans Am Soc Agric Eng. 1965;8:71-2.
https://doi.org/10.13031/2013.40430
Tomer MD, Moorman TB, Kovar JL, Cole KJ, Nichols DJ. Eleven years of runoff and phosphorus losses from two fields with and without manure application, Iowa, USA. Agr Water Manag. 2016;168:104-11. https://doi.org/10.1016/j.agwat.2016.01.011
United States Department of Agriculture - USDA. Soil texture calculator. USA: NRCS; 2017 [cited 2017 Jun 12]. Available from: https://www.nrcs.usda.gov/wps/portal/nrcs/detail/soils/research/ guide/?cid=nrcs 142p2_054167.
United States Environmental Protection Agency - Usepa. Method 3051A: microwave assisted acid digestion of sediments, sludges, soils, and oils. Revision 1. Washington: DC; 2007 [cited 2015 Jun 18]. Available from: https://www.epa.gov/sites/production/files/2015-12/
documents/3051a.pdf.
Yano Y, Mcdowell WH, Aber JD. Biodegradable dissolved organic carbon in forest soil solution and effects of chronic nitrogen deposition. Soil Biol Biochem. 2000;32:1743-51.
https://doi.org/10.1016/S0038-0717(00)00092-4
Ward MH, Dekok TM, Levallois P, Brender J, Gulis G, Nolan BT, Vanderslice J. Workgroup report: drinking-water nitrate and health - recent findings and research needs. Environ Health Perspect.
2005;113:1607-14. https://doi.org/10.1289/ehp.8043
Wiegand MC, Piedra JIG, Araujo JC. Vulnerabilidade à eutrofização de dois lagos tropicais de climas úmido (Cuba) e semiárido (Brasil). Eng Sanit Ambient. 2016;21:415-24.
https://doi.org/10.1590/S1413-41522016139527