RECENT PROGRESS IN MESOSPHERIC GRAVITY WAVE STUDIES USING
NIGHTGLOW IMAGING SYSTEMS
Michael J. Taylor
1, William R. Pendleton Jr.
2, Pierre-Dominique Pautet
3, Yucheng Zhao
4, Chris Olsen
5,
Hema Karnam Surendra Babu
6, Amauri F. Medeiros
7and Hisao Takahashi
8Recebido em 17 fevereiro, 2006 / Aceito em 28 fevereiro, 2007 Received on February 17, 2006 / Accepted on February 28, 2007
ABSTRACT.A variety of optical remote sensing techniques have now revealed a rich spectrum of wave activity in the upper atmosphere. Many of these perturbations, with periodicities ranging from ∼5 min to many hours and horizontal scales of a few tens of km to several thousands km, are due to freely propagating atmospheric gravity waves and forced tidal oscillations. Passive optical observations of the spatial and temporal characteristics of these waves in the mesosphere and lower thermosphere (MLT) region (∼80-100 km) are facilitated by several naturally occurring, vertically distinct nightglow layers. This paper describes the use of state-of-the-art ground-based CCD imaging techniques to detect these waves in intensity and temperature. All-sky (180◦) image measurements are used to illustrate the characteristics of small-scale, short period (<1 hour) waves and to investigate their seasonal propagation and momentum impact on the MLT region. These results are then contrasted with measurements of mesospheric temperature made using a new temperature mapping imaging system capable of determining induced temperature amplitudes of a large range of wave motions and investigating night-to-night and seasonal variability in mesospheric temperature.
Keywords: gravity waves, mesospheric dynamics, airglow imaging, seasonal variability.
RESUMO.O espectro de ondas na alta atmosfera tem sido revelado por uma variedade de t´ecnicas de sensoriamento remoto ´otico. Muitas destas perturbac¸˜oes apresentam per´ıodos variando de 5 minutos a algumas horas e escalas horizontais que variam de dezenas a milhares de quilˆometros e s˜ao devidas a livre propagac¸˜ao de ondas de gravidade e mar´es atmosf´ericas. Observac¸˜oes ´oticas das caracter´ısticas espacial e temporal destas ondas na regi˜ao (∼80-100 km) da mesosfera e baixa termosfera (MLT) utilizam a variac¸˜ao da aeroluminescˆencia atmosf´erica. Este trabalho descreve oestado da artedas t´ecnicas que utilizam o imageamento via CCD para detectar estas ondas atrav´es das variac¸˜oes provocadas na intensidade e temperatura. Medidas de um imageador de c´eu todo (All-sky, 180◦) s˜ao usadas parar determinar as caracter´ısticas de ondas de pequena escala e curto per´ıodo (<1 hora) e investigar a sazonalidade da direc¸˜ao propagac¸˜ao destas ondas, como tamb´em o dep´osito de momento na regi˜ao da MLT. Estes resultados s˜ao comparados com medidas da temperatura atmosf´erica realizadas usando um novo sistema de imageamento de mapeamento da temperatura mesosf´erica capaz de determinar variac¸˜oes nas amplitudes da temperatura provocadas pelas ondas de gravidade atrav´es da investigac¸˜ao da variabilidade noturna da temperatura mesosf´erica.
Palavras-chave: ondas de gravidade, dinˆamica da mesosfera, luminescˆencia atmosf´erica, sazonalidade, imageador, oscilac¸˜oes atmosf´ericas.
Center for Atmospheric and Space Sciences, Utah State University, Logan, Utah 84322, USA. Phone: +01 (435) 797-3919; Fax: +01 (435) 797-2992 – E-mails: [email protected]; [email protected]; [email protected]; [email protected]; [email protected]; 6hema [email protected] 7Universidade Federal de Campina Grande, Centro de Ciˆencias e Tecnologia, Unidade Acadˆemica de F´ısica, Av. Apr´ıgio Veloso, 882, Bodocong´o – 58109-970 Campina Grande, PB, Brazil. Phone: +55 (83) 310-1196; Fax: +55 (83) 310-1196 – E-mail: [email protected]
INTRODUCTION
It is now known that the largest systematic influence on the me-sosphere and lower thermosphere (MLT) region (altitude range ∼80-100 km) results from relatively small-scale freely propa-gating gravity waves. This is because of their ability to trans-port significant amounts of energy and momentum up from the lower atmosphere source regions to the MLT region where they strongly influence the mean wind and the larger-scale tidal wave motions. As these short-period waves steepen due to adiabatic wave growth with altitude (or by reaching critical layers), they deposit their energy and momentum mainly in the MLT region. In so doing they give rise to horizontal motions, which act to op-pose the background flow and produce closure of the mesosphe-ric jet (e.g. Holton, 1983; Garcia & Solomon, 1985), as well as vertical motions resulting in strong adiabatic cooling responsible for the unexpectedly cold summer mesopause at polar latitudes (as much as 90 K below the radiative equilibrium level). Thus, gravity waves, in particular small-scale, short period waves (e.g. Fritts & Vincent, 1987) are now understood to be a key element in defining both the large-scale circulation, and the regional thermal structure and dynamical variability of the atmosphere at altitudes extending from the stratosphere into the MLT region.
Knowledge of the spatial and temporal characteristics, geo-graphic distribution and seasonal variability of these waves at MLT heights is therefore of key interest. However, as the mean winds and tides in the intervening atmosphere can modulate the gravity wave fluxes, and as they both vary strongly with latitude and season, the upward flux of momentum at a given site and time is expected to vary significantly. Optical remote sensing me-asurements have established the global presence of these wa-ves at equatorial mid- and high-latitudes and their basic pro-perties. However, their momentum coupling and effects on the MLT region have only been investigated from a limited number of sites, and their seasonal variability are not well known for any place on earth.
Of equal importance to this investigation is accurate know-ledge of the basic properties of the MLT region (background tem-perature and wind fields) in which these waves propagate and dissipate. Measurements using meteor radar and more recently powerful Na lidar systems have provided unprecedented infor-mation on the vertical structuring of the MLT and the influence of tides. In particular, Na wind-temperature lidar systems pro-vide high-resolution, height-resolved measurements of the wind and temperature field over the range ∼80-100 km (e.g. States & Gardner, 2000) essential for investigating the effects of tides and
gravity waves on the MLT region. However, due to their comple-xity lidar systems are usually operated only 2-3 nights/month and climatology studies, therefore, lack necessary details associated with spring and fall transitions and shorter term variability due to planetary waves, tides and gravity waves.
Long-term optical measurements can provide important infor-mation, not only on the properties of the gravity waves but also in the background wind and temperature field. Here we present some recent results on gravity wave seasonal anisotropy obtained using all-sky (ASI) monochromatic imagers and novel measurements of seasonal temperature variability in the MLT at low-latitudes using the CEDAR Mesospheric Temperature Mapper (MTM). As we will show, imagers are becoming powerful tools for remote-sensing studies of the upper atmospheric dynamics as they provide key data complementary to those usually obtained using established radar and other passive and active optical techniques. In particu-lar, imagers are relatively low cost and can be run automatically for extended periods (years) essential for long-term investigations of the MLT climatology.
IMAGE MEASUREMENTS OF SHORT-PERIOD GRAVITY WAVES
Images of the naturally occurring nightglow emissions afford an excellent method for investigating the horizontal morpho-logy and dynamics of short-period (typically <1 hour) gravity waves. There are several prominent emissions at MLT heights which can be used for this study: the near infra-red (NIR) OH bands (peak altitude ∼87 km), the O2(0,1) Atmospheric band
(∼94 km), the OI(557.7 nm) green line (∼96 km) and the Na D (589.2 nm) doublet (∼90 km), all of which exhibit typical night-time half-widths (FWHM) of 8-10 km. As gravity waves propa-gate through these layers they induce significant modulation in the line-of-sight brightness and rotational temperature which is detected as radiance “structure”. Several instruments have been developed to investigate the morphology and dynamics of the nightglow emissions. However, the exceptional capabilities of high quantum efficiency CCD arrays for low-light imaging stu-dies at visible and NIR wavelengths makes them the detectors of choice for many gravity wave studies. In particular, all-sky (180◦)
imagers provide unique two-dimensional information on the spa-tial and the temporal properties of short-period gravity waves (∼5-60 min) over a maximum (single site) area of ∼500,000 km2
(e.g. Taylor et al., 1995; Medeiros et al., 2003; 2004).
Figure 1 is a photograph of a Utah State University (USU) all-sky imager (originally developed in 1993), mounted in a frame
Figure 1 – All-sky, monochromatic CCD imager developed at Utah State University for imaging short-period gravity waves
in the faint MLT emissions. The camera system is mounted vertically to view the night sky through a perspex dome.
under a perspex dome. A high-resolution 1024 × 1024 pixel, back-thinned CCD array is used providing excellent, low-noise measurements of the airglow emissions. The CCD is cooled to –40◦C to limit the dark current to typically a few electrons/
pixel/sec and a telecentric lens arrangement coupled to a 6-position filter wheel is used to provide wide-field (180◦)
se-quential images of selected airglow emissions (filter bandwidths <2 nm). Typical exposure time range from 15 sec for the bright NIR OH bands to 90 sec for the OI(557.7 nm) line emissions. This instrument is a compact, well-proven field system capable of autonomous operation, long-term operation with remote con-trol and data access via the internet.
Figure 2 illustrates a short-period quasi-monochromatic wave event imaged near simultaneously in four different MLT air-glow emissions (OI, O2, Na and OH). The data were obtained from
Bear Lake Observatory (BLO), Utah, USA on 5 June 2002 and are typical of many of the spatially extensive, but short-period wave events detected from a number of sites at equatorial, mid- and high latitudes. In this example the stars have been removed, prior to spectral analysis to determine the horizontal wavelength (λh=
45 km) and motion (vh= 45m/s) of the waves pattern (observed
period 15 min). Note, the Milky Way is still evident as a bright band in the upper left of each image. Also note the presence of a set of much smaller-scale ripple waves in the lower-altitude
(∼87 km) OH emission. These are mainly due to spatially locali-zed shear or convective instabilities and unlike the gravity waves are generated in-situ (e.g. Taylor & Hapgood, 1990; Hecht, 2004 and references therein).
OI
O
2OH
Na
Figure 2 – Example of a spatially extensive short-period gravity wave event
ima-ged near simultaneously in four nightglow emissions using an all-sky (180◦) bare CCD imager. The data were obtained from BLO on 5 June, 2002. (Note: stars have been removed from these data to aid spectral analysis.)
Imaging systems are most sensitive to relatively fast-moving waves exhibiting vertical wavelengths somewhat greater than the layer thickness (i.e. >8 km) and horizontal wavelengths (λh)
∼5-200 km (i.e. significantly less than the maximum field of view). This is exactly the range of scale sizes that are the most important drivers of the MLT region dynamics. The majority of these waves ((λh up to a few hundred km) are considered to
be generated in the lower atmosphere by weather related distur-bances such as convective activity, wind shear instabilities (jet streams), storms or fronts, or by orographic forcing (wind flow over mountainous regions). Image measurements of the airglow emissions can be made at any latitude and season providing a global, all year round capability. Such studies have revealed a wealth of small-scale wave activity from many sites around the world and it is not uncommon to observe several different wave patterns during the course of a night suggesting copious sources.
GRAVITY WAVE ANISOTROPY
An important result arising from airglow image analysis is that short-period waves often exhibit marked preference in their
pro-pagation headings when observed over intervals of a few weeks. Such measurements made over the course of a year are still quite rare but they all indicate strong anisotropy that also appears to vary systematically with the seasons. Taylor et al. (1993) were the first to investigate this anisotropy in image data and attributed it to wave blocking by winds. Their results, obtained over a 3-month period from Ft. Collins, Colorado, indicated that critical-layer filtering of the waves by the background winds in the inter-vening atmosphere (stratosphere and lower mesosphere) was an important factor in governing the propagation of wave energy (and momentum) into the MLT region. Critical layers occur when the horizontal wind vector along the direction of motion of the wave equals its observed horizontal phase speed (e.g. Tuan & Tadic, 1982). Under these conditions the intrinsic frequency of the gra-vity wave is Doppler-shifted to zero and its energy may be absor-bed into the background flow.
Figure 3 shows the results of a 1-year investigation of OH wave data imaged using the USU all-sky imager sited at Cachoei-ra Paulista, BCachoei-razil (23◦S) (Medeiros et al., 2003). This figure
compares measurements of the wave velocities observed during the summer and winter seasons (four months each). Note, only sparse data were obtained during the equinox periods and are not shown here. Each plot shows the horizontal direction of motion of quasi-monochromatic waves versus their observed wave speed. It is clear that during the course of the year the dominant direction of the waves switches over from eastward in the summer months to mainly westward in the winter months. This result is consistent with the reversal of the stratospheric winds, whose magnitudes are comparable to the wave phase speeds, and suggests that, at least at low-latitudes, the small-scale gravity wave flux is being modu-lated strongly by the middle atmospheric wind field. This situation is indicated by the shaded areas that represent height-integrated “blocking regions”. These are forbidden regions for the waves resulting from wind filtering at lower altitudes and were construc-ted using CIRA-86 climatological wind profiles. The prevailing direction of the wave ensemble is clearly opposite to that of the height integrated blocking region.
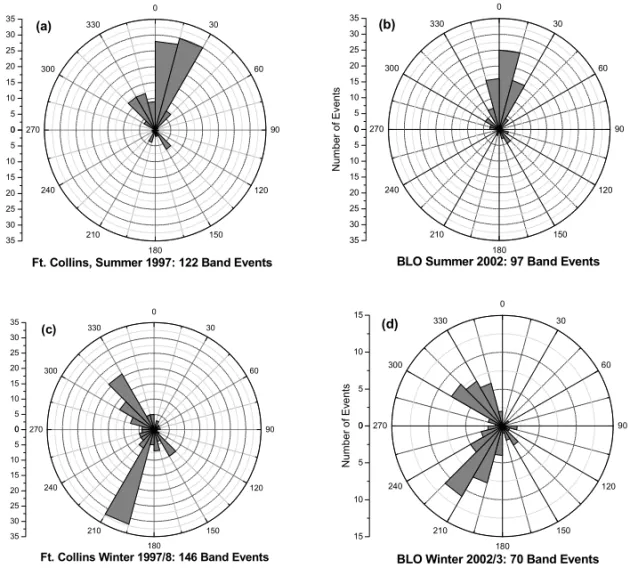
For comparison, Figure 4 shows the results of a similar wave analysis performed on two seasonal data sets obtained at Ft. Collins, Colorado (40◦N) and at BLO, Utah (41.6◦). These
si-tes are at similar latitudes but separated in longitude by ∼550 km. In each of these figures the data have been summed into 15◦wide
sectors and plotted versus number of events. The Ft. Collins data were obtained in 1997-1998 and show a marked meridional ani-sotropy with strong motions towards the north during summer and a switch over to a bimodal-like distribution during the
win-ter months exhibiting strong southward motion, but also signifi-cant north-westward motion. These data also show a more subtle, but never the less a distinct zonal switch over from an eastward component of wave propagation during the summer months to a distinct westward component of wave propagation during winter, which is consistent with critical-layer blocking effects. However, the dominance of the meridional signature is unexpected. The BLO data were recorded during 2002 and 2003 and show remar-kable similarities to the Ft. Collins data for both the summer and winter seasons with dominant northward (poleward) motion during the summer and bimodal propagation during the winter months. (Note the change of scale in Figure 4d due to redu-ced number of events observed during the wintertime at BLO.) As these two data sets were taken from similarly located sites but separated in time by ∼5 years they clearly show that this reversal is a recurrent seasonal effect (at least at mid-latitudes).
Figure 3 – Effect of seasonal variability on the propagation of short-period
gra-vity waves observed from Cachoeira Paulista, Brazil (23◦S, 45◦W). The solid arrows show the magnitudes and directions of the horizontal phase speed of the waves imaged in the OH emission for summer and winter seasons. The sha-ded areas represent the expected blocked directions for wave propagation during these two seasons (due to background wind-filtering effects). Adapted from Me-deiros et al. (2003).
Other observers have also reported anisotropy in their wave measurements (e.g. Nakamura et al., 1999; Walterscheid et al., 1999; Hecht et al., 2001), some with strong meridional
aniso-tropy. Walterscheid et al. (1999) suggested this could be due to wave ducting rather than wind filtering effects. Ducting can occur due to shears in the background winds in the MLT region (termed Doppler ducting) or to changes in the local temperature gradient (termed thermal or Brunt ducting). Due to their relatively small scale sizes, short-period waves are susceptible to both thermal and Doppler ducting in the vicinity of the mesopause (e.g. Chi-monas & Hines, 1986). Unlike freely propagating waves, ducted waves can travel large horizontal distances from their source re-gions and their impact on the MLT remains uncertain at this time. For example, an analysis of image data obtained from Hawaii du-ring spdu-ring 1993 indicates that as much as 75% of the waves imaged over the mid-Pacific ocean exhibited ducted or evanes-cent characteristics (Isler et al., 1997). However, a reevanes-cent study by Nielsen et al. (2006) suggests mainly freely propagating waves at high-latitudes during the winter months. Clearly further seasonal investigations of the nature (i.e. freely propagating or ducted) of short-period wave and their directional anisotropy are important.
GRAVITY WAVE AND TIDAL TEMPERATURE PERTURBATIONS
A new type of imager termed a “Mesospheric Temperature Map-per” (MTM) was developed at USU in the late 1990s. Like the all-sky camera systems this imager utilizes a high quantum ef-ficiency (∼50% at NIR wavelengths) bare CCD array. The large dynamic range and low noise characteristics (dark current ∼0.1 electrons/pixel/sec at -50◦C) of this array together with its high
linearity and stability provide an exceptional capability for long-term, quantitative measurements of the nightglow emissions. The camera has a 90◦field of view and is fitted with a fast (f/5.6)
tele-centric lens system permitting narrow-band (∼1.2 nm) measure-ments of the OH Meinel (6,2) P1(2) and P1(4) rotational lines and
two selected regions of the O2(0,1) Atmospheric band to
inves-tigate the mesospheric temperature and intensity perturbations at two distinct altitudes (∼87 and ∼94 km, respectively). Spatial resolution in the zenith is about 0.9 km which is quite suffici-ent to resolve even the shortest scale gravity waves (λh>5 km).
In operation, sequential 60-sec exposures are made: two OH, two O2and a background sky measurement at 857 nm resulting in
an effective sampling rate of ∼6 min. Rotational temperatures are computed using the ratio method, described by Meriwether (1975). Comparisons of the MTM temperatures with those ob-tained by other well calibrated instruments (Na temperature lidars and Fourier Transform Infra-red spectrometers) indicate that our absolute temperatures are reliable to ±5 K. However, the precision
0 5 10 15 20 25 30 35 0 30 60 90 120 150 180 210 240 270 300 330 0 5 10 15 20 25 30 35
Ft. Collins, Summer 1997: 122 Band Events (a) 0 5 10 15 20 25 30 35 0 30 60 90 120 150 180 210 240 270 300 330 0 5 10 15 20 25 30 35
Ft. Collins Winter 1997/8: 146 Band Events
(c) 0 5 10 15 20 25 30 35 0 30 60 90 120 150 180 210 240 270 300 330 0 5 10 15 20 25 30 35
BLO Summer 2002: 97 Band Events
Nu m be r o f E ve nt s (b) 0 5 10 15 0 30 60 90 120 150 180 210 240 270 300 330 0 5 10 15
BLO Winter 2002/3: 70 Band Events
Nu m be r o f E ve nt s (d)
Figure 4 – Seasonal summer-winter comparison of short-period gravity wave anisotropy observed at Ft. Collins (1998) and BLO
(2002-2003), two well separated but similar latitude sites in the USA. Both data sets are remarkably similar and exhibit strong meri-dional anisotropy, with a marked preference for northward wave motion during the summer months switching over to a bimodal-like distribution with strong southward wave motion. (Note the change of scale in Figure 4d.)
of the OH and O2measurements (most important for determining
wave perturbation amplitudes) is much higher at ∼1-2 K (Zhao et al., 2005). 1 2 3 4 5 6 7 8 9 10 11 12 13 14 190 200 210 220 230 240 Te m pe ra tu re (K ) UT Time (hr)
Bear Lake Observatory Dec. 01-02, 2000
OH
O2
Figure 5 – Example MTM measurements of OH and O2temperature showing a large amplitude tidal oscillation of period ∼11 hours with superposed smaller-scale gravity wave of ∼80 min period. The data were obtained from BLO on 1/2 December 2000 and show a marked phase shift with O2leading signal indicative of a downward progressing tide.
The MTM has been used on several extended campaigns to investigate gravity wave and tidal harmonic characteristics and most recently to study the characteristics of the semi-annual os-cillation (SAO) at low-latitudes. Figure 5 shows an example of a long period (∼11 hr) oscillation and a superimposed shorter pe-riod wave (∼80 min) evident in both the OH and O2emissions.
The data were obtained from BLO on 2 December 2000. A marked phase shift (∼1 hour) exists between the two large amplitude wa-ves with the O2 signal clearly leading the OH oscillation indicative of a downward progressing semidiurnal tide. The same signatu-res are evident in the signatu-respective band intensity data (not shown) which also yield information on the relative phase relationships between the intensity and temperature waves and their amplitu-des. The ability to measure the temperature perturbations (1T/T) as well as the intensity variations (1I/I) induced by the passage of monochromatic gravity waves provides a new method for esti-mating their momentum flux, when combined with information on
Intensity
Temperature
Figure 6 – Maps of OH (6, 2) band intensity and rotational temperature derived from MTM data obtained on 11 April,2002. The observed period of the gravity wave was 17 min. The lines marks location of intensity and temperature scans shown in Figure 7.
their intrinsic wave parameters (e.g. Swenson et al., 1999; Taylor et al., 2001).
This technique is illustrated in Figure 6 which shows maps of intensity and OH rotational temperature derived from the MTM. The data were obtained from the summit of Haleakela Crater, Maui, Hawaii as part of the Maui-MALT program. The figures show a short observed period gravity wave imaged on 11 April, 2002 (λh
= 37 km, vh= 36 m/s, observed period of 17 min). The black lines
in each case show the location of intensity and temperature scans used to determine the amplitude and phase of the wave in each case (see Fig. 7). Simultaneous wind measurements (not shown) have been used to determine the intrinsic wave period and to show that this wave was freely propagating (using the “vertical wave number squared” method described by Isler et al., 1997). Using these data an estimate of the horizontal momentum flux of this quasi-monochromatic wave can be obtained using the method described in Liu & Swenson (2003). Using an estimated Brunt-Vaisala period of 5 min (derived from simultaneous Na lidar tem-perature data), the magnitude of the momentum flux was found to be 30 ± 10 m2/s2. This is consistent with previous (limited)
mea-surements using lidar and optical/image methods (e.g. Gardner et al., 1999; Swenson et al., 1999) for a relatively low-contrast wave event but well below that determined by Fritts et al. (2002) for a high-contrast wave breaking event reported by Yamada et al., 2001. This example illustrates the capability of the MTM when combined with simultaneous Na lidar data for accurate momen-tum flux measurements.
For the past four years the MTM has operated near-continu-ously from the U.S. Air Force Maui Optical Station (AMOS) on Haleakala Crater, Maui, Hawaii. Our primary goal has been to obtain long-term coordinated measurements using a cluster of
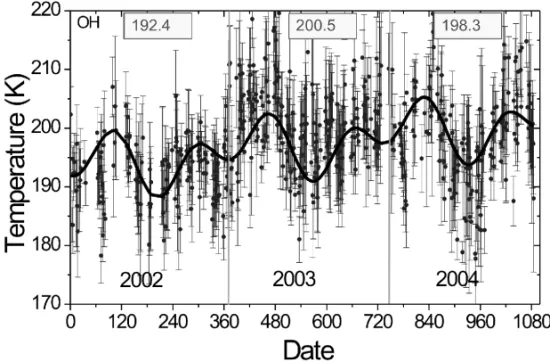
instruments including and Na wind-temperature lidar, a meteor wind radar and other passive optical measurements. These data were obtained as part of a joint NSF/AFOSR (Air Force Office of Scientific Research) sponsored Maui-MALT initiative. Figure 8 illustrates this new capability of the MTM for long-term, seaso-nal and inter-annual variability studies (Taylor et al., 2005). The figure shows three consecutive years of data from 2002 to 2004 inclusive. The “error bars” represent the standard deviation on the nocturnal temperature variability for each night due mainly to geophysical variability (tides).
Figure 7 – Plot of relative band intensity and rotational temperature perturbation
amplitudes for the data of Figure 6.
Previous airglow measurements at equatorial and low-latitudes from Brazil have shown the presence of a strong SAO in emission intensity and temperature (Takahashi et al., 1995). Our data recorded at low-latitudes (∼20◦N) show evidence of an
SAO and possibly an annual oscillation (AO) in OH temperature (and O2temperature, not shown here). This is illustrated by the
Figure 8 – Plot of nightly averaged OH rotational temperatures for three consecutive years 2002-2004. (Note,
only data >4 hours in duration are shown). The data show evidence of a semi-annual oscillation as well as an annual oscillation as expected from this low-latitude site but rarely measured to date.
a mean, AO and an SAO oscillation. The amplitude of each com-ponent is similar at ∼3.5 K. This study is still in progress but has already yielded a significant amplitude SAO in OH and O2
tem-peratures consistent with the southern hemisphere observations by Takahashi et al. (1995). The marked asymmetry in the spring and autumnal amplitudes was not evident in the equatorial data of Takahashi et al. (1995) but is most suggestive of a significant an-nual component. The high “density” of the data points illustrates well the capability of the MTM for long-term measurements.
SUMMARY
Image measurements of the nightglow emissions, which were once considered a novelty, have now proven to be an essential element in the quantitative investigation of gravity wave forcing of the MLT region. In particular their sensitivity to small-scale waves as well as their adaptability to multi-wavelength radiance and tem-perature measurements makes them a powerful tool for dynamical studies. The two-dimensional image data provide a direct mea-sure of wave anisotropy, important for investigating wind filtering and ducting effects as well as novel data on wave breaking and tur-bulence leading to the transfer of momentum into the background flow. Ongoing observations as part of the Maui-MALT initiative are providing important new data on seasonal variability of me-sospheric temperature as well as short-period gravity waves over the central Pacific Ocean where deep convective forcing is expec-ted to be the dominant source mechanism for wave generation.
ACKNOWLEDGEMENTS
We wish to thank University of Illinois lidar group for the use of their wind/temperature data for our preliminary short-period mo-mentum flux wave studies. We gratefully acknowledge the US NSF and AFOSR for their continued support of the Maui-MALT mea-surements at the AMOS Facility, Maui, HI. Funding for this rese-arch has been provided in part by the following grants for the NSF ATM 0003218, ATM 0000959 and ATM0455259 and NASA grant NNG04GA13G.
REFERENCES
CHIMONAS G & HINES CO. 1986. Doppler ducting of atmospheric gra-vity waves. J. Geophys. Res., 91: 1219.
FRITTS DC & VINCENT RA. 1987. Mesospheric momentum flux studies at Adelaide, Australia: Observations and gravity wave-tidal interaction mode. J. Atmos. Sci., 44: 605.
FRITTS DC, VADA SL & YAMADA Y. 2002. An estimate of strong local body forcing and gravity wave radiation based on OH airglow and meteor radar observations. Geophys. Res. Lett., 29: 71.
GARCIA RR & SOLOMON S. 1985. The effect of breaking gravity waves on the dynamics and chemical composition of the mesosphere and lower thermosphere. J. Geophys. Res., 90: 3850.
GARDNER CS, GULATI K, ZHAO Y & SWENSON G. 1999. Measuring gravity wave momentum fluxes with airglow imagers. J. Geophys. Res., 104: 11,903–11,915.
HECHT JH. 2004. Instability layers and airglow imaging. Rev. Geophys., 42: RG1001, doi:10.1029/2003RG000131.
HECHT JH, WALTERSCHEID RL, HICKEY MP & FRANKE SJ. 2001. Climatology and modeling of quasi-monochromatic atmospheric gra-vity waves observed over Urbana, Illinois. J. Geophys. Res., 106: 5181–5195.
HOLTON JR. 1983. The influence of gravity wave breaking on the circu-lation of the middle atmosphere. J. Atmos. Sci., 40: 2497–2507. ISLER JR, TAYLOR MJ & FRITTS DC. 1997. Observational evidence of wave ducting in the mesosphere. J. Geophys. Res., 102: 26301. LIU AZ & SWENSON GR. 2003. A modeling study of O2 and OH airglow perturbations induced by atmospheric gravity waves. J. Geophys. Res., 108: 4151.
MEDEIROS AF, TAYLOR MJ, TAKAHASHI H, BATISTA PP & GOBBI D. 2003. An investigation of gravity wave activity in the low-latitude upper mesosphere: Propagation direction and wind filtering. J. Geophys. Res., 108: 4411.
MEDEIROS AF, BURITI RA, MACHADO EA, TAKAHASHI H, BATISTA PP, GOBBI D & TAYLOR MJ. 2004. Comparison of gravity wave activity observed by airglow imaging from two different latitudes in Brazil, J. At-mos. Solar-Terr. Phys, 60: 647–654, doi: 10.1016/j.jastp.2004.01.016. MERIWETHER JW. 1975. High latitude airglow observations of correla-ted short-term fluctuations in the hydroxyl Meinel 8- 3 band intensity and rotational temperature, Planet. Space Sci., 43: 1211–1221.
NAKAMURA T, HIGASHIKAWA A, TSUDA T & MATSUSHITA Y. 1999. Seasonal variations of gravity wave structures in OH airglow with a CCD imager at Shigaraki. Earth Planets Space, 51: 897–906.
NIELSEN K, TAYLOR MJ, PAUTET PD, FRITTS DC, MITCHELL N, BELDON C, SINGER W, SCHMIDLIN FJ & GOLDBERG RA. 2006. Pro-pagation of short-period gravity waves at high-latitudes during the MaCWAVE winter campaign. Ann. Geophys., 24: 1–17.
STATES RJ & GARDNER CS. 2000. Thermal structure of the mesopause region (80-105 km) at 40◦N latitude. Part II: diurnal variations. J. Atmos. Sci., 57: 78–92.
SWENSON GR, HAQUE R, YANG W & GARDNER CS. 1999. Momentum and energy fluxes of monochromatic gravity waves observed by an OH imager at Starfire Optical Range, NM. J. Geophys. Res., 104: 6067.
TAKAHASHI H, CLEMESHA BR & BATISTA PP, 1995. Predominant semi-annual oscillation of the upper mesospheric airglow intensities and tem-peratures in the equatorial region. J. Atmos. Terr. Phys., 57(4): 407–414. TAYLOR MJ & HAPGOOD MA. 1990. On the origin of ripple-type wave structure in the OH nightglow emission. Planet Space Sci., 38: 1421– 1430.
TAYLOR MJ, RYAN EH, TUAN TF & EDWARDS R. 1993. Evidence of pre-ferential directions for gravity wave propagation due to wind filtering in the middle atmosphere. J. Geophys. Res., 98 (A4): 6047.
TAYLOR MJ, BISHOP MB & TAYLOR V. 1995. All-sky measurements of short period waves imaged in the OI(557.7 nm), Na(589.2 nm) and near infrared OH and O2(0,1) nightglow emissions during the ALOHA-93 campaign. Geophys. Res. Lett., 22: 2833.
TAYLOR MJ, GARDNER LC & PENDLETON JR. WR. 2001. Long-period wave signatures in mesospheric OH Meinel (6,2) band intensity and ro-tational temperature at mid-latitudes. Adv. Space Res., 27: 1171–1179. TAYLOR MJ, TAORI AK, HATCH DR, LIU HL & ROBLE RG. 2005. Charac-terization of the semi-annual-oscillation in mesospheric temperatures at low-latitudes. Adv. Space Res., 35: 2037–2043.
TUAN TF & TADIC D. 1982. A dispersion formula for analyzing ‘modal interference’ among guided and free gravity wave modes and other phe-nomena in a realistic atmosphere. J. Geophys. Res., 87: 1648. WALTERSCHEID RL, HECHT JH, VINCENT RA, REID IM, WOITHE J & HICKEY MP. 1999. Analysis and interpretation of airglow and ra-dar observations of quasi-monochromatic gravity waves in the upper mesosphere and lower thermosphere over Adelaide, Australia (35◦S, 138◦E). J. Atmos. Solar-Terr. Phys., 61: 461–478.
YAMADA Y, FUKUNISHI H, NAKAMURA T & TSUDA T. 2001. Breaking of small-scale gravity wave and transition to turbulence observed in OH airglow. Geophys. Res. Lett., 28(11): 2153–2156.
ZHAO Y, TAYLOR MJ & CHU X. 2005. Comparison of simultaneous Na lidar and mesospheric nightglow temperature measurements and the ef-fects of tides on the emission layer height. J. Geophy. Res., 110: D09S07, doi:10.1029/2004JD005115.
NOTES ABOUT THE AUTHORS
Michael J Taylor gained his Bachelors degree (with honors) in Physics in 1974. A Masters degree in Electronic in 1977 and a Ph.D in Atmospheric Physics in 1986
all from the University of Southampton, U.K. Currently he is a Professor of Physics in the Center for Atmospheric and Space Sciences and Physics Department at Utah State University, USA. His primary research interests are low-light imaging of a broad range of atmospheric phenomena focusing on mesospheric dynamics.
William R. Pendleton, Jr. is Professor emeritus at Utah State University. He gained a Bachelors of Arts degree at William Jewell College, Liberty, Missouri in
1959 and a Ph.D. in Physics at the University of Arkansa in 1964. He joined Utah State University in 1966 where he specialized in airglow and auroral energetics and spectroscopy.
Pierre-Dominique Pautet gained his Bachelors degree in Applied Physics in 1995 and his Masters degree in Image Processing in 1996 from University of Bourgogne,
France. He gained his Ph.D. in Image Processing in 2000 from the University of Franche-Comte, France. He worked as a Post Doctoral Fellow in Center for Atmospheric and Space Sciences at Utah State University from 2001-2006 specializing in airglow and sprite measurements.
Yucheng Zhao gained her Bachelors degree in Meteorology in 1988 and her Masters degree in Atmospheric dynamics in 1991, both from China. She obtained her
Ph.D. in Atmospheric Sciences from University of Illinois in 2000. She is a Senior Research Associate working in the Center for Atmospheric and Space Sciences at Utah State University. Her research focuses on mesospheric dynamics.
Chris Olsen gained his Bachelors degree in Physics at Utah State University in 2004. As an undergraduate student he worked as a data analysis in the Center for
Atmospheric and Space Sciences at Utah State University. He is currently serving as a U.S. Naval Officer.
Hema Karnam Surendra Babu gained her Bachelors of Technology degree in Electronics and Communications Engineering at the Jawaharlal Nuhru Technological
University, Hyderabad, India in 2001. She gained her Masters degree in Electrical and Computer Engineering at Utah State University in 2006.
Amauri Fragoso de Medeiros is a Physics professor at Federal University of Campina Grande (UFCG), Brazil. He is graduated in Physics at the Regional University
of the Northeast (URNe), Brazil, obtained his MSc. Degree in Science Teaching from S˜ao Paulo University (USP), Brazil, and his Ph.D. in Space Geophysics from the National Institute for Space Research (INPE). His present research interests include the dynamics of the upper mesosphere using airglow and meteor radar experiments and irregularities in the ionosphere.
Hisao Takahashi is a researcher at the National Institute for Space Research (INPE) since 1970. He received his BSc. and MSc. in Physics at the Niigata University
(1968, 1970) and obtained his Ph.D. in Space Sciences at the INPE (1980). His research interests include behavior studies of the airglow, dynamics and chemistry of the upper mesosphere and ionosphere.