ABSTRACT.Mathematical models are relevant to indicate the optimal location of facilities and, con-sequently, help in the search for efficiency in the supply chain. Although facility location problems are consolidated in the Operational Research field, few publications are dedicated to investigate the profile of the academic production (the amount of paper published), aiming to direct new studies on the subject and propose models that solve the current challenges. Thus, this paper aims to present a scientometric analysis of the articles on facility location published in the Web of Science, in order to verify the profile of Brazilian scientific production. As result, approximately 2% of the papers have researchers affiliated to Brazilian in-stitutions. The interest for the subject is recent, with emphasis on universities. Brazil maintains an intense international collaboration network, cooperating with 45 different countries, especially USA. Finally, there is opportunity for publications that include the environmental dimention to mathematical models and for expansion in company-university-government collaboration.
Keywords: facility location, operational research, logistics, Brazil, scientometry.
1 INTRODUCTION
The low efficiency of the Brazilian transport sector is due, among other factors, to its high logis-tics cost – which varies from 10.6% to 15% of Gross Domestic Product – GDP, while the United States registers 8.5% (CNT, 2014). As a result, different government programs, such as the Na-tional Logistics and Transport Plan – PNLT (MT, 2007, 2009, 2012), State Plan of Logistics of Cargo of the State of Rio de Janeiro – PELC/RJ (Government of Rio de Janeiro, 2013) and the Strategic Plan for Logistics and Transport of the State of Esp´ırito Santo – PELT/ES (Government of Esp´ırito Santo, 2009), indicate the need for the installation of integration terminals.
*Corresponding author.
1Centro Federal de Educac¸˜ao Tecnol´ogica Celso Suckow da Fonseca – CEFET/RJ. Rua do Areal, 522, Sala 4D, Parque Mambucaba, 23953-030 Angra dos Reis, RJ, Brazil. E-mail: [email protected]
2Programa de Engenharia de Transportes – COPPE/UFRJ. Cidade Universit´aria, Centro de Tecnologia, Bloco H, sala 111, Caixa Postal 68511, 21941-972 Rio de Janeiro, RJ, Brazil. E-mail: [email protected]
These terminals would be essential to achieve the rebalancing of the transport matrix and, con-sequently, the reduction of logistics costs and the increase of competitiveness of the country’s economy (Guimar˜aes et al., 2017ab). Thus, location models appropriate to the Brazilian context would become relevant to achieve the government goals stablished for the transport sector.
In this context, it becomes relevant to understand the profile of academic research about facilities location, in order to direct future studies to fill the main gaps on the subject, as well as to under-stand the main areas of interest and how the collaboration network is configured between authors and organizations. This could facilitate the exchange of information and the establishment of partnerships for joint studies, especially to solve specific problems in the Brazilian context.
Thus, the following problem arises: what is the dynamics of the Brazilian scientific production (the amount of paper published) related to facility location models? Therefore, this paper aims to present a scientometric analysis of the articles about facility location, published in Web of Science, in order to verify the profile of the Brazilian scientific production of this area. As specific objectives, we intend to: (i) present the evolution of the Brazilian publications regarding this theme, identifying the main authors and organizations; (ii) identify the collaboration network among authors, organizations and countries related to Brazilian publications; and (iii) identify the importance of the facility location theme to transportation area, in the Brazilian context. For that, descriptive statistics techniques were applied, together with Scientometry and Social Network Analysis (SNA), as described in Section 3.
The article is divided into four more sections after this introduction: (i) discussion of location problems; (ii) description of the methodological procedures; (iii) presentation and discussion of the results; and (iv) final considerations.
2 LOCATION PROBLEMS
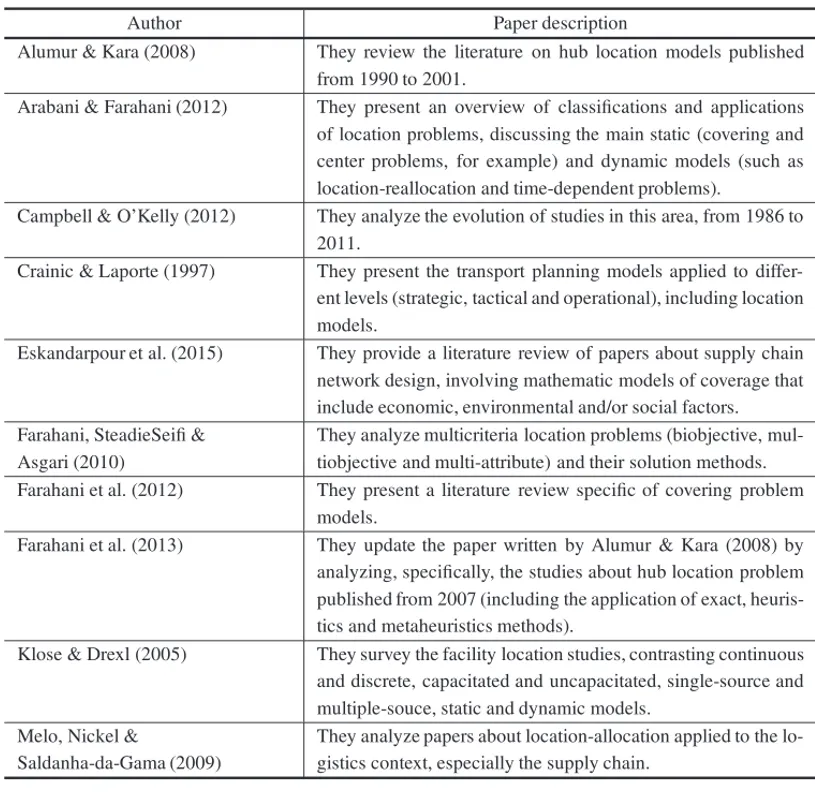
The facility location problems are consolidated in the Operational Research literature (Melo, Nickel & Saldanha da Gama, 2009), attracting researchers’ interest due to their various appli-cations (Ulukan & Demircioglu, 2015) in the public, private, military and/or business areas, nationally and internationally (Farahani, SteadieSeifi & Asgari, 2010). Table 1 summarizes dif-ferent studies that address this theme, showing the difdif-ferent types of problems studied as well as the types of facility to be located.
In Table 1, we verify facilities dedicated to the freight transportation (such as intermodal termi-nals and hubs), as well as facilities for the citizen (such as health services and parking lots). The types of problems also range from simple linear location and/or allocation problems to capaci-tated, multiperiod and multilayer ones (among others).
Nickel (2015) budget constraints
Guimar˜aes et al. (2017a) Location-allocation problem Integration logistic centers Guimar˜aes et al. (2017b) Location-allocation problem Integration logistic centers
Hajipour et al. (2016) Location-allocation problem5 Multi-layer facilities Hamadani et al. (2013) Location-allocation problem Parkings
Harris, Mumford & Naim (2014)
Location-allocation problem Facilities (e.g. depots)
He et al. (2015) Hub location problem Intermodal hubs Ishfaq & Sox (2011) Hub location-allocation problem Intermodal hubs
Lin, Chiang & Lin (2014) Location problem Intermodal terminals (e.g. container terminals)
Lin & Lin (2016) Location problem Intermodal terminals (e.g. container terminals)
Meisel, Krischtein & Bierwith (2013)
Intermodal transportation planning Intermodal netword (road and rail)
Menezes & Pizzolato (2014) p-median and maximal covering Public schools Ozceylan et al. (2017) p-Median and set covering problem Health services Pamucar et al. (2016) Greenp-median problem Urban logistic terminals Paul & MacDonald (2016) Location-allocation problem Distribution centers
Santos, Limbourg & Carreira (2015)
Location-allocation problem Inland intermodal terminals
Upchurch & Kubyb (2010) p-Median problem and flow-refueling model
Fuel stations
Wen et al. (2015) Location-allocation problem6 Facilities (e.g. warehouses)
Yu et al. (2013) Covering problem Transit hubs
Zahiri, Tavakkoli-Moghaddam & Pishvaee (2014)
Location-allocation problem Health services
Zhang et al. (2016) Location-allocation problem Health services Zu et al. (2016) Location-allocation problem Health services
Note: (1) Capacitated multi-facility; (2) Hierarchical multimodal; (3) Stochastic multi-period capacitated multiple
Table 2–Papers about facility location surveys.
Author Paper description
Alumur & Kara (2008) They review the literature on hub location models published from 1990 to 2001.
Arabani & Farahani (2012) They present an overview of classifications and applications of location problems, discussing the main static (covering and center problems, for example) and dynamic models (such as location-reallocation and time-dependent problems).
Campbell & O’Kelly (2012) They analyze the evolution of studies in this area, from 1986 to 2011.
Crainic & Laporte (1997) They present the transport planning models applied to differ-ent levels (strategic, tactical and operational), including location models.
Eskandarpour et al. (2015) They provide a literature review of papers about supply chain network design, involving mathematic models of coverage that include economic, environmental and/or social factors. Farahani, SteadieSeifi &
Asgari (2010)
They analyze multicriteria location problems (biobjective, mul-tiobjective and multi-attribute) and their solution methods. Farahani et al. (2012) They present a literature review specific of covering problem
models.
Farahani et al. (2013) They update the paper written by Alumur & Kara (2008) by analyzing, specifically, the studies about hub location problem published from 2007 (including the application of exact, heuris-tics and metaheurisheuris-tics methods).
Klose & Drexl (2005) They survey the facility location studies, contrasting continuous and discrete, capacitated and uncapacitated, single-source and multiple-souce, static and dynamic models.
Melo, Nickel &
Saldanha-da-Gama (2009)
They analyze papers about location-allocation applied to the lo-gistics context, especially the supply chain.
Table 2 shows papers dedicated to studying some classic models of facility location and in the later innovations presented in recent researches. However, only Eskandarpour et al. (2015) map the evolution of scientific production, although they do not focus on the specific analysis of location models (but on the design of the supply chain).
In this same context, Liu & Gui (2016) aims to understand the evolution of research in the Transport Geography area by investigating its scientific production (as proposed in this paper for the “location” theme). It was the only paper focusing in the transport area that applies a methodology similar to one performed in the present paper.
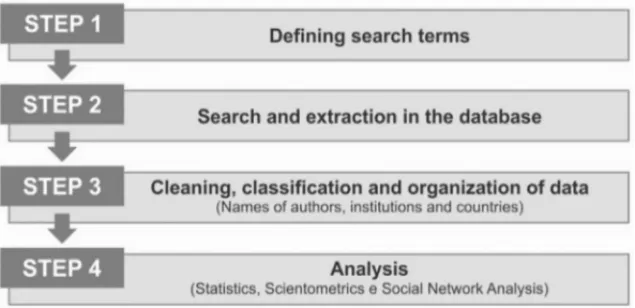
(Guimar˜aes et al., 2011). In order to identify the scientific production related to facility location topic, the articles registered in the Web of Science were analyzed. This database was chosen for having a satisfactory scope and coverage (Chen, 2010). In this context, the scientometric analysis followed the steps presented in Figure 1.
Figure 1–Steps of the research.
It should be noted that, in Step 1, the most adequate search terms were defined through a prelim-inary research in the papers considered as “benchmark” in this theme (presented in Section 2). The keywords selection may influence the results of the search, then, it is a crucial step. There-fore, the terms used, as well as the details for the search and extraction of the database (Step 2), are explicit in Table 3.
Table 3–Description of the search strategy.
Criteria Description
Topic1 TS = (“facilit* locatio*” OR “hub* locatio*” OR “p-median” OR “set covering proble*” OR “p-cent*” OR “maximal cover*”) AND CU = (“Brasil” OR “Brazil”)
Database Web of Science
Indexes SCI-EXPANDED2, SSCI3, A&HCI4, CPCI-S5, CPCI-SSH6, ESCI7 Coverage time All years until 2017
Data refinement None, which means that the search considered the publications of all areas registered in theWeb of Science
Date of search April 20th, 2018, at 9:30 a.m.
Notes: (1) TS = Topic, which means the words that will be searched in in the titles, abstracts and keywords
of articles. CU = country. Note that when searching for “CU”, we define the paper must have, at least, one
author affiliate to the specified country. Therefore, combining “TS AND CU” we gather the articles about
the theme published by authors filiated to Brazilian organizations; (2)Science Citation Index Expanded (SCI-EXPANDED) covers more than 8,300 journals in 150 different areas, with publications from 1990. (3)Social
Sciences Citation Index(SSCI) focus in social sciences, covering 2,950 publication sources, in over 50 areas,
since 1990. (4)Arts & Humanities Citation Index(A&HCI) is a citation index of Arts and Humanities area, covering over 1,600 publication sources, since 1975. (5) It covers the conference proceeding literature of all
technical and scientific fields. (6) It covers the conference proceeding literature of all fields of social science,
arts and humanities. (7) Covering publications from 2015, this index contains records of articles in journals not
covered by SCI-EXPANDED, SSCI and A&HCI yet (Thomson Reuters, 2016).
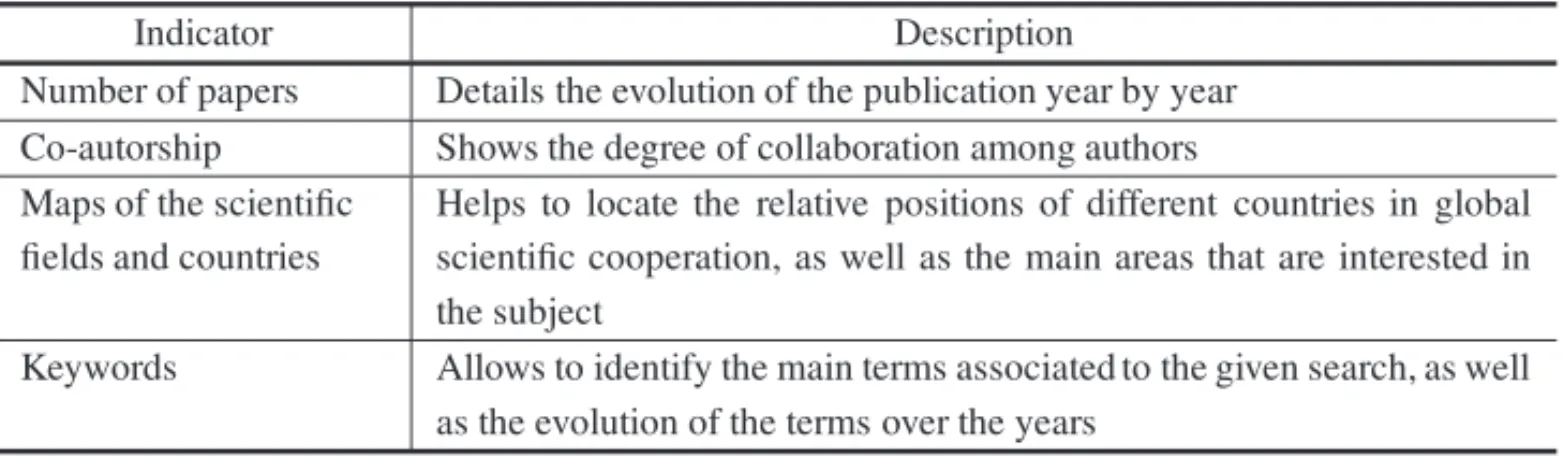
Table 4–Scientometrics indicators.
Indicator Description
Number of papers Details the evolution of the publication year by year Co-autorship Shows the degree of collaboration among authors Maps of the scientific
fields and countries
Helps to locate the relative positions of different countries in global scientific cooperation, as well as the main areas that are interested in the subject
Keywords Allows to identify the main terms associated to the given search, as well as the evolution of the terms over the years
4 DISCUSSION OF FINDINGS
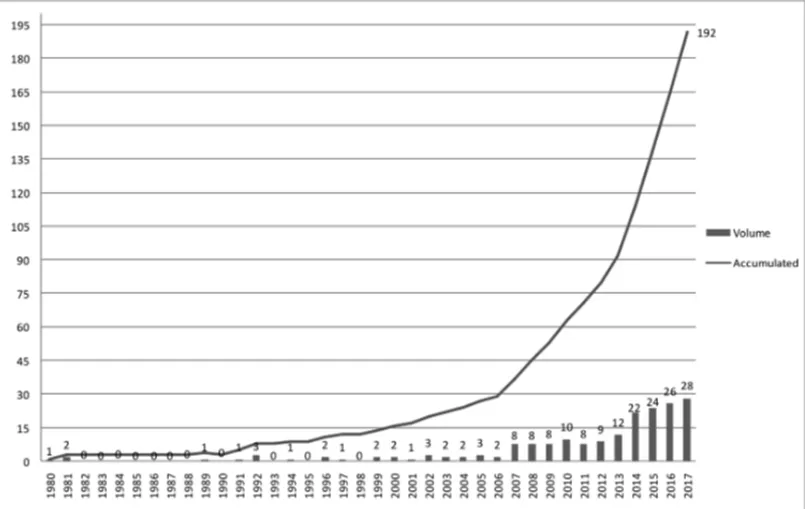
Figure 2–Evolution of publications about facility location – Brazilian context.
We verify that the first publication was registered in 1980 (12 years after the first international publication), but there was a constancy in publications only from 1999. There is an increase in interest on the topic since 2007. Although the Brazilian production in 2017 represents only approximately 0.34% of all international publications and 4.16% in 2017, this is the largest representation since 1989 when the international publication on the theme was restricted to 22 articles (of which 4.55% were Brazilian). Besides, the curve represents the crescent interest about the theme over the years.
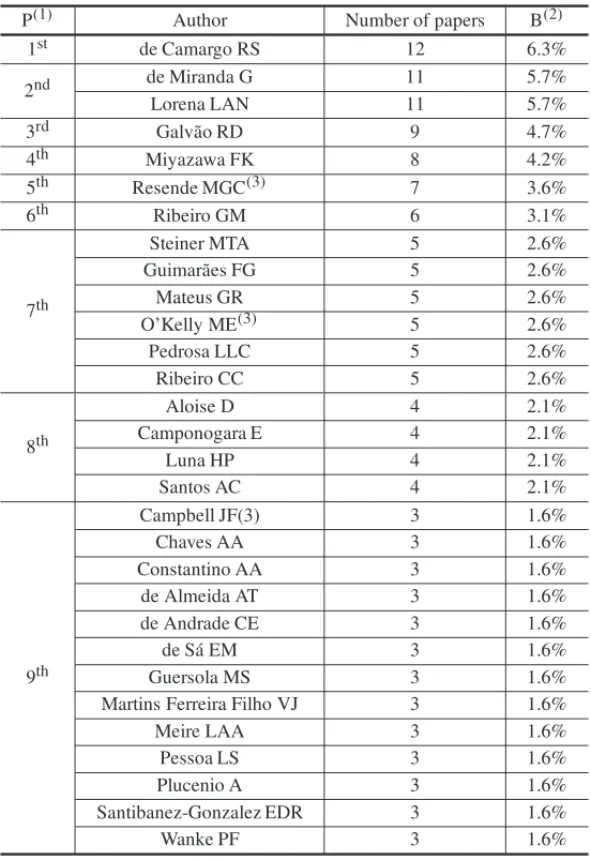
Regarding the main authors, Table 5 presents those whose publication volume is, at least, equal to three papers. It should be noted that, approximately 1,400 authors are listed in publications that have, at least, one author affiliated to Brazilian institutions.
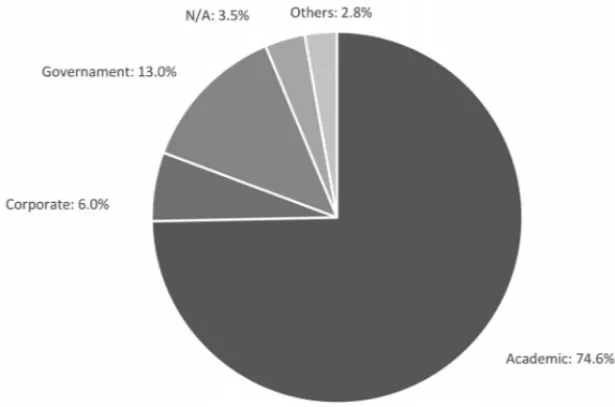
Regarding the main organizations, Figure 3 indicates that interest in the subject is predominantly academic (74.6%). However, government and corporate institutions represent 13% and 6% of publications, respectively. Table 6 presents the main organizations, whose publications are equal to or greater than five papers.
Table 5–Main authors related to papers filiated to Brazilian organizations.
P(1) Author Number of papers B(2)
1st de Camargo RS 12 6.3%
2nd de Miranda G 11 5.7%
Lorena LAN 11 5.7%
3rd Galv˜ao RD 9 4.7%
4th Miyazawa FK 8 4.2%
5th Resende MGC(3) 7 3.6%
6th Ribeiro GM 6 3.1%
7th
Steiner MTA 5 2.6%
Guimar˜aes FG 5 2.6%
Mateus GR 5 2.6%
O’Kelly ME(3) 5 2.6%
Pedrosa LLC 5 2.6%
Ribeiro CC 5 2.6%
8th
Aloise D 4 2.1%
Camponogara E 4 2.1%
Luna HP 4 2.1%
Santos AC 4 2.1%
9th
Campbell JF(3) 3 1.6%
Chaves AA 3 1.6%
Constantino AA 3 1.6%
de Almeida AT 3 1.6%
de Andrade CE 3 1.6%
de S´a EM 3 1.6%
Guersola MS 3 1.6%
Martins Ferreira Filho VJ 3 1.6%
Meire LAA 3 1.6%
Pessoa LS 3 1.6%
Plucenio A 3 1.6%
Santibanez-Gonzalez EDR 3 1.6%
Wanke PF 3 1.6%
Notes: (1) P represents the position of the authors in the ranking; (2) B indicates
the representativeness in relation to Brazilian production. The percentages are
not cumulative, since the same paper might be signed by different researchers;
(3) It is related to authors (Brazilian or not) affiliated to foreign universities who
have developed works in partnership with Brazilian researchers.
Figure 3–Distribution of the Brazilian publication by type of organization. Notes: “Others” are mainly related to international research institutes (asConseil Europ´een pour la Recherche Nucl´eaire– CERN), but
also include organizations that do not belong to other categories. “N/A” represets those that we could not identify the type (or whose registers were wrong, e.g. part of an address instead of the institutions’ name).
Table 6–Eighteen organizations with greater volume of publication.
Position Organizations Location Number of papers B 1st Univ. Fed. Minas Gerais – UFMG Southeast 36 18.8% 2nd Univ. Fed. Rio de Janeiro – UFRJ Southeast 24 12.5%
3rd Univ. S˜ao Paulo – USP Southeast 18 9.4%
4th Univ. Estadual Campinas – UNICAMP Southeast 17 8.9% 5th Univ. Fed. Santa Catarina – UFSC South 13 6.8% 6th Univ. Fed. Fluminense – UFF Southeast 11 5.7% 7th Natl. Inst. Space Res. – INPE Southeast 10 5.2%
8th Univ. Estadual Paulista – UNESP Southeast 9 4.7%
9th Univ. Fed. Goi´as – UFG Midwest 7 3.6%
Univ. Fed. Ouro Preto – UFOP Southeast 7 3.6%
10th
AT&T Labs. Res. International 6 3.1%
Ohio State Univ. International 6 3.1%
S˜ao Paulo Fed. Univ. – UNIFESP Southeast 6 3.1%
11th
Pontif´ıcia Univ. Cat´olica Parana – PUC-PR South 5 2.6% Pontif´ıcia Univ. Cat´olica Rio de Janeiro – PUC-RJ Southeast 5 2.6% Univ. Fed. Pernambuco – UFPE Northest 5 2.6% Univ. Fed. Rio Grande do Norte – UFRN Northest 5 2.6% Univ. Technol. Troyes International 5 2.6%
Note: (1) There were approximately 285 different organizations registered in Brazilian publications. The percentages
are not cumulative, since an article can have the affiliation of researchers from different institutions. (2) B indicates
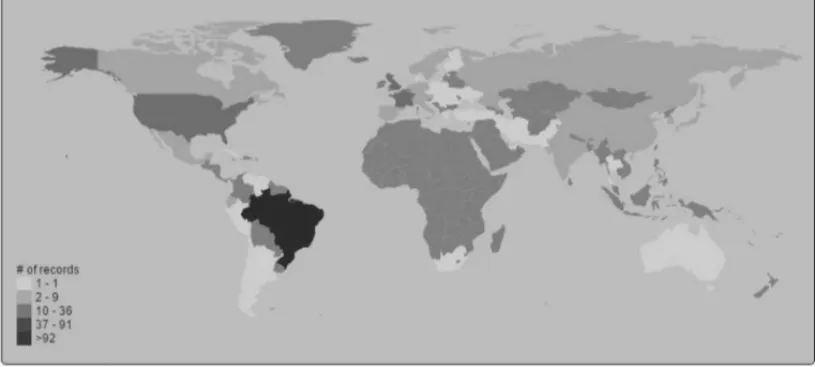
Thus, Figure 4 shows the countries with the largest joint publication with Brazil. First is USA with 35 joint papers, followed by United Kingdom with 14 and France with 12. Canada, Portugal and Germany have 8, 6 and 4 papers, respectively. China, Italy, Netherlands, Spain and Sweden have three joint articles, each; while Austria, Ecuador, India, Japan, Mexico, Norway, Russia, South Korea and Switzerland have two publications each.
Figure 4–Mapping of the intensity of Brazilian scientific production in international publications. Note: We highlight that nine papers did not have the country registrated in the database.
Besides, Figure 5 indicates the entire Brazilian network of relationships, involving 45 different countries. Once the evolution of Brazilian scientific production has been identified, as well as the main authors, organizations and countries that relates with the country, it is possible to verify the relations and cooperation network between authors, universities and countries. Figure 6 shows the collaboration network of the 88 authors with the highest publication volume (among those with at least 2 papers, each).
In Figure 6, it is possible to verify two consolidated networks, where one is formed by the two main authors (Miranda G and Camargo RS) and eight other researchers (including foreigners such as O’Kelly ME, Thizi JM and Campbell JF). It is noteworthy that the relationship between the two main authors is strong, and the 11 published papers have both listed in the authorship, explaining why they are the Brazilian references in the area. This network is well connected (al-though it is composed by fewer authors than the other one), since each researcher has connections with, at least, three other authors (except Thizi JM and Mateus GR).
Fi
gur
e
5
–
B
razi
l’
s
rel
at
ionshi
p
n
et
w
o
rk
w
it
h
ot
her
c
the highest volume of publication (with, at least, two papers each). It is verified that there is a dense and consolidated collaboration network that involves the academic institutions, as well as companies and government agency. From the first five organizations in Table 6, only UFSC is connected to just two institutions, one of them international (Univ. Technol. Troyes). There are also three universities that have no relationship with any other institution of this network: Univ. Fed. Rio Grande do Sul – UFRGS, Univ. Fed. Rural Semi ´Arido and Univ. Presbiteriana Mackenzie.
UFMG is one of the central nodes of this network, being connected to eitghteen organizations, ten of them foreing universities, one governamental agency and one company. It helps to explain its leadership in the volume of publication and show the level of internacionalization of the researches developed there. UFGM is strongly connected to Univ. Technol. Troyes, Ohio State Univ., Univ. Fed. Alagoas, UFOP and HEC Montreal.
Nevertheless, since that Figure 7 consolidates only the main organizations, we clarify that this university maintain more relationships than described in this figure. In addition, it can be seen that, from the five main organizations, only USP and UNICAMP are directly related. In this way, it is believed that there is more space for collaboration and, consequently, an increase in publications on the subject.
UFRJ, the 2ndin the ranking, is connected to nine organizations, three of them international universities and one company. USP is linked to nine instituitions, four of them international. Besides, its strogly related to UNICAMP, the 4thin the ranking. About UNICAMP, it is connected to ten organizations, two international companies and seven foreings universities.
Fi
gur
e
7
–
R
e
la
tio
n
sh
ip
n
e
tw
o
rk
o
f
th
e
m
a
in
o
rg
a
n
iz
a
tio
n
s
in
B
ra
z
ilia
n
publ
icat
versity and government can contribute to promote researches on the subject and to spread the scientific knowledge.
As for the main areas of interest (Table 7), we highlight publications in “Operations Research & Management Science”, “Computer Science”, “Engineering and Business & Economics”, with more than 30 papers each. “Transportation” appears in 6thposition, with 12 records.
Table 7–Main areas of interest in the theme facility location.
Position Research areas Number of papers 1st Operations Research & Management Science 78
2nd Computer Science 69
3rd Engineering 59
4th Business & Economics 31
5th Mathematics 24
6th Transportation 12
7th Environmental Science & Ecology 11 8th Science & Technology – Other Topics 8
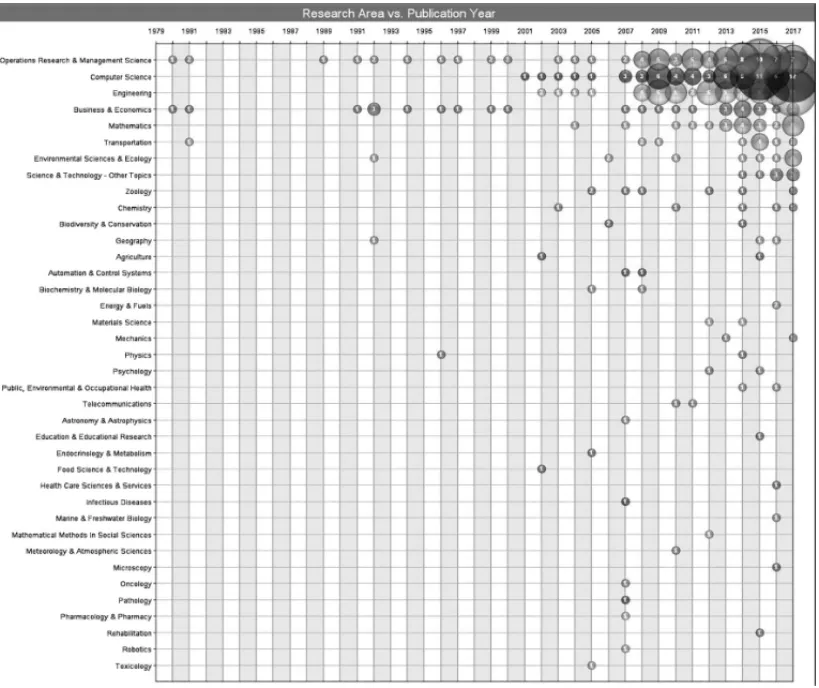
In a complementary way, Figure 8 shows the evolution of the publication areas per year. “Op-eration Research & Management Science” and “Business & Economics” were the first areas with publication, in 1980; followed by “Transportation” in 1981. From 1982 to 1988 there is no record of publications involving researchers with Brazilian affiliation. Only in 1989, new publi-cations were found in the area of “Operation Research & Management Science”. However, since 2007, there has been an intensification of research on the subject, with diversification of areas of interest.
Figure 8–Evolution of the Brazilian publications of the main areas per year.
2015 (with 4 papers). Besides, there is a recent interest in “Computer Science” and “Engineer-ing” areas, with an increasing volume of paper from 2008. They registered a superior amount of publication in 2017 than the 1stposition (12 and 11 articles respectively, against 7 for “Operation Research & Management Science”).
In addition to main areas interested in“facility location”, it is possible to identify the most cited articles, see Table 8. There are, among the top 10 ranking, eight of the main authors presented in Table 5, which reinforce them as the Brazilian references in the area. It is noted that Galv˜ao RD and Lorena LAN has, at least, two articles among the most cited ones.
6th De Miranda GJr; Luna HP
2008 capacitated multiple allocation hub location problem
35: 1047–1064 46
7th
Galv˜ao RD; Espejo LGA; Boffey B
2000
A comparison of Lagrangean and surrogate relaxations for the maxi-mal covering location problem
European Journal of Operational Research, 124: 377–389 40
8th Correa ES; Steiner MTA; Freitas AA; Carnieri C 2004
A genetic algorithm for solving a capacitatedp-median problem
Numerical Algorithms, 35: 373– 388
38
Lorena LAN;
Lopes F 1994
A surrogate heuristic for set cover-ing problems
European Journal of Operational Research, 79: 138–150 38
9th
Chiyoshi F;
Galv˜ao RD 2000
A statistical analysis of simulated annealing applied to the p-median problem
Annals of Operations Research, 96:
61–74 37
Lorena LAN;
Furtado JC 2001
Constructive genetic algorithm for clustering problems
Evolutionary Computation, 9(3): 3,
1–19 37 10th Marti R; Resende MGC; Ribeiro CC 2013
Multi-start methods for combinato-rial optimization
European Journal of Operational
Research, 226: 1–8 36
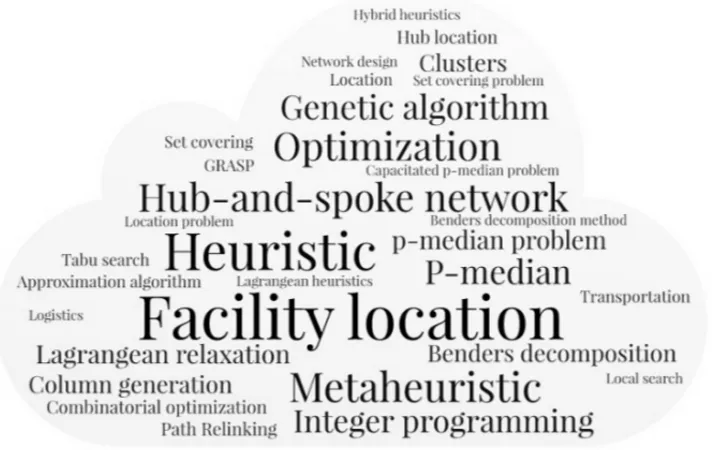
There are keywords associated to the solution techniques such as genetic algorithm, combina-torial optimization and GRASP, although the most relevant are facility location, heuristic and metaheuristic. It should be noted that only 24 keywords were associated, albeit indirectly, with the environmental theme with a mention each. They are: Atlantic forest, biodiversity conserva-tion, biodiversity knowledge, biogas, biomass burning, biomass energy, biomass supply opti-mization, carbon emissions, carbon footprint, climate change, climatic bias, conservation plan-ning, ecotoxicology, environmental niche models, gas emissions, green supply chain, municipal solid waste, recyclable materials, recycling, solid waste collection, solid waste legislation, solid waste management, water qualiy and waste management.
Figure 9–Main keywords of the Brazilian publications.
and environmental aspects in evaluations is the challenge of this area of research for the coming years. The explicit mention to “sustainability” appears only one time in the keywords list.
5 FINAL CONSIDERATIONS
The objectives of this paper were achieved since it was possible to identify the profile of the Brazilian scientific publications on facility location. Besides, it was possible to map the main authors and organizations that are interested in the subject, as well as the collaboration networks, countries and areas of study that stand out.
We noted that publications with Brazilian affiliations account for approximately 2% of the total database and the interest in “facility location” subject in the Brazilian context is recent, with recurrent records of publications starting in 1999. Nevertheless, the Brazilian volume of publi-cation puts the country among the 15 most relevante ones in the ranking considering the whole database, in front of developed countries such as Portugal and Switzerland.
We also verified that “facility location” is a theme of interest of the scientific community, with predominance of universities (74.6%), with emphasis on UFMG and UFRJ, with 36 and 24 papers, respectively. However, it is also of governamental (13%) and business interest (6%), as INPE and AT&T are among the eighteen main organizations that publish about this subject (Table 6).
verified that there were only 24 keywords associated to the environmental aspect. This indicates a knowledge gap to be filled in future studies (as already pointed out by Arabani & Farahani, 2012 and Farahani et al., 2013), which becomes even more relevant with the importance that the sustainability theme has today for all operations and production chains.
Therefore, for future studies, we recommend to investigate the papers that have keywords asso-ciated to the environmental theme (considering the complete database) aiming to propose math-ematical models that incorporate the environmental dimension with the economic one in the analysis of facility location. In addition, a specific scientometric analysis of these papers could be done in order to understand where the main authors and reference centers are located.
As a limitation, we mention that the study used only one database, not considering publications made in other databases such as Scielo and Scopus. In addition, it is important to highlight that the keywords might influence in the results, therefore, this findings are limited by the keywords chosen and by the database used.
ACKNOWLEDGMENTS
This research was partly supported by National Council for Scientific and Technological De-velopment (CNPq), Process 307835/2017-0, and by the Carlos Chagas Filho Research Support Foundation (FAPERJ), Process 203.231/2017. This support is gratefully acknowledged. We also thank the Coordination of Improvement of Higher Education Personnel (CAPES) for the doctoral scholarship.
REFERENCES
[1] ABYAZI-SANIR & GHANBARIR. 2016. An efficient tabu search for solving the uncapacitated single allocation hub location problem.Computers and Industrial Engineering,93: 99–109.https://
[2] ALIZADEHM, MAHDAVII, MAHDAVI-AMIRIN & SHIRIPOURS. 2015. A capacitated location-allocation problem with stochastic demands using sub-sources: An empirical study.Applied Soft Computing Journal,34: 551–571.https://doi.org/10.1016/j.asoc.2015.05.020.
[3] ALUMURSA, YAMANH & KARABY. 2012. Hierarchical multimodal hub location problem with time-definite deliveries.Transportation Research Part E: Logistics and Transportation Review,48(6): 1107–1120.https://doi.org/10.1016/j.tre.2012.04.001.
[4] ALUMURS & KARABY. 2008. Network hub location problems: The state of the art.European Jour-nal of OperatioJour-nal Research, 190(1): 1–21.https://doi.org/10.1016/j.ejor.2007.
06.008.
[5] ARABANIAB & FARAHANIRZ. 2012. Facility location dynamics: An overview of classifications and applications.Computers and Industrial Engineering,62(1): 408–420.https://doi.org/
10.1016/j.cie.2011.09.018.
[6] ARDJMANDE, YOUNGWA, WECKMANGR, BAJGIRANOS, AMINIPOURB & PARKN. 2016. Applying genetic algorithm to a new bi-objective stochastic model for transportation, location, and allocation of hazardous materials.Expert Systems with Applications,51: 49–58.https://doi.
org/10.1016/j.eswa.2015.12.036.
[7] BINILM, DINIZ-FILHOJAF, RANGELTFLVB, BASTOSRP & PINTOMP. 2006. Challenging Wallacean and Linnean shortfalls: Knowledge gradients and conservation planning in a biodiver-sity hotspot.Diversity and Distributions, 12(5): 475–482.https://doi.org/10.1111/j.
1366-9516.2006.00286.x.
[8] BORGATTISP, EVERETTMG & FREEMANLC. 2002. Ucinet for Windows: Software for Social Network Analysis. Harvard, MA: Analytic Technologies.
[9] CAMPBELLJF & O’KELLYME. 2012. Twenty-Five Years of Hub Location Research. Transporta-tion Science,46(2): 153–169.https://doi.org/10.1287/trsc.1120.0410.
[10] CHENX. 2010. The Declining Value of Subscription-based Abstracting and Indexing Services in the New Knowledge Dissemination Era.Serials Review,36(2): 79–85.https://doi.org/10.
1016/j.serrev.2010.02.010.
[11] CONFEDERAC¸ ˜AONACIONAL DOTRANSPORTE. 2014. Plano CNT de Transporte Log´ıstica. Bras´ılia.
[12] CORREIAI, NICKELS & SALDANHA-DA-GAMAF. 2017. A stochastic multi-period capacitated multiple allocation hub location problem: Formulation and inequalities R, 0, 1–13.https://doi.
org/10.1016/j.omega.2017.01.011.
[13] COUTINHO-RODRIGUESJ, TRALHAO˜ L & ALC¸ADA-ALMEIDAL. 2012. Solving a location-routing problem with a multiobjective approach: The design of urban evacuation plans.Journal of Transport Geography,22: 206–218.https://doi.org/10.1016/j.jtrangeo.2012.01.006.
[14] CRAINICTG & LAPORTEG. 1997. Planning models for freight transportation.European Journal of Operational Research,97(3): 409–438.https://doi.org/10.1016/S0377-2217(96)
00298-6.
[15] ESKANDARPOURM, DEJAXP, MIEMCZYKJ & P ´ETONO. 2015. Sustainable supply chain network design: An optimization-oriented review.Omega (United Kingdom),54: 11–32.https://doi.
measurement. A method and evidence from Brazil and Sweden.Socio-Economic Planning Sciences, 1–12.https://doi.org/10.1016/j.seps.2016.09.008.
[21] GELAREHS, MONEMIRN & NICKELS. 2015. Multi-period hub location problems in transporta-tion. Transportation Research Part E: Logistics and Transportation Review, 75: 67–94.https:
//doi.org/10.1016/j.tre.2014.12.016.
[22] GOVERNO DOESP´IRITOSANTO. 2009. Plano Estrat´egico de Log´ıstica e de Transportes do Estado do Esp´ırito Santo – PELT/ES.
[23] GOVERNO DORIO DEJANEIRO. 2013. Plano Estadual de Log´ıstica de Carga do Estado do Rio de Janeiro – PELC/RJ.
[24] GREGOLIN J ˆAR, HOFFMANNWAM, DE FARIA LIL, QUONIAM L, QUEYRAS J, FRATUCCI
LFDA & CESARGA. 2005. An´alise da produc¸˜ao cient´ıfica a partir de indicadores bibliom´etricos. Indicadores de Ciˆencia, Tecnologia e Inovac¸˜ao em S˜ao Paulo 2004, 5.
[25] GUIMARAES˜ VA, MOTTA GS, ARMOND-DE-MELO DR, QUINTELLA RH & OLIVEIRA MA. 2011. O Processo de Inovac¸˜ao Brasileiro: Um Estudo de Caso. In: Congresso de Administrac¸˜ao, Inovac¸˜ao e Sociedade (pp. 1–16).
[26] GUIMARAES˜ VA, RIBEIROGM, DO FORTEVL, LUCENAA, LEITAO˜ JUNIORAM, PEREIRA
LCSN & FORNACIARI FA. 2017a. Localizac¸˜ao-alocac¸˜ao de centros de integrac¸˜ao log´ıstica submetidos a demandas par-a-par. Transportes, 25(1): 51. https://doi.org/10.14295/
transportes.v25i1.1027.
[27] GUIMARAES˜ VA, RIBEIROGM, FORTEVL & LUCENAA. 2017b. A location-allocation model for logistics integration centers.International Journal of Transport Economics,XLIV(2): 273–291.
[28] HAJIPOURV, FATTAHIP, TAVANAM & DICAPRIO D. 2016. Multi-objective multi-layer con-gested facility location-allocation problem optimization with Pareto-based meta-heuristics.Applied Mathematical Modelling,40(7-8): 4948–4969.https://doi.org/10.1016/j.apm.2015.
12.013.
[30] HARRISI, MUMFORDCL & NAIMMM. 2014. A hybrid multi-objective approach to capacitated facility location with flexible store allocation for green logistics modeling.Transportation Research Part E: Logistics and Transportation Review,66: 1–22.https://doi.org/10.1016/j.tre.
2014.01.010.
[31] HE Y, WUT, ZHANGC & LIANG Z. 2015. An improved MIP heuristic for the intermodal hub location problem.Omega,57: 203–211.
[32] ISHFAQ R & SOX CR. 2011. Hub location-allocation in intermodal logistic networks.European Journal of Operational Research,210(2): 213–230.https://doi.org/10.1016/j.ejor.
2010.09.017.
[33] KLOSEA & DREXLA. 2005. Facility location models for distribution system design.European Jour-nal of OperatioJour-nal Research, 162(1): 4–29.https://doi.org/10.1016/j.ejor.2003.
10.031.
[34] LIN CC, CHIANGYI & LIN SW. 2014. Efficient model and heuristic for the intermodal termi-nal location problem.Computers and Operations Research,51: 41–51.https://doi.org/10.
1016/j.cor.2014.05.004.
[35] LINCC & LINSW. 2016. Two-stage approach to the intermodal terminal location problem. Com-puters and Operations Research,67: 113–119.https://doi.org/10.1016/j.cor.2015.
09.009.
[36] LIU C & GUIQ. 2016. Mapping intellectual structures and dynamics of transport geography re-search: a scientometric overview from 1982 to 2014.Scientometrics, 109(1): 159–184.https:
//doi.org/10.1007/s11192-016-2045-8.
[37] LOIOLAEM,DE ABREUNMM, BOAVENTURA-NETTOPO, HAHN P & QUERIDOT. 2007. A survey for the quadratic assignment problem.European Journal of Operational Research,176(2): 657–690.https://doi.org/10.1016/j.ejor.2005.09.032.
[38] LORENALAN & SENNEELF. 2004. A column generation approach to capacitated p-median prob-lems.Computers and Operations Research, 31(6): 863–876.https://doi.org/10.1016/
S0305-0548(03)00039-X.
[39] LORENALAN & FURTADOJC. 2001. Constructive Genetic Algorithm for Clustering Problems. Evolutionary Computation,9(3), 309327. https://doi.org/10.1162/106365601750406019
[40] MEISELF, KIRSCHSTEINT & BIERWIRTHC. 2013. Integrated production and intermodal trans-portation planning in large scale production-distribution-networks.Transportation Research Part E: Logistics and Transportation Review, 60: 62–78. https://doi.org/10.1016/j.tre.
2013.10.003.
[41] MELO MT, NICKEL S & SALDANHA-DA-GAMA F. 2009. Facility location and supply chain management – A review.European Journal of Operational Research,196(2): 401–412.https:
//doi.org/10.1016/j.ejor.2008.05.007.
[42] MENEZESRC & PIZZOLATOND. 2014. Locating public schools in fast expanding areas: application of the capacitated p-median and maximal covering location models.Pesquisa Operacional,34(2): 301–317.https://dx.doi.org/10.1590/0101-7438.2014.034.02.0301.
https://doi.org/10.1016/j.ejor.2015.10.028.
[50] SANTOSBF, LIMBOURGS & CARREIRAJS. 2015. The impact of transport policies on railroad in-termodal freight competitiveness – The case of Belgium.Transportation Research Part D: Transport and Environment,34: 230–244.https://doi.org/10.1016/j.trd.2014.10.015.
[51] SPNT – SECRETARIA DEPOL´ITICANACIONAL DETRANSPORTES. 2016. Centros de integrac¸˜ao log´ıstica.
[52] TAGUL. 2017. Word Cloud. Available at:https://wordart.com/create.
[53] THE VANTAGE POINT. 2016. Vantage Point – Version 9. Search Technology, Inc. (www.
theVantagePoint.com)
[54] THOMSONREUTERS. 2016. Web of ScienceTMTodas as bases de dados.
[55] ULUKANZ & DEMIRCIOGLUˇ E. 2015. A Survey of Discrete Facility Location Problems. Interna-tional Journal of Social, Behavioral, EducaInterna-tional, Economic, Business and Industrial Engineering,
9(7): 2450–2455.
[56] UPCHURCHC & KUBYM. 2010. Comparing the p-median and flow-refueling models for locating alternative-fuel stations.Journal of Transport Geography,18(6): 750–758.https://doi.org/
10.1016/j.jtrangeo.2010.06.015.
[57] WENM, QINZ, KANGR & YANGY. 2015. The capacitated facility location-allocation problem under uncertain environment.Journal of Intelligent and Fuzzy Systems,29(5): 2217–2226.https:
//doi.org/10.3233/IFS-151697.
[58] YUB, ZHUH, CAIW, MAN, KUANGQ & YAOB. 2013. Two-phase optimization approach to transit hub location – the case of Dalian.Journal of Transport Geography,33: 62–71.https:
//doi.org/10.1016/j.jtrangeo.2013.09.008.
[59] ZAHIRIB, TAVAKKOLI-MOGHADDAMR & PISHVAEEMS. 2014. A robust possibilistic program-ming approach to multi-period location-allocation of organ transplant centers under uncertainty. Com-puters and Industrial Engineering, 74(1): 139–148.https://doi.org/10.1016/j.cie.
[60] ZHANG W, CAO K, LIU S & HUANG B. 2016. A multi-objective optimization approach for health-care facility location-allocation problems in highly developed cities such as Hong Kong. Computers, Environment and Urban Systems,59: 220–230.https://doi.org/10.1016/j.
compenvurbsys.2016.07.001.
[61] ZHU Y, DUQ, TIANF, REN F, LIANGS & CHENY. 2016. Location Optimization Using a Hi-erarchical Location-Allocation Model for Trauma Centers in Shenzhen, China.ISPRS International