ABSTRACT
RESUMO
Submitted on 12/18/2014 and approved on 10/27/2015. 1 This paper is part of the first author’s doctorate thesis.
2 Universidade Regional Integrada do Alto Uruguai e das Missões, Departamento de Ciências Agrárias, Erechim, Rio Grande do Sul, Brasil. [email protected] 3 Universidade Federal de Santa Maria, Departamento de Solos, Santa Maria, Rio Grande do Sul, Brasil. [email protected]
4 Universidade de Cruz Alta, Centro de Ciências da Saúde e Agrárias, Cruz Alta, Rio Grande do Sul, Brasil. [email protected]
* Corresponding author: [email protected]
Use efficiency of variable rate of nitrogen prescribed
by optical sensor in corn
1The efficiency of nitrogen fertilizer in corn is usually low, negatively affecting plant nutrition, the economic return, and the environment. In this context, a variable rate of nitrogen, prescribed by crop sensors, has been proposed as an alternative to the uniform rate of nitrogen traditionally used by farmers. This study tested the hypothesis that variable rate of nitrogen, prescribed by optical sensor, increases the nitrogen use efficiency and grain yield as compared to uniform rate of nitrogen. The following treatments were evaluated: 0; 70; 140; and 210 kg ha-1 under uniform rate of
nitrogen, and 140 kg ha-1 under variable rate of nitrogen. The nitrogen source was urea applied on the soil surface using
a distributor equipped with the crop sensor. In this study, the grain yield ranged from 10.2 to 15.5 Mg ha-1, with linear
response to nitrogen rates. The variable rate of nitrogen increased by 11.8 and 32.6% the nitrogen uptake and nitrogen use efficiency, respectively, compared to the uniform rate of nitrogen. However, no significant increase in grain yield was observed, indicating that the major benefit of the variable rate of nitrogen was reducing the risk of environmental impact of fertilizer.
Key words: site-specific management, crop sensor, precision agriculture, soil fertility.
Jardes Bragagnolo2, Telmo Jorge Carneiro Amado3, Rafael Pivotto Bortolotto4*
10.1590/0034-737X201663010014
Eficiência de uso da dose variada de nitrogênio prescrita por sensor óptico em milho
A eficiência da fertilização nitrogenada no milho geralmente é baixa, impactando negativamente a nutrição de plan-tas, o retorno econômico e o meio ambiente. A dose variada de nitrogênio, prescrita por sensores de planta, tem sido proposta em substituição à dose uniforme de nitrogênio tradicionalmente utilizada pelos agricultores. Este estudo tes-tou a hipótese de que a dose variável de nitrogênio, baseada no sensor óptico, aumenta a eficiência de uso do nitrogê-nio e a produtividade de grãos em relação à dose variável de nitrogênitrogê-nio. Os seguintes tratamentos foram avaliados: 0, 70, 140 e 210 kg ha-1 a dose uniforme de nitrogênio e 140 kg ha-1 a dose variável de nitrogênio. A fonte de N foi ureia
aplicada a lanço com um distribuidor de fertilizantes acoplado ao sensor óptico de plantas. Neste estudo, a produtivi-dade de grãos variou de 10,2 a 15,5 Mg ha-1, com resposta linear às doses de nitrogênio. A dose variável de nitrogênio
proporcionou aumento de 11,8 e 32,6% na quantidade de nitrogênio absorvido e na eficiência de uso do nitrogênio, respectivamente, em comparação à dose uniforme de nitrogênio. Porém, o incremento na produtividade não foi signi-ficativo, indicando que o principal efeito da dose variada de nitrogênio foi a redução do risco de impacto ambiental do fertilizante.
INTRODUCTION
Corn (Zea mays L.) is the main cereal grown in Brazil, with an area over 15 million ha. In the 2013/14 crop season, the Brazilian corn production reached 79.9 million tons (CONAB, 2014), representing an increase in production of 3% per year in the last decade, while cropland had just a slight increase (0.4%) (Miranda et al., 2012). Therefore, the recent increase in Brazilian corn production was mainly associated with yield gain, reflecting the improvement in crop management, especially nitrogen (N) fertilization management.
Increasing the rate of N fertilization, may intensify the environmental impact, since N fertilization efficiency worldwide is low and stood around 33% (Raun & Johnson, 1999). Currently, in southern Brazil, N fertilization recommendation is based on the content of soil organic matter (SOM), yield goal, and previous cash crop or cover crop in the field (Amado et al., 2002). However, the spatial variability of soil properties that enhance the availability of N to plants, such as, SOM (Casa et al., 2011), soil nitrate (Hurtado et al., 2009; Casa et al., 2011), and soil water storage (Santi et al., 2012), are not taken into consideration. Thus, the same field may have different optimum N fertilization rates (Raun et al., 2002; Portz et al., 2012) and, in such case, suggesting that uniform rate of N (URN) could not properly fit for the whole area, resulting in under or overfertilized areas (Hurtado et al., 2009; Nogara Neto et al., 2011). Therefore, the spatial variability of soil and plant attributes in the field are challenges to obtain high N use efficiency (NUE) and crop yield.
The variable rate of N (VRN) adjusts the fertilizer input according to the plant nutritional status. In this case, one most frequently used fertilizer prescription is increasing the N rate in plants with low nutritional status, where there is a higher probability of response to the input. This strategy commonly results in NUE optimization (Raun et al., 2005; Singh et al., 2006, Bragagnolo et al., 2013b). In addition, the VRN can promote increases in plant N uptake and, consequently, reduces the risk of N losses by leaching, runoff, and volatilization (Fixen et al., 2005).
The crop sensors, based on optical spectroscopy, use the principle of reflectance in wavelengths of the visible and near infrared spectrum on the leaf tissues of the plants and can be used for the N fertilization prescription (Raun
et al., 2005; Povh et al., 2008; Grohs et al., 2009; Jasper et
al., 2009; Amaral & Molin, 2011; Portz et al., 2012; Bragagnolo et al., 2013a, b).
In Brazil, the information about the use of crop sensors in N fertilization is scarce. This study tested the hypothesis that the use of the optical spectroscopy sensor increases the efficiency of corn N fertilization. The specific objectives were: a) to evaluate the efficiency of the sensor
to capture the corn nutritional status in different growth stages; and b) to compare NUE and corn grain yield under VRN and URN fertilization strategies.
MATERIAL AND METHODS
The experimental area has coordinates 28 31’36" S and 52 47’ 45"W, with 550 m altitude, in Não-Me-Toque county, RS, Brazil. The climate is Cfa, humid subtropical, according to Koppen (1948) classification, with frequent incidences of short drought during the summer. The average rainfall is 1700 mm yr-1 evenly distributed through the year, with
an average annual temperature of 19.5 ºC.
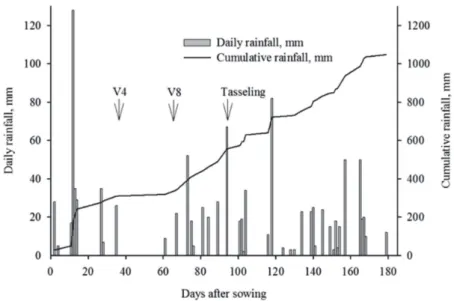
This study was conducted in a rainfed cropland in 2010/2011 that had favorable conditions of precipitation during corn growth period, with a total volume of 1048 mm and even distribution (Figure 1).
The soil of the experimental area is a distrophic Red Oxisol (Typic Hapludox) (Soil Survey Staff, 2010) or Latossolo Vermelho distrófico (Embrapa, 2006), with gentle slopes. Prior to the establishment of this experiment, the area was managed under a continuous no-till system for fifteen years. The particle size and chemical soil characteristics in the beginning of the experiment are shown in Table 1.
Corn was sown on September 10th, 2010, on oat straw
residue, with spacing 0.50 m. Pioneer hybrid 30F53 corn was used with an estimated plant population of 67,000 ha -1. The fertilization at planting consisted of 30 kg ha-1 of N,
78 kg ha-1 of P
2O2, and 69 kg ha -1 of K
2O. The source of N
was urea (45% of N), for phosphorus (P), it was triple superphosphate (21% of P2O5), and for potassium (K) potassium chloride (60% of K2O) was used.
The experiment was in a randomized block design with three replications, with treatments arranged in linear strips. The plots had dimensions of 36 x 300 m with a total expe-rimental area of 10,800 m2. The treatments consisted of
the following rates of N and fertilization strategies: 1) 0 kg ha-1 (control); 2) 70 kg ha-1 uniform rate (70URN); 3) 140 kg
ha-1 uniform rate (140URN); 4) 140 kg ha-1 variable rate,
based on crop sensor (140VRN); and 5) 210 kg ha-1 uniform
rate (210URN). Urea was applied by a distributor equipped with double disk centrifuge under conditions of high soil moisture. The N rate selected to compare the fertilization strategies of URN and VRN (140 kg ha-1) was recommended
regionally (CQFS-RS/SC, 2004) for an expected yield between 8-9 Mg ha-1, for soils with 2.6 to 5.0% levels of
SOM with previous grasse cultivation.
The N fertilizer treatments with rates higher than 70 kg ha-1 were split into three applications as follows: 30 kg ha -1 at planting; 40 kg ha-1 applied at V4 corn stage with four
fully expanded leaves, using the Zadoks Scale; 70 kg ha -1 (140URN and 140VRN) and 140 kg ha-1 (210URN) applied
The plant attributes evaluated, in the phenological stages V4, V6, V8, V10, V12, and tasseling (VT), were: N content of aboveground biomass, total N uptake, dry matter (DM) yield, SPAD index, and vegetation index (VI) determined by the optical sensor. For the plant samples, a transect with seven georeferenced points, with regular spacing of 40 m, was used. In order to determine the DM production, plants were harvested within a 2 m radius around the georeferenced point. The determination of plant N content was made by micro Kjeldahl digestion, according to the methodology described in Tedesco et al.
(1995). For SPAD index was used five plants per georeferenced point, according to the methodology described by Argenta et al. (2001).
In treatment 140VRN, based on VI determined with the optical sensor, the rate of N fertilizer was established by means of a YARA algorithm (Yara International ASA, Duelmen, Germany). The ensemble fertilizer distributor and crop sensor comprised of two optical sensors attached to the top of the tractor cabin (right and left side), at approximately 3.8 m above the ground, making the reading of an area with a width of 3.0 m on each side of the tractor, allowing the device to read approximately 33% of the plants present in the experiment. The angle formed by light beam from the xenon transmitter and soil surface was between 50 to 66º.
The optical sensor xenon transmitters comprised of multispectral waves (650 to 1100 nm) of high intensity, and has two photodiode receptors used to determine the VI, based on the ratio of the spectral reflectance in the wavelengths 730 and 760 nm calculated by equation (1) (Jasper et al., 2009):
VI = (ln R760 - ln R730) x 100 (1)
Where: VI is the vegetation index; R760 is the reflectance at wavelength 760 nm; R730 is the reflectance at wavelength 730 nm.
In treatment 140VRN, the fertilizer was applied dividing into two phases. The first was carried out to determine the average VI (64.7) of the plants in the area at V8 crop stage, for which a reference N rate of 70 kg ha-1 was
assigned. Then, at the second phase, a new determination of VI and a real-time N prescription rate was transmitted to the controller and in sequence to the centrifugal distributor disks for fertilizer application. The fertilizer distribution width was set to 21 m, with 3 m of overlap between the two passes of the equipment, totalizing 36 m of plot width.
The data obtained from the optical sensor were transferred to a geographical information system (Campeiro 7.0, Giotto, 2011). Afterwards, the average VI readings and the prescribed N rate were determined in a
Figure 1: Daily and cumulative rainfall during the corn cycle in the 2010/2011 harvest. *V4= corn phenological stage with four fully expanded leaves using the Zadoks Scale; V8= corn phenological stage with eight fully expanded leaves using the Zadoks Scale.
Table 1: Analysis of particle size and chemical characteristics of the soil in the experimental area of the 0-0.10 m layer
Clay1 pH H
2O
2 SOM3 P4 K4 Al5 Ca5 Mg5 CTC
g kg-1 % mg dm-3 cmol
c dm -3
550 5.8 3.8 12.3 0,64 0.0 7.0 2.2 14.0
1Determined by densitometry; 2determined by potentiometric; 3soil organic matter determined by the Walkley-Black method; 4determined
radius of 10 m around each georeferenced point of the transect. For the evaluation of the efficiency of the prescribed N rates, the following classification was used: low (64.5 ± 2.2 kg ha-1), medium (70.4 ± 0.3 kg ha-1), and
high (78.1 ± 4.0 kg ha-1), with four replications per class.
Data for corn grain yield were obtained by manual harvesting of two rows with two linear meters (2 m2) around
each georeferenced point of the transect. Each plot was harvested separately with the MF 34® combine equipped
with a yield sensor, and the total plot grain yield was weighted separately. The grain yield results were adjusted to 13.0% moisture.
To determine the NUE, the formula for N recovery efficiency (NRE) and N agronomic efficiency (NAE) were used according to the methodology described in equation (2) and (3) according to Cassman et al. (2002) and Dobermann (2005):
NRE = (NN - N0) / RN (2)
Where: NN is N uptake at flowering (kg ha-1) under the
evaluated N rate; N0 is N uptake at flowering (kg ha-1)
under the control treatment (without N); RN is the evaluated N rate (kg ha-1).
NAE = (YN - Y0) / RN (3)
Where: YN is corn grain yield (kg ha-1) of treatment with
the tested rate; Y0 is corn grain yield (kg ha-1) of control
treatment (without N); RN is the evaluated N rate (kg ha-1).
The determination of gross income, for every 60 kg bag of corn, was worth R$ 25.00 at the time of harvest (COTRIJAL, 2011).
The experimental results were submitted to descriptive analysis of variance. The averages were compared by the Tukey test (P < 0.05), followed by polynomial regression using the statistical package SISVAR 4.0 (Ferreira, 2000).
RESULTS AND DISCUSSION
The plant attributes related to N nutritional status of corn, assessed at VT, were directly related to the rate of N fertilizer, providing the increased N content, N uptake, the SPAD Index, VI determined by the optical sensor, and corn grain yield, as expected. However, the DM yield did not show correlation with corn grain yield (Table 2).
This was an important prerequisite for evaluating the crop sensor and VRN efficiency. Therefore, the treatment with the highest N rate (210URN) increased by 56% the plant N uptake and by 50% the plant N content, which is important for cell division and expansion, besides being the main component for the chlorophyll molecules responsible for photosynthesis, driving the plant accumulation of carbohydrates and plant growth (Malavolta, 1997; Lobell, 2007).
The control treatment, although without N fertilizer input, had high N uptake (117 kg ha-1) and corn DM yield
(10.1 Mg ha-1) (Table 2). This result is associated with
continuous no-till with cover crops and crop rotation adopted in this cropland for the last 15 years, with the favorable climatic conditions for corn growth (Figure 1). Therefore, even the control treatment achieved a high grain yield (10.2 Mg ha-1) (Table 2). Previously, Lázaro et al.
(2013), in southern Brazil, also reported that even without N fertilizer input, under favorable climatic conditions and good management practices, the grain yield achieved 10 Mg ha-1.
The N content of the plant, at VT corn stage, regardless of treatment, fell within or above the range considered critical (1.0 to 1.3%) (Amado et al., 2002). However, the highest grain yield was obtained with N content of plants ranging from 1.6 to 1.8%, therefore higher than those considered critical (Table 2).
The SPAD Index presents a positive linear relationship with the N rates (Table 2), agreeing with the report by Jakelaitis et al. (2005). Only the control and 70URN treatments showed, at VT stage, the SPAD index the value 57.1 proposed as critical by Argenta et al. (2004). However, the highest grain yield (15.6 Mg ha-1) was achieved with
SPAD index (59.4) slightly higher than the critical value. The N fertilization rate had an influence on the nitrogen content of the plant and on grain yield with linear effect first-degree up to 210 kg ha-1, indicating that if higher N
rates were investigated, it could still have an increase in grain yield (Table 2). The treatment with the highest N rate (210URN) showed an increase of 5.3 Mg ha-1 (52.0%)
in grain yield compared to the control (Table 2). The high response to N fertilization, can be partly attributed to the favorable climatic conditions for corn growth, expressed by the satisfactory precipitation in critical growth stages (Figure 1), abundant light, and cool nights, in addition to soil quality (Table 1) and a hybrid corn with high yield potential.
The efficiency of VRN fertilizer strategy depends, among other factors, on the capacity of the crop sensor to capture, in an early development stage, the different nutritional status of corn plants in the cropland.
In Figure 2a and b, it can be observed that VI increased exponentially as a function of both the amount of N uptake and the corn DM yield, and that at the advanced crop growth stages there was a sensibility loss in the sensor
(saturation effect). In this study, the saturation effect was intensified when the amount of plant N uptake was higher than 70 kg ha-1 and the corn DM yield exceeded 2,500 kg
ha-1, corresponding either to V10 or to more advanced
Table 2: Plant attributes evaluated at the tasseling stage of corn for nitrogen fertilizer treatments
Treatments N content N uptake DM SPAD Grain yield
% kg ha-1 kg ha-1 kg ha-1
T 1.2 d 117.0 c 10.11 ab 51.2 d 10.231 c
70 URN 1.3 c 109.9 c 8.76 c 54.5 c 11.125 c
140 URN 1.6 b 163.3 b 10.42 a 57.1 b 13.743 b
140 VRN 1.7 ab 182.6 a 10.18 ab 57.5 ab 14.887 ab
210 URN 1.8 a 177.2 ab 9.56 ab 59.4 a 15.564 a
Equation y = 1.17 + 0.003x y = 108.99 + 0.366x n s y = 51.52+ 0.039x y = 9.97 + 28.01x
R2 0.91 0.64 n s 0.98 0.91
P 0.0076 0.0496 n s 0.0006 0.0104
Averages followed by the same letter in the column do not differ by Tukey test at 5% probability; ns = not significant; T = 0 kg ha-1 N; URN
= Uniform rate of N; VRN = Variable rate of N; R2= Coefficient of determination; P= level of significance calculated by t test; DM= Dry
matter; SPAD= SPAD index; N content (%)= N content in plant tissue; N uptake kg ha-1 = N in dry matter; SD = Standard Deviation; Grain
yield= corn grain yield manually collected from 2 m of rows.
crop growth stages. Previously, Portz et al. (2012) reported the saturation effect of this optical sensor in sugarcane, when the amount of plant N uptake was higher than 40 kg ha-1 and the sugarcane DM yield was higher than 4,000 kg
ha-1. The saturation effect has also been reported for other
types of crop sensors based on the optical spectrometry (Grohs et al., 2009; Portz et al., 2012).
Based on the VI readings of the optical sensor and the sampling of plants made at V8 crop stage, at each point of the transect (Figure 2c, d), the regression between the VI readings and the prescribed N rate was established (Figu-re 2c). In this case, the VRN ranged from 62 to 84 kg ha-1,
according to the corn N nutritional status (Figure 2c), while the N uptake by plants ranged from 36.7 to 52.5 kg ha-1 and the DM yield from 1,270 to 1,916 kg ha-1.
Thus, plants that had lower VI were associated with N deficiency and lower DM yield, consequently, with a higher probability of response to fertilizer input, justifying this increase in N rate relative to the reference N rate (70 kg ha -1) for that phenological crop stage. In contrast, plants
with higher VI, indicated plants well supplied with N and with high DM yield (Figure 2c, d), and, therefore, less likely to respond to N fertilization, justifying the reduction in the reference N rate.
Previously, Mayfield & Trengove (2009) reported that for a reference N rate of 33 kg ha-1 in wheat, the prescribed
N rates were in the range of 20 to 52 kg ha-1, while the
plant N uptake ranged from 69 to 118 kg ha-1, and DM
yield from 1,510 to 3,050 kg ha-1.
In this study, only 9.7% of the prescribed N rates by the crop sensor coincided with the reference N rate, while 36.9% of the prescribed N rates were lower than the reference and 53.4% were higher (Figure 2d). Repetition 3 had the lowest VI readings (Figure 2c, d) and, in that case, had a higher frequency of prescribed N rates above the reference N rate. On the other hand, in repetition 2, after 160 m, there was a higher frequency of N rates below the reference N rate indicating the plot variability. Generally, in this study, the spatial variability, up to half the length of the plots, was lower than the rest of the plot, indicating that besides capturing differences among the replications, the sensor captured differences within the same repetition. The spatial variability of the corn N nutritional status captured by the optical sensor is attributed to the intrinsic characteristics of the soil, microclimate, slope, and site-specific management that affect crop development (Mayfield & Trengove, 2009; Jorgensen & Jorgensen, 2007).
A comparison of the fertilization strategies, URN and VRN, was based on the results shown in Table 2. The treatment, with VRN, had the plant N content, N uptake, and grain yield (manual harvesting at the transect points) increased numerically by 6.3, 11.3, and 8.3%, respectively,
in relation to URN, although statistically was significant only for the N uptake between the fertilization strategies. Moreover, the VRN increased the NRE (equation 3) by approximately 14% compared to URN. The 140VRN, among all treatments investigated, provided the highest N uptake (182.6 kg ha-1), however, not statistically differing from
the 210URN treatment, which received an N rate 50% higher. This result is relevant, since the primary goal of fertilization is to increase the plant N uptake. Thus, the infield redistribution of N fertilizer rates, based on the spatial variability of the plant nutritional N status captured by the optical sensor, combined with a prescription of higher N rates to the plants with lower VI, was an effective strategy to increase the corn N uptake and NRE (Table 2). In this study, VRN had a numerical increase in grain yield of 1,144 kg ha-1 (manual harvesting) in relation to URN,
although, without statistical difference.
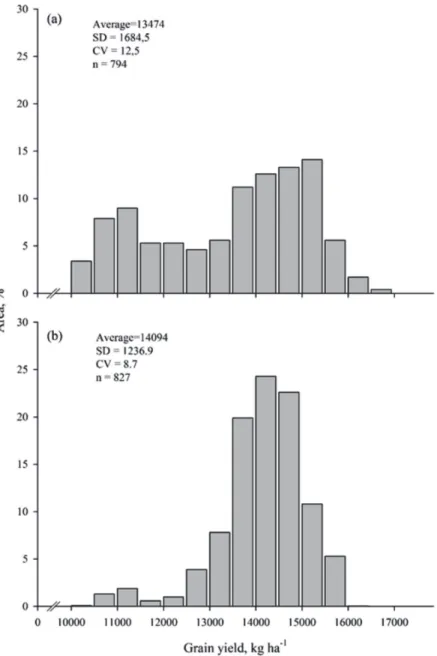
The histograms of the grain yield distribution, are shown in Figure 3a and b. It was observed that the VRN promoted higher uniformity in corn grain yield, with reductions of 27 and 30% in standard deviations (SD) and coefficient of variation (CV), respectively, compared to URN.
The frequency of grain yield < 12 Mg ha-1 was higher
in URN than in VRN (Figure 3a, b). This result suggests that increasing N rates in plants with lower VI was an efficient strategy for correcting the poor nutritional N status of the corn diagnosed at V8 stage (Figure 2c). Moreover, the occurrence of over fertilized plants under URN treatment resulted in a 22% increase in the frequency of grain yield > 15 Mg ha-1 compared to those under VRN.
On the other hand, the fertilizer strategy of VRN resulted in an asymmetric distribution frequency of the grain yield classes with frequency concentration on the right side of the Figure, with an increase of 70% in the frequency of the yield classes in the range of 13-15 Mg ha-1 compared to URN. In summary, the main effect of
VRN on grain yield was to decrease the frequency of less productive plants and, to some extent, of the highly productive ones.
In this study, the corn grain yield under VRN had a numerical increase of 6.5% compared to URN (data obtained with the combine) (Figure 3a, b), without statistical difference, similar to the results obtained with manual harvesting (8.3%) (Table 2). Part of this result may be explained by the reduction of reference N rate (70 kg ha-1) in VRN strategy, in a study in which there was a
The corn grain yield, NAE and gross income by class of N rate prescriptions in VRN strategy is shown in Figure 4. Thereby, the class of low N rate prescribed showed a grain yield 24.2% higher than URN, even with a 7.9% decrease in N rate. In addition, under VRN, there was an increase of 110.4% in NAE compared to URN. The high yield zone is able, at least in the short term, to sustain high grain yield even with some reduction in N rate. Cassman et al. (2002); Dobermann (2005); Snyder & Bruulsema (2007); and Farinelli & Lemos (2010) reported an increased NAE with the reduction in the N fertilizer rate.
The VRN strategy promoted an increase of 26.2% in gross income compared to URN. Therefore, the reduction in the N rate for plants with high VI at V8 crop stage was an efficient strategy, especially from an economic and environmental point of view.
Figure 3: Distribution frequency histogram of corn grain yield acquired from the combine for uniform rate of N (a) and variable rate of N (b). SD = Standard Deviation; CV = Coefficient of variation; n = number of observations.
In the class of high N rate prescribed, an increase of 11.6% in the N rate promoted an increase of 11.1% in grain yield compared to URN. Moreover, it was verified under VRN that NAE increased by 41.7% and gross income by 12.8% compared to URN. These results suggest a recovery from plant N deficiency diagnosed at V8 crop stage expressed by low VI readings. Tubaña et al. (2008) reported similar results for corn, and Mayfield & Trengove (2009), for wheat.
In this study, the NAE was 25.0 and 32.0 kg kg-1 for
URN and VRN, respectively (Figure 4). Thus, VRN strategy increased NAE by 32.6% compared to URN. Raun
et al. (2005), Singh et al. (2006) and Maine et al. (2010)
is an indicator of a well N managed system. In addition, the VRN promoted an increase of 8.3% in gross income compared to URN.
For VRN to be an effective fertilizer strategy, two main conditions must be met: a) reduction in the N rate for plants with high VI, which should result in grain yield decreases that would not compromise the economic return; and b) increase in the N fertilizer rate for plants with low VI, which should result in increased crop grain yield over the rising cost of fertilizer input. The results obtained in this study suggest that both conditions were met, resulting in the increase of NAE and gross income compared to those obtained under URN. Furthermore, VRN was an efficient strategy from the environmental point of view, because it reduced the risks associated with N over fertilization.
CONCLUSION
The VI determined by the optical crop sensor used in this study was highly related to the nutritional status of corn valued at N uptake and dry matter yield.
The grain yield with VRN and URN strategies were similar, but increased plant N uptake and NUE, reducing the risk of environmental impact by N fertilization.
The VRN strategy proved efficient in the use of N by a reduction and increase of N rate prescribed by the optical sensor according to the nutritional status of the culture.
REFERENCES
Amado TJC, Mielniczuck J & Aita C (2002) Recomendação de adubação nitrogenada para o milho no RS e SC adaptada ao uso de culturas de cobertura do solo, sob sistema de plantio direto. Revista Brasileira de Ciência do Solo, 26:241-248.
Amaral LR & Molin JP (2011) Sensor óptico no auxílio à reco-mendação de adubação nitrogenada em cana de açúcar. Pesquisa Agropecuária Brasileira, 46:1633-1642.
Argenta G, Silva PRF & Bortolini CG (2001) Clorofila na folha como indicador do nível de nitrogênio em cereais. Ciência Ru-ral, 31:715-722.
Argenta G, Silva PRF & Sangoi L (2004) Leaf relative chlorophyll content as an indicator parameter to predict nitrogen fertilization in maize. Ciência Rural, 34:1379-1387.
Bragagnolo J, Amado TJC, Nicoloso RS, Jasper J, Kunz J & Teixeira TG (2013a) Optical crop sensor for variable-rate nitrogen fertilization in corn: I. Plant nutrition and dry matter production. Revista Brasileira de Ciência do Solo, 37:1288-1298.
Bragagnolo J, Amado TJC, Nicoloso RS, Santi AL, Fiorin JE & Tabaldi F (2013b) Optical crop sensor for variable-rate nitrogen fertilization in corn: II. Indices of fertilizer efficiency and corn yield. Revista Brasileira de Ciência do Solo, 37:1299-1309.
Casa R, Cavalieri A & Locascio B (2011) Nitrogen fertilization management in precision agriculture: A preliminary application example on maize. Italian Journal of Agronomy, 6:23-27.
Cassman KG, Dobermann A & Walters DT (2002) Nitrogen use efficiency, and nitrogen management. Ambio, 31:132-144.
CONAB - Companhia Nacional de Abastecimento (2014) Acom-panhamento da safra brasileira de grãos 2013/2014. Décimo segundo levantamento, Setembro/2014. Companhia Nacional de Abastecimento. Brasília. Disponível em: < www.conab.gov.br >. Acessado em: 12 de outubro de 2014.
CQFS–RS/SC - Comissão de Química e Fertilidade do Solo (2004) Recomendações de adubação e calagem para os estados do Rio Grande do Sul e Santa Catarina. 10a ed. Comissão de Química e
Fertilidade do Solo, Porto Alegre. 400p.
COTRIJAL - Cotrijal Cooperativa Agropecuária e Industrial (2011) Disponível em: <http://www.cotrijal.com.br>. Acessado em: 30 de fevereiro de 2011.
Dobermann A (2005) Nitrogen Use Efficiency – State of the Art. In: IFA International Workshop on Enhanced-Efficiency Fertilizers. Frankfurt, Germany. p.28-30.
Embrapa (2006) Sistema brasileiro de classificação de solos. 2a ed.
Rio de Janeiro, Centro Nacional de Pesquisa de Solos. 306p.
Farinelli R & Lemos LB (2010) Produtividade e eficiência agro-nômica do milho em função da adubação nitrogenada e manejos do solo. Revista Brasileira de Milho e Sorgo, 9:135-146.
Ferreira DF (2000) Análises estatísticas por meio do Sisvar para Windows versão 4.0. In: 45a Reunião Anual da Região Brasileira
da Sociedade Internacional de Biometria, São Carlos. Anais, UFSCar. p.255-258.
Fixen PE, Jiyun J, Tiwari KN & Stauffer MD (2005) Capitalizing on multi-element interactions through balanced nutrition — A pathway to improve nitrogen use efficiency in China, India and North America. Science in China Series C: Life Sciences, 48:780-790.
Giotto E (2011) Sistema CR - Campeiro 7.0. Disponível em: <http://www.crcampeiro.net/>. Acessado em: 14 outubro de 2011.
Grohs DS, Bredemeier C, Mundstock CM & Poletto N (2009) Modelo para estimativa do potencial produtivo em trigo e ce-vada por meio do sensor Greenseeker. Engenharia Agrícola, 29:101-112.
Hurtado SMC, Resende AV, Silva CA, Corazza EJ & Shiratsuchi LS (2009) Variação espacial da resposta do milho à adubação nitrogenada de cobertura em lavoura no cerrado. Pesquisa Agropecuária Brasileira, 44:300-309.
Jakelaitis A, Silva AA & Ferreira LR (2005) Efeitos do nitrogênio sobre o milho cultivado em consórcio com Brachiaria brizantha. Acta Scientiarum Agronomy, 27:39-46.
Jasper J, Reusch S & Link A (2009) Active sensing of the N status of wheat using optimized wavelength combination-impact of seed rate, variety and growth stage. In: 7th European conference on precision agriculture, Wageningen. Proceedings, Academic Publishers. p.23-30.
Jorgensen JR & Jorgensen RN (2007) Uniformity of wheat yield and quality using sensor assisted application of nitrogen. Precision Agriculture, 8:63-73.
Koppen WP (1948) Climatologia, com un estúdio de los climas de la tierra. México, Fondo de Cultura Econômica. 478p.
Lázaro RL, Costa ACT, Silva KFS, Sarto MVM & Duarte Júnior JB (2013) Produtividade de milho cultivado em sucessão à aduba-ção verde. Pesquisa Agropecuária Tropical, 43:10-17.
Lobell DB (2007) The cost of uncertainty for nitrogen fertilizer management: a sensitivity analysis. Field Crop Research, 100:210-217.
Maine N, Lowenberg-Deboer J, Nell WT & Alemu ZG (2010) Impact of variable-rate application of nitrogen on yield and profit: a case study from South Africa. Precision Agriculture, 11:448-463.
Malavolta E (2006) Manual de nutrição mineral de plantas. São Paulo, Ceres. 638p.
Mayfield AH & Trengove SP (2009) Grain and protein responses in wheat using the N-Sensor for variable rate application. Crop and Pasture Science, 60:818-823.
Miranda RA, Duarte JO & Garcia JC (2012) Cultivo de milho: Sistema de produção I. Disponível em: <http:// sistemasdeproducao.cnptia.embrapa.br/FontesHTML/Milho/ CultivodoMilho_8ed/mercado.htm>. Acessado em: 02 de agos-to de 2013.
Nogara Neto F, Roloff G, Dieckow J & Motta ACV (2011) Atribu-tos de solo e cultura espacialmente distribuídos relacionados ao rendimento do milho. Revista Brasileira de Ciência do Solo, 35:1025-1036.
Portz G, Molin JP & Jasper J (2012) Active crop sensor to detect variability of nitrogen supply and biomass on sugarcane fields. Precision Agriculture, 13:33-44.
Povh FP, Molin JP, Gimenez LM, Pauletti V, Molin R & Salvi JS (2008) Comportamento do NDVI obtido por sensor ótico ativo em cereais. Pesquisa Agropecuária Brasileira, 43:1075-1083.
Raun WR & Johnson GV (1999) Improving nitrogen use efficiency for cereal production. Agronomy Journal, 91:357-363.
Raun WR, Solie JB, Johnson GV, Stone ML, Mullen RW, Freeman KW, Thomason W & Lukila E (2002) Improving nitrogen use efficiency in cereal grain production with optical sensing and variable rate application. Agronomy Journal, 98:815-820.
Raun WR, Solie JB, Stone ML, Martin KL, Freeman KW, Mullen RW, Zhang H, Shepers JS & Johnson GV (2005) Optical sensor-based algorithm for crop nitrogen fertilization. Communications in Soil Science and Plant Analysis, 36:2759-2781.
Santi AL, Amado TJC, Cherubin MC, Martin TN, Pires JL, Della Flora LP & Basso CJ (2012) Análise de componentes principais de atributos químicos e físicos do solo limitantes à produtivida-de produtivida-de grãos. Pesquisa Agropecuária Brasileira, 47:1346-1357.
Singh I, Srivastava IA, Chandna P & Gupta R (2006) Crop sensors for efficient nitrogen management in sugarcane: Potential and constraints. Sugar Tech, 8:299-302.
Snyder CS & Bruulsema TW (2007) Nutrient use efficiency and effectiveness in North America: Indices of Agronomic and Environmental Benefit. Norcross, IPNI. 4p.
Soil Survey Staff (2010) Keys to Soil Taxonomy. 11a ed.
Wa-shington, USDA. 338p.
Tedesco MJ, Gianello C, Bissani CA, Bohnen H & Volkweiss SJ (1995) Análise de solo, plantas e outros materiais. 2ª ed. Porto Alegre, Universidade Federal do Rio Grande do Sul. 174p.