E
CONOMIA
I
NTERNACIONAL E
E
STUDOS
E
UROPEUS
T
RABALHO
F
INAL DE
M
ESTRADO
D
ISSERTAÇÃO
I
MPACTO DA FACILITAÇÃO DO COMÉRCIO AO LONGO
DO
"
BELT AND ROAD
"
NAS EXPORTAÇÕES CHINESAS
M
ENGNI
X
IN
I
NTERNATIONAL
E
CONOMY AND
E
UROPEAN
S
TUDIES
M
ASTER
’
S
F
INAL
W
ORK
D
ISSERTATION
T
HE
I
NFLUENCE OF
T
RADE
F
ACILITATION
A
LONG THE
“BELT
AND
ROAD”
ON
C
HINA
’
S
E
XPORT
M
ENGNI
X
IN
S
UPERVISOR:
P
ROFESSORA
NTÓNIOA
UGUSTO DAA
SCENÇÃOM
ENDONÇACom o ritmo da integração económica, o desenvolvimento de padrões comerciais entre os países também se torna mais complexo. Desde a crise financeira de 2008, o protecionismo comercial aumentou, a recuperação económica está lenta, novos desafios continuam a surgir. Neste contexto, a China, mantendo a tendência de desenvolvimento dos tempos, apresentou a iniciativa "Belt and Road" em 2013, visando tornar-se outra "Rota da Seda" no novo século como um elo entre a Ásia e a Europa em que os países ao longo do percurso possam estabelecer uma comunicação mais profunda no comércio, e mesmo em termos culturais e políticos. A facilitação do comércio desempenha, sem dúvida, um papel importante, porque tem a ver com o grau de barreiras comerciais entre países, a construção de infra-estrutura, abertura económica e outros aspetos das relações económicas entre países.
Neste sentido, a fim de estudar o papel da facilitação do comércio em maior profundidade e apresentar propostas práticas para promover o comércio de exportação da China para os países "Belt and Road", nesta dissertação constrói-se o correspondente sistema de índice de facilitação do comércio e um modelo gravitacional do comércio, baseado nas características da região, e calcula-se o nível de facilitação do comércio em 50 países ao longo do percurso em 2013-2017, compilado, em seguida, em dados de painel e realiza-se a análise de regressão nos níveis, geral , regional e fatorial. A partir dos resultados, podemos ver que o nível de facilitação do comércio dos países é desigual e tem uma relação positiva com o comércio de exportação da China. No final, as recomendações políticas relevantes são apresentadas, considerando que os países devem melhorar o nível de facilitação comercial, nos seus próprios aspectos e nos aspectos gerais, fortalecer a construção de infra-estruturas, estabelecer uma gestão aduaneira mais padronizada e promover ativamente a construção de zonas de livre comércio e a assinatura de acordos de livre comércio.
With the pace of economic integration, the development of trade patterns between countries is also more complex. Since the financial crisis in 2008, trade protectionism has risen, economic recovery is slow, new challenges continue to emerge. In this context, China, in keeping with the trend of development of the times, put forward the "Belt and Road" initiative in 2013, committed to becoming another "Silk Road" in the new century as a link between Asia and Europe, so that countries along the route obtain a deeper communication in trade, and even in cultural and political aspects. In the process of "Belt and Road" development, trade facilitation undoubtedly plays an important role, because it relates to the degree of trade barriers between countries, infrastructure construction and economic openness and so on. For the trade side, improve the level of trade facilitation can better achieve the goal of win-win situation.
Therefore, in order to study the role of trade facilitation in greater depth and put forward practical proposals to promote China's exports trade to the "Belt and Road" countries, this dissertation constructs the corresponding trade facilitation index system and trade gravity model based on the "Belt and Road" regional characteristics and calculates the level of trade facilitation in 50 countries along the route in 2013-2017, then compiled into panel data and carries out the regression analysis at the overall, regional and factor levels. From the results, we can see that the level of trade facilitation of countries is uneven and has a positive relationship with China's export trade. At the end, the relevant policy recommendations are given considering that countries should improve the level of trade facilitation from their own and overall aspects, strengthen infrastructure construction, establish more standardized customs management, and actively promote the construction of free trade zones and the signing of free trade agreements.
Acknowledgements
This paper will be a significant part of my life and it is a test and summary of my study in Master’s degree. In addition to my dedication, it is possible only because of the strong support of a group of people.
First of all, thanks to my supervisor, Professor António Mendoça, for using his professionalism and wealth of knowledge to guide me in the right direction, for the infinite support and patience in the process and the encouragement for me.
Also, I am grateful to my family, for giving me courage and strength when I am in trouble and always unconditionally supporting me to complete my research.
Finally, thanks to my boyfriend Boran, for his tolerance and patience, for experiencing and grouting with me, which is an integral part of the success of this dissertation.
Contents
Abstract Resumo Acknowledgements 1. Introduction --- 1 1.1 Research background --- 1 1.2 Research content --- 2 1.3 Research methods --- 3 1.4 Research significance --- 42. Theoretical Basis and Literature Review --- 5
2.1 Basic definition of relevant concepts --- 5
2.1.1 Meaning of trade facilitation --- 5
2.1.2 Meaning of regional economic integration --- 5
2.2 Previous Theories --- 6
2.2.1 Theory of comparative advantage --- 6
2.2.2 Transaction cost theory --- 6
2.2.3 Customs Union theory --- 7
2.2.4 Free Trade theory --- 8
2.3 International Studies on the trade facilitation --- 8
2.4 International studies on the impact of trade facilitation on exports --- 10
3.Analysis on "Belt and Road” Area Situation and Trade Status Quo --- 12
3.1 "Belt and Road" overview --- 12
3.2 Analysis on Trade Status Quo --- 15
4.Trade facilitation level calculation of "Belt and Road" countries --- 20
4.1 Trade Facilitation Indicator System --- 20
4.1.1 Data selection --- 20
4.1.2 Data processing --- 21
4.2 Calculation and analysis of trade facilitation level --- 21
5.1 Gravity model settings --- 23
5.1.1 Variable selection --- 23
5.2 Empirical test --- 25
5.2.1 Influence of overall trade facilitation level on China's export trade --- 26
5.2.2 Impact of regional trade facilitation levels on China's export trade --- 30
5.2.3. The impact of sub-factors on China's exports in trade facilitation --- 33
6. Conclusion --- 35
6.1 Main results of the research --- 34
6.2 Suggestion --- 36 7. Reference
1. Introduction
1.1 Research background
As the pace of economic globalization continues to develop, the links between countries in the world are becoming more and more close; but at the same time, due to the trend of global integration, since the outbreak of the global economic crisis in 2008, the international finance has been hit hard and the economy has recovered slowly, the economic trade between countries is also showing a deceleration.
All countries and economies around the world are actively seeking solutions to promote the development of their own economies, therefore, various regions of the world have emerged with bilateral and multilateral corresponding economic cooperation mechanisms, such as the Transatlantic Trade and Investment Partnership (TTIP), the Trans-Pacific Partnership (TPP), and the East Asia 10+3 mechanism. It is gradually progressing in the direction of regional economic integration. In this context, President Xi Jinping proposed in Kazakhstan on September 7, 2013 to jointly build the "Silk Road Economic Belt" initiative to build a mutually beneficial community of interests, and on October 3 of the same year, in Indonesia he put forward a new initiative to build the "Silk Road Economic Belt" and the" 21st century Maritime Silk Road" and have comprehensively structured an open platform for the all-round liberalization of the" Belt and Road "to accelerate the resolution of obstacles to trade facilitation.
According to the World Development Indicators (WDI, 2016), countries along the route involve a total population of about 3.21 billion, accounting for 43.4% of the world's population, with 29% of total economy of the world and 21.7% of the world's total trade. The development trend of countries along the route has continued to rise in recent years, with GDP reaching even $12 trillion in 2016, accounting for about 16% of the total global GDP; the growth rate of foreign trade along the countries of the route is also increasing year by year, and the exports of countries along the route are expected to account for 1/3 of total world exports over the next 10 years (Jia et al., 2017). In 2017, China and the B&R countries achieved relatively rapid growth in total imports and exports which reached $1.44032 trillion, higher than China's overall foreign trade
growth rate of 5.9%, accounting for 36.2% of China's total import and export trade. For the first time, the rate of growth in imports outpaced exports, with exports up to 8.5% and imports up to 19.8% (National Information Centre, 2018).
However, the large differences in resource endowments, poor infrastructure and inadequate economic systems in the countries along the route have forced countries to begin to seek measures to improve trade facilitation in order to expand their trade with other countries. For enriching and perfecting the connotation of "Belt and Road", promoting and speeding up the construction of it, raising the level of national economic development, and promoting the improvement of the economic level of the countries along the route, all of which have a very important realistic role and significance.
This paper analyzes the current situation of "Belt and Road" trade and the measurement of trade facilitation in the region, not only help the region along the route to improve their trade facilitation, but also contribute to a comprehensive understanding of the economic and trade situation along the region. The empirical test part of this paper accurately gives the "Belt and Road" the specific value of the impact of trade facilitation on China's export trade in different regions which will help China to expand bilateral trade according to the specific situation of each region along the route. Therefore, the study will learn more about the current state and future direction of trade between China and countries along the route. And this paper will also put forward feasible policy suggestions on this basis.
1.2 Research content
This thesis studies the impact of “Belt and Road" initiative’s trade facilitation on China's export trade. Mainly solves three aspects of the problem:
1) What is the level of trade facilitation in the countries of the "Belt and Road" region?
2) Do the indicators in the trade facilitation indicator system have an impact on China's export trade?
3) Will the increase in the level of trade facilitation have an impact on the increased export trade of countries along the “Belt and Road?
In order to solve these problems, the research in this paper is divided into the following six chapters, the specific contents are as follows.
The First chapter is the introduction part, mainly elaborated the whole article that carries on the topic selection background and the significance, as well as expounds the methods and calculation used in the research.
The Second chapter is the theoretical basis and the important definition part; The Third Chapter carries out a statistical analysis of the overall trade situation of the countries along the "Belt and Road”.
The Fourth chapter shows overview of the "Belt and Road" initiative and the trade facilitation, as well as indicating the status quo of trade facilitation level of B&R countries.
The Fifth chapter is the empirical analysis part, mainly through the gravity model analysis the impact of the trade facilitation level on China's export trade by multi-aspects.
The last chapter is the research conclusion and the policy suggestion part, mainly states the results after the empirical analysis of the research.
1.3 Research methods
First, literature and data analysis methods. Through the collection and collation of a large number of relevant theoretical and textual materials and select some of the important theoretical knowledge and research results to produce a macroscopic understanding of trade facilitation and to reveal the crucial importance of trade facilitation; for this article, to provide a theoretical basis. By collecting relevant official data, people can have a concrete understanding of the current trade situation in the “Belt and Road” region for nearly 10 years, thus further demonstrating the importance of this study.
Secondly, comparative analysis method of qualitative and quantitative combination. Through the construction of trade gravity model, to compare the trade facilitation indicators of various countries along the route by statistics and to analyze scientifically the "Belt and Road" trade facilitation level, then explore its impact on China's export trade.
Third, the empirical analysis method. The trade gravity model constructed in this paper is an extension of the traditional model, including the country's GDP, the distance between countries, and so on, in addition to the population and other variables into the model to study.
1.4 Research significance
Through the existing international research on trade facilitation data, it is found that there are two shortcomings: first, there is no uniform standard of interpretation for trade facilitation; Second, the previous studies of trade facilitation Index system, mainly use countries in a global level or international cooperation organizations as the object of study, rarely focus on "Belt and road" countries, so the data is not complete. This paper summarizes the previous scholars ' research on trade facilitation, combined with the current trade situation, through the construction of trade gravity model, to find out the impact of trade facilitation on export trade, and put forward targeted suggestions, for the "Belt and Road" region to take different effective economic measures having a theoretical and practical significance. In addition, this paper divides the area along the route into three parts to measure the level of trade facilitation, which makes the analysis multi-angle; there are also innovations in the selection of trade gravitational model variables.
In the study of trade facilitation, we will, to a certain extent, find the influencing factors that hinder bilateral and multilateral trade development, so that we can improve and solve the existing problems, promote the development of trade and promote economic growth.
2. Theoretical basis and literature review
2.1 Basic definition of relevant concepts 2.1.1 Meaning of trade facilitation
The World Trade Organization (WTO, 1998) defines trade facilitation as “the simplification and harmonization of the transmission of data on the movement of goods, the conduct, practices and procedures involved in the process of dealing with the needs of international trade.” The essence of trade facilitation is to strengthen the trade and information mobility among countries by eliminating the barriers in trade which include the improvement of convenience in transportation, reduction of costs of import and export and simplification of procedures, etc. Its fundamental purpose is to create an orderly and transparent trading system and environment and to promote trade development between countries or economic entities by regulating trade procedures and harmonizing agreements related to trade facilitation.
International trade has a long history, so there is a large number of theories, more or less, those scholars and investigators mostly have given a positive attitude to the promotion brought by trade facilitation.
2.1.2. Meaning of regional economic integration
The term "regional economic integration" first appeared in Western Europe, but the definition of the term has never been uniformed. EL-Agraa (1988) argues that regional economic integration is a process of continuous integration of different economies, followed by the formation of a large international organization in which trade barriers are gradually removed and the goods of countries will be more freely circulated. This is similar to the exposition of American economist Bela Balassa (1961) in Theory of Economic Integration, but Balassa's explanation is more comprehensive, and she divides it into two stages: a process and a state. This definition of Balassa was very classic that expressed the most essential connotation of regional integration and won the general recognition of the Western economic circles, the subsequent scholars on this issue of the study are also mainly carried out from these two aspects. The three major regional economic organizations in the world, the European Union, the North
American Free trade region, and the Asia-Pacific Economic Cooperation, all through the "process" stage and "state" phase before the final formation. Therefore, the theory of regional economic integration provides a theoretical basis for regional economic organizations to find a suitable method for improving the level of trade facilitation. 2.2 Previous theories
2.2.1 Theory of comparative advantage
The theory of comparative advantage was put forward by David Ricardo (1817). He analyzed the technology gap between the two countries that leads to differences in production costs of different products, resulting in international trade generation. According to the Theory of International Trade Division of labor, each country produces and exports some products with comparative advantages, and imports products with relative disadvantages of production. In this process, each country can obtain the benefits of the Division of International Labor through international trade, and the theory of comparative advantage explains how international trade is generated. David Ricardo thought that in the process of trade, the State should actively pursue the free trade policy, and then through the export of products with production advantages, import production-disadvantageous of products, thus promoting the development of trade between countries.
2.2.2 Transaction cost theory
In the book "The Nature of the enterprise", Coase (1937) proposed the transaction cost theory, which defines the concept of transaction costs as "the most obvious cost in the process of organizing a production is to find the cost of relative prices", "the cost of negotiating and contracting for each transaction occurring on the market" and "the cost of other aspects of the existence of the price mechanism”. In summary, transaction costs include prior transaction costs and after-action transaction costs. The prior transaction cost generally includes search cost, information cost, bargaining cost, decision cost and supervision cost. The afterwards transaction cost refers to the cost of default that is caused by the failure to fulfill the contract. According to Coase's transaction costs, there
are costs to trading on the market, because the transaction takes time and opportunity to discover and complete. The most obvious manifestation of transaction costs in international trade is that when a country's products are exported to another country, customs clearance is required during transit, time is taken, and the site of the importing country is occupied, which result in transaction costs. Transaction costs can be negotiated between the two sides of the transaction to reach agreement on certain aspects, so that the cost can be reduced.
2.2.3 Customs Union theory
The founder of the Customs Union theory was Jacob Viner, he explained in detail in The Customs Union Issue (1950), in which he defined the customs union, which, in his view, refers to the agreements signed between two sides or multiple parties for a better trade and exchange to reduce tariffs and so on, so that these countries have a unified border, with lower trade costs on their territory, which can enhance the competitiveness of the products produced by Member States, because, in terms of comparative advantage, a country can import its own scarce products from other Member States and pay cheaper prices. Because of tariff exemptions, resources in member countries can be used effectively and yields have increased significantly, at the same time, through a professional division of labor, the consumption spending on the commodity in the country declined and then can spend capital on the consumption of other commodities, thus expanding social demand and resulting in a significant increase in trade volumes. The Allies have free trade and common external tariffs, which are very beneficial to the Allies and can significantly improve the competitiveness of the Allies. When a non-member's product wants to enter the Allied market, it is required to pay the corresponding tariff, and unless the price of the product of a non-member State drops to a sufficiently low level, it is unable to compete with the Member States that produce the same product in the allied countries. Therefore, the protection of Member States by the Customs Union can promote the optimal allocation of resources among Member States and enhance the level of economic development of each Member State.
2.2.4 Free Trade theory
The theory of free trade is the core of international trade theory, and it is also a basic principle followed by various trade theories and trade policies that have emerged since then. With the rapid pace of globalization and the urgent need for capital to break through the barriers to free movement, developed countries have strongly advocated trade liberalization, and developing countries, after gaining the benefits of globalization, have strongly favored the removal of barriers and the promotion of liberalization policies. Meade (1955) put forward the theory of free trade on the basis of the customs Union. The meaning of free trade theory is that two or more countries can establish a free trade area by entering into agreements, in which countries are free to trade and remove trade barriers in types of tariff or non-tariff, and at the same time, these countries change certain policies, reducing some barriers in domestic investment by other countries and expanding market access restrictions so that countries involved in free trade zone can achieve a certain degree of free movement of factors of production, such as goods, services, people, technology and science, etc. With regard to countries involved in the theory of free trade, there can still be independent tariff-making rights. This way is the generally adopted by the countries currently involved in the theory of free trade.
2.3 International studies on the trade facilitation
Wilson, Mann, and Otsuki (2004) estimated and measured the relationship between trade facilitation and trade flows through a disaggregated study of manufactured goods in 75 countries. Based on this relationship, calculated the extent of the impact of trade facilitation on bilateral trade flows, followed by the filtrate of 4 specific indicators: port facilities, customs environment, regulatory environment and electronic commerce, and organized the relevant panel data during 2000-2001. Then used the gravity model of trade to make an empirical analysis of the collected data. The results showed that with the deepening of globalization, the demand for trade facilitation is increasing in countries or regions, and the increase of trade facilitation has directly contributed to the
expansion of export trade volume; in terms of world export trade, the growth volume was close to $400 billion, which made the export growth rate significantly higher than the import growth rate. This result was due to an increase in exports to the OECD market. In addition, the results of the study demonstrated that if a further reform wants to be achieved in trade facilitation, they should rely on the continuous improvement of laws and systems, rather than on the continuous expansion of investment projects. Allen Dennis (2006) examined the potential contribution of regional trade agreements, as well as trade facilitation improvements, in enhancing the development prospects of the Middle East and North Africa (MENA) region. Using the Global Trade Analysis Project (GTAP) model and database, the article observed that both intra-regional integration and integration in the EU would have a beneficial impact on welfare in the MENA region. Furthermore, these welfare gains are observed to at least triple when the implementation of the RTAs is complemented with trade facilitation improvements. Martinez-Zarzoso Inma and Márquez-Ramos Laura (2008) analyzed the impact of trade facilitation on sectoral trade flows. The article used several estimation techniques (i.e. OLS, PPML and Harvey models) to estimate the enhanced gravity equation for 13 exporters and 167 importers. A common result was that trade flows increase by lowering transport costs and the number of days required to trade. Evdokia Moïsé (2013) assessed the impact of specific trade facilitation measures on developing countries’ trade through the OECD indicators. A total of 16 trade facilitation indicators were constructed with the aim to estimate the addressing specific hurdles in the trade and border procedures of a given country. The author believed that the greatest impact on trade volumes and trade costs in this area were imports as well as export efficiency, such as availability of relevant information, the simplification and harmonization of documents, streamlining of procedures and automated usage process, etc. The combined effect of these improvements would greater than the simple sum of the impact of an individual measure, in which the total transaction costs of low-income countries decreased by almost 14.5%, the number of low-and middle-income countries decreased
by about 15% and the middle-income countries decreased by about 13%. Kong and Dong (2015) investigated the trade facilitation of countries along the "Belt and Road” and the empirical results showed that the trade facilitation had a greater role in promoting trade than regional economic organizations or tariff relief factors. Moreover, since the degree of trade facilitation varied from region to area, the trade potential among different regions would be significantly greater than the latent trade potential among countries in the same region. For the construction of the "Belt and Road", they should pay attention to cooperation and innovation in the perspective of trade facilitation and the establishment of diversified cooperation mechanisms, to achieve connectivity and common prosperity between the Asian and European continents. 2.4 International studies on the impact of trade facilitation on exports
The study of T Iwanow (2009) used a new panel dataset for 124 developed and developing countries, for the period 2003-2004 to assess the impact of trade facilitation and other trade-related institutional constraints on the performance of manufacturing exports, particularly in the African region. The article estimated a standard trade gravity model augmented with trade facilitation, regulatory quality, and infrastructure indicators. The results of the empirical analysis demonstrated that the increase in the volume of trade exports of African countries depends on the increase in the level of trade facilitation, as trade facilitation enhances the quality of regulation, improves infrastructure construction and creates a sound development environment for trade. The research written by Dennis and Shepherd (2011) showed that in developing countries, the improvement of export diversification in trade could promote trade facilitation. They found that every 10% reduction in international transport costs and domestic exporting costs (documentation, inland transport, port and customs charges), in 118 developing country samples, export diversification gains a rise by 4% and 3% respectively, and customs costs also played a particularly important role in these results. Because lower market entry costs could also promote diversification, it was less effective (1%). The article also found that, for poorer countries, the level of trade
facilitation had a more important impact on the country's diversification. Empirically, the article uses alternative independent variables, different national samples and alternative econometric techniques, so that the results have a highly robust type. In addition, the article links these findings to the latest advances in trade doctrines that emphasize the heterogeneity of enterprises and the growth of broad marginal trade. Robert C.Feenstra and Ma Hong (2014) examined the linkages between trade facilitation and export varieties among a wide range of countries. The article uses port efficiency to measure trade facilitation, in addition to bilateral import tariffs, whether OECD member countries and whether there are regional trade agreements. They found that the wide marginal contribution of port efficiency to exports is significant, and bilateral import tariffs have a negative impact on export varieties. Positive effects were confirmed when examining trade between countries that did not have a common land boundary, or between OECD member States and non-OECD countries. Zhou(2017) having collated the relevant data of China and its 135 trading countries, using the stochastic frontier gravity model to make an empirical analysis of the impact of trade facilitation on export efficiency, and then using the non-efficiency model to test it. The article points out that China's trade facilitation and export efficiency are still low compared with those of developed countries, so China has a lot of space for improvement in this respect. Moreover, it is concluded from the analysis that export inefficiency is a significant factor restricting the growth of China's exports, so if the trade facilitation of China and its trading partners is improved, then export efficiency will be significantly improved.
From the previous literature review, it can be seen that since the "Belt and Road" initiative emerged, it has become a hot topic in the economic field, especially in international trade, and the related theoretical and empirical researches are endless, also the research results are very rich, which provide many valuable theoretical and practical experience for the researchers of related subjects in the future.
3. Analysis on "Belt and Road” Area Situation and Trade Status Quo
3.1 "Belt and Road" overview
The Silk Road Economic Belt and the 21st-century Maritime Silk Road, referred to as the Belt and Road Initiative (abbreviated B&R1), is the transnational economic Belt initiative and led by the government of the People's Republic of China in 2013.
Diagram 3.1- Belt and Road, list of 65 countries. Source: Wali Zahid (2015)
Up to now, the "Belt and Road" covers Mongolia, Egypt, 10 ASEAN countries, including Singapore and Malaysia, etc., 18 countries in West Asia, including Iraq and Saudi Arabia, etc., 8 countries in South Asia, including India and Pakistan, etc., and Central Asia, including Kazakhstan and Uzbekistan, etc., Russia, Ukraine and other 7
1 Western Development Department of National Reform and Development Commission. Committee
and other relevant departments to standardize the "Belt and Road" initiative in English translation.
National Development and Reform Commission of the People's Republic of China. Beijing. [2018-03-24]
CIS countries, as well as 16 countries of the Middle East and Europe, including Poland, the Czech Republic, etc., and other 65 countries and regions.
As an important material link platform, the "Belt and Road" makes the goods in the East and West circulate to each other, but this is not only an economic "way", but also cultural exchange, and in which it also playing a considerable role in this exchange. The B&R aims to become a trade and infrastructure network connecting Asia with Europe and Africa along ancient trade routes. For regional connectivity, China is working in aviation, power, rail, road and telecommunications projects with participating countries.
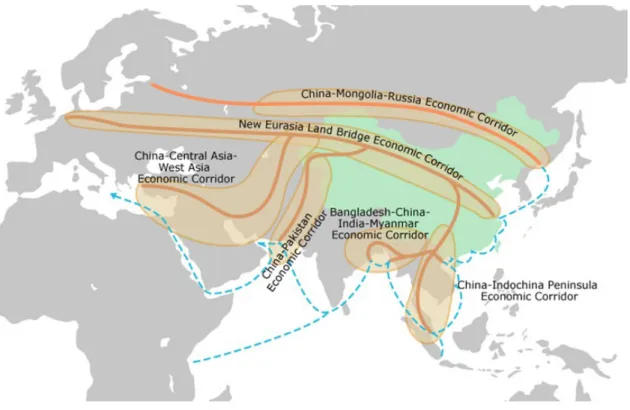
Diagram 3.2 - Five main corridors in B&R
Source: Hong Kong Trade Development Council (HKTDC)
The Belt and Road Initiative focuses on six corridors that are connections among those areas: 1. The New Eurasia Land Bridge Economic Corridor; (2) The China-Mongolia-Russia Economic Corridor;(3) China-Central Asia-West Asia Economic
Corridor;(4) China-Indochina Peninsula Economic Corridor;(5) China-Pakistan Economic Corridor;(6) Bangladesh-China-India-Myanmar Economic Corridor.
As can be seen from above, China's trade exchanges with the regions along the route are mainly ASEAN, Western Asia and Central and Eastern Europe, while the number of countries along the three regions also accounts for more than 70%. The scale of GDP along the region is $2.8 billion, nearly 40% of the world’s total. Under the “Belt and Road” Initiative, China's trade with countries along the route was as high as 9.5 billion in 2016, accounting for one-fourth of China's total trade in goods.2
Pie
Chart 3.1- Share of GDP and Population of Countries along the "Belt and Road" and China in 2017
Source: Big Data Report on Trade Cooperation under Belt And Road Initiative 2018 From the chart 3.1 and relevant data we can see, in 2017, the sum of GDP in countries along the “Belt and Road" was forecast at $14.5 trillion, accounting for 18.4% of global GDP; the total population was projected at $3.44 billion, representing 48% of the global population. Thus, most of countries in this region are developing countries, with a large population and low per capita GDP, but the rich resources contained in which can provide a great advantage for future trade and occupy an important position in the global trade map.
2 Data collected from Research report on industrial cooperation and development of countries (regions) along Others 66.0% China 15.6% B&R Countries 18.4% Share of Global GDP Othe rs 48.0 % China 19.0% B&R Countries 33.0%
3.2 Analysis on trade status quo along the route
Due to data incompleteness, during the data collection, Yemen, Turkmenistan, Syrian Arab Republic are removed from countries in the "Belt and Road" region (including China). In the calculation process, the total amount of foreign trade represents the sum of exports and imports of goods, rather than the total number of single exports in previous studies.
Table I
World Total International Trade in 2013-2017
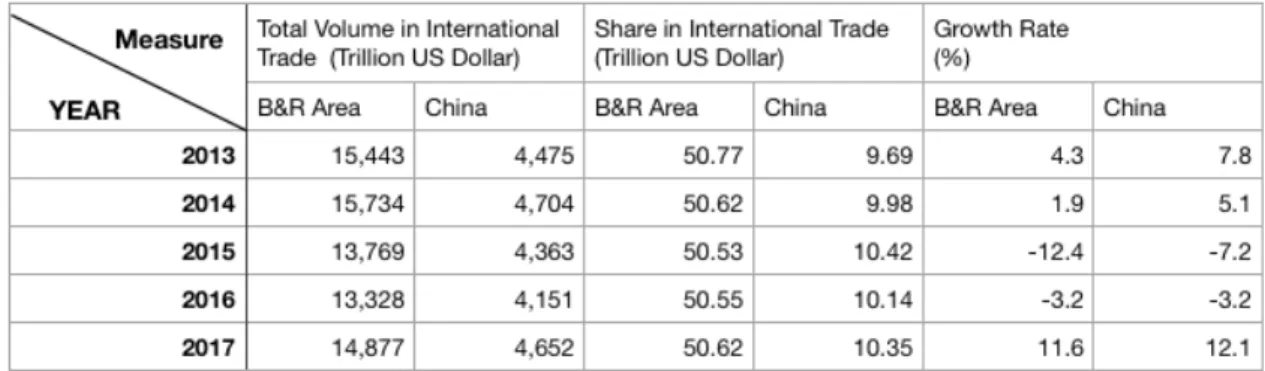
Table II
B&R Area and China Total International Trade in 2013-2017
Table I and II are the statistical results of the foreign trade situation between the world and the "Belt and Road" countries and China in 2013-2017 respectively. It is easy to see that in 2013 and 2014, it was a good time for emerging economies to develop and the world economy is developing rapidly, the global trade volume is rising, and the economic globalization has been further upgraded. But that is why the Global Financial Storm that began in 2015, the by-products of a series of bubble economies, such as the
plunge in U.S. stocks, could quickly permeate the entire international market, showing negative growth in world trade (also covering areas of the "Belt and Road" countries) in the 2015 and 2016. Combined with the prevalence of trade protectionism, the global economy was in a recession, the B&R region has also been hit hard, and although China, which is a developing country that dominated by the "state-owned economy", its emerging economies have also been negatively affected by the crisis of the two years.
In terms of total volume of trade, in 2017, South Korea's foreign trade volume was the highest, at $1050.84 billion; the second was Singapore, with a trade volume of $697.21 billion; India ranked third, with a trade volume of $617.04 billion; Russia and the United Arab Emirates also trade more than $500 billion. In terms of exports, South Korea has the highest foreign exports, at $572.73 billion, followed by Singapore and Russia, at $369.55 billion and $357 billion, respectively. Among the top 10 "Belt and road" countries in terms of foreign trade, export volumes are all greater than $200 billion, with the exception of Turkey. In terms of imports, South Korea imports the highest, at $478.11 billion, followed by India and Singapore, at $356.7 billion and $327.67 billion, respectively. “Belt and Road "the top 10 countries of foreign trade, with the exception of Malaysia, import volumes are all greater than $200 billion3.
Nevertheless, the countries of the "Belt and Road" region in 2013-2017, their total foreign trade accounted for a relatively stable share of the world's total foreign trade, and steadily rising, of which China's share of trade has been maintained at around 10%. In terms of the growth rate of foreign trade, the growth rate of the "Belt and Road" region and China are at a high level, exceeding the global average growth rate, showing that the region’s trade potential is huge.
3
Histogram 3.1- Volume of China's exports to countries along the "Belt and Road" in 2011-2017
Source: China Economic Information Network.
In 2013-2017, China and the "Belt and Road" countries total volume of foreign trade was $6.975623 trillion and trade growth rate with related countries was higher than the overall growth rate of the outside world, the B&R courtiers became an important force for China's foreign trade to acceleratae economic recovery. Big data analysis shows that trade cooperation between China and Asia and Oceania and west Asia is at a high level. In 2017, South Korea, Malaysia, India, Russia and other countries were China's most important "Belt and Road" trading partners. In the same year, central Asia was the region with the fastest growth rate and the growth rates in trade with China of Qatar, Mongolia, Montenegro and Kazakhstan were all exceeding 35%.
In 2016, affected by sluggish global economic improvement, reduced demand in major countries and falling commodity prices in the international market, China and world’s total trade and export volume declined. Among them, the total volume of trade was $3702.16 billion, down by 6.4%, which was narrower than the decline of 8.1% in 2015. Exports fell 7.0% to $2,113.84 billion, extending a 2.9% decline from 2015. In 2017, China's total import and export volume with “Belt and Road" countries reversed
4,524 5,014 5,691 6,370 6,146 5,875 7,743 0 2000 4000 6000 8000 10000 2011 2012 2013 2014 2015 2016 2017
the negative growth situation for two consecutive years and reached $1,440.32 billion, an increase of 13.4% over 2016, 5.9 % higher than China's overall growth rate and accounting for 36.2% of China's total foreign trade volume. Exports totaled $774.26 billion, up by 8.5% from 2016 and accounting for 34.1% of China's total exports. After a peak value in 2014, although China's total exports of countries along the area all the way down, but still higher than in 2013 ($5.609 trillion) before, and China's total trade volume proportion is on the rise. It was overtaken in 2017, which means the B&R Initiative began to bring new trade opportunities and markets to China and all the area
along the route.4
Pie Chart 3.2- China's exports share to "Belt and Road" various regions
Source: Big Data Report on Trade Cooperation under Belt And Road Initiative 2018
4 Source from BELT AND ROAD PORTAL. Yidaiyilu.gov.cn
50.4% 15.3% 13.9% 12.7% 2.8% 4.9%
Southeast Asia West Asia South Asia Eastern Europe
Histogram 3.2- China’s Top 10 Exports Countries in 2017 Source: China Economic Information Network.
It demonstrated from the grams that most of the countries currently close to China's export trade come from Southeast Asia, followed by Northeast Asia and South Asia. In 2017, China had the largest share of exports to the Asian Oceania region, at $390.06 billion, accounting for 50.4% of China's exports to the "Belt and Road" countries, due to the overall development of the region's economic level, the market is more open, and the geographical location is adjacent to China, so the trade cost is low and the market is huge. On the contrary, exports to Central and Eastern Europe accounts for only 12.7%, because although the region is mature and open, it is far away from China and has higher transportation costs, which makes many industries unable to export or are not selected under the principle of proximity. In Western Asia and Africa, for their part, trade volumes have declined as a result of security factors caused by political unrest.
181 287 321 348 385 417 428 450 680 716 0 200 400 600 800 Turkey United Arab Emirates Philippines Indonesia Thailand Malaysia Russia Singapore India Vietnam
4. Trade facilitation level calculation of "Belt and Road" countries
4.1 Trade facilitation indicator system 4.1.1 Construction Principles
Scientificity. Specifically, in the construction process, each indicator should be conformed to consist with facts, to ensure the authenticity and comprehensiveness of the final results. Accessibility. There are some indexes whose data cannot be easily obtained or are missing in the database, so it is necessary to consider whether this index can be replaced by similar ones, which is also the flexibility in data acquisition. Systematicness. Means that the whole system should be systematic and organized to a certain extent, and indicators should be classified and sorted.
4.1.1 Data selection
Portugal-Perez and Wilson (2010) established a trade facilitation index system including Physical infrastructure, Information and Communications technology, Border and transport efficiency, Business and regulatory environment and other indicators, measured the actual trade facilitation situation of more than 100 countries in the world. According to The Global Enabling Trade Report published by The World Economic Forum, four primary indicators: Market access, Border administration, Infrastructure and Operating environment are selected, and seven specific secondary indicators are included.
In the indicator system to be constructed in this paper, not only uses the relevant experience in the selection of the above two established indicators for reference, but also comprehensively considers the economic and trade characteristics of the countries along the “Belt and Road”. As a result, five representative indicators are selected, which are: Regulatory environment, Infrastructure, Border administration, Business environment and Information and communications technology (ICT).
Among the five first-level indicators in the index system constructed, a total of 14 second-level indicators (Appendix I) are included. Regulatory environment refers to the current system and legal environment of a country, is divided into "Intellectual property
protection,", "Transparency of gov. Policymaking" and "Burden of gov. Regulation" these three secondary indicators. Infrastructure mainly measures the economic foundation of a country and the convenience of transportation. Border administration has a direct influence on commodity clearance efficiency, and at the same time reflects the tax level of the economy as well as transit management, which can be divided into "Irregular payments and bribes" and "Burden of customs procedures". Business environment is a description of the country's overall trade opening degree, trade barriers and financial help, which is divided into "the Trade tariffs", "Prevalence of non - trade-related barriers" and "Ease of access to loans". Information and communication technology is an important performance of technological and economic development, which is divided into "Availability of latest ICT technology" and "Extent of business Internet use". All the indicator data has the corresponding code in Global
Competitiveness Report, as detailed in Appendix II. The corresponding value range is
between 1-7 or 1-100 and 7 or 100 represents the best. 4.1.2 Data processing
In the index system constructed, there are some differences in some data intervals, so in the calculation of trade facilitation index, this dissertation uses indexation method to process the data. First, by using the π = πk/ πmax formula to unify the interval of all
parameters into [0,1], where π is a new parameter of secondary indicator after processing, πk is the raw data collected, πmax is the actual value of the country with the largest value in selected secondary indicator. Secondly, a simple arithmetic averaging method is used to process the new parameters, and the five primary parameters of RE, IN, BA, are and ICT are obtained respectively. Finally, the final trade facilitation Index (TFI) can be obtained by also using a simple arithmetic average to process five primary parameters (All parameter values should be within the [0,1] interval).
4.2 Calculation and analysis of trade facilitation level
Due to the availability of data, 50 countries (including China) along the “Belt and Road” are selected as research samples to calculate the trade facilitation index. At last,
the level of trade facilitation in the countries along the "Belt and Road" during 2013-2017 to be demonstrated in the Appendix (App. III).
We can refer to the classification criteria for trade facilitation levels in previous studies, TFI<0.6 represents low levels of trade facilitation, 0.6≤TFI<0.7 represents a medium level, 0.7≤TFI<0.8 represents a high level of trade facilitation, 0.8≤TFI indicates a very high level of trade facilitation. In terms of data for these five years, Singapore, the UAE, has been at the forefront, which is likely to be linked to locally implemented policies. Since the severe recession in 2001, the Singaporean government has been striving to transform into a knowledge-based economy and becomes a global "Free Port". In order to promote its own exports, the UAE has established trade relations with 179 countries and regions around the world, and 6 of its 7 Emirates have set up free trade zones in their own regions. The higher the level or trend of economic development in countries and regions, the more developed its trade will be, such as other top-ranked countries: Qatar, Saudi Arabia, China, Bahrain, etc., and their trade facilitation levels are much higher than those of Nepal, Bangladesh, Cambodia, etc., the mutually reinforcing role between the level of trade facilitation and economic development is amply demonstrated.
The “Belt and Road” area, during 2013-2017, the trade facilitation level of each country only fluctuated within a narrow range and the level of trade facilitation of countries with different levels of economic development is also slightly different. Of the 50 countries selected, 26% were at a low level, 40% were at the middle of the list, 20% had a high level and only 14% had extremely high levels of trade facilitation, most of which were concentrated within the 0.6~0.8 range. The results of this measurement are in line with the real economic situation, because the more developed countries, the more abundant the funds, the better their infrastructure construction and economic superstructure environment and naturally, their international trade development is also higher.
5. Analysis and Empirical Test
5.1 Gravity model settings
The initial source of the gravity model was Newton's law of gravitation, which was applied to academic research in physics, after which the gravity model was introduced into the field of international trade.Isard&Peck (1954) and Beckerman (1956) believe that, in terms of geographical factors, the closer the location of two countries, the more conducive to trade between the two countries, the more frequently trade is carried out, the greater the scale of trade will be formed. Tinbergen (1962) and Poyhonen (1963) concluded that the size of trade between regions and their total economic volume, that is, GDP, is positively correlated. Linnemann (1966) transformed the traditional trade gravity model, added the population variable to the model, and then proved the positive correlation between trade volume and population through empirical evidence.
The basic formula of the trade gravity model is:
Tij = α0YiYjDijAij (5.1)
Among them, Tij is the trade flow between two countries, Yi represents the gross
domestic product of country I, Yj is the gross domestic product of Country J, Dij is the
distance between country I and J, Aij as other variables.
After logarithmic deformation of the formula, the following are obtained:
lnTij = eα0+α1lnYi+α2lnYj+α3lnDij+α4lnAij+uij (5.2)
Among them, α0 is a constant, α1, α2, α3 are elastic coefficients, uij is a random error
term. The deformed model can directly show the connection between the explanatory variables and the explained variable, and the coefficient values of explanatory variables indicate the degrees of their influences on the explained variable.
5.1.1 Variable selection
During research of this dissertation, which is, the impact of the trade facilitation level on China's export trade along the " Belt and Road" in 2013-2017, according to the characteristics of the regions, and in view of the availability of data, the selected variables are mainly Gross Domestic Product, distance, population size, level of trade
facilitation, tariff rate; policy and public boundaries are selected as virtual variables. The model is set to:
lnEXPjt = eα0+α1lnGDPjt+α2lnPOPjt+α3lnDISij+
α4TARjt+α5lnTFIjt+α6POLjt+α7BORjt+uij (5.3)
1. EXPjt is the export volume of China to country J during the period t, and it is the
explained variable of the gravity model in this paper. Through the empirical analysis of other explanatory variables such as trade facilitation, the influence of explanatory variables in the model on export is tested. The data comes from the United Nations COMTRADE and the unit is dollar.
2. GDPj is the gross domestic product of country J in period t, which can directly
reflect the economic scale and trade demand of a country and is positively correlated. The data comes from the World Bank database and the unit is dollar.
3. POPjt is the total population of country J in period t. The more people there are
in a region, the more demand there is for consumption and the more trade. At the same time, the abundant labor force reduces production costs and promotes trade. This data comes from the World Bank database and the unit is person.
4. DISjt represents the distance between China and the capital of country J. Data
from CEPII and the unit is kilometer.
5. TARjt represents the average tariff of country J during period t. Generally
speaking, the lower the average tariff is, the higher the economic aggregate is. This variable shows a negative correlation. Data from the Global Competitiveness Report.
6. TFIjt is the trade facilitation index. The role of trade facilitation lies in eliminating
trade barriers between economies as much as possible, creating a better business environment, and promoting trade by improving infrastructure and adopting trade measures. Therefore, this variable is positively correlated. Data from the calculation of the last chapter in this dissertation (Appendix III).
7. POLjt is a dummy variable, representing whether China has signed a mutually
of 1; otherwise, it takes the value of 0. The data comes from China Free Trade Zone Service Network.
8. BORjt is a dummy variable, which indicates whether China and country J have a
common border, that is, whether they share borders. If two countries are adjacent, the transportation cost will be greatly reduced, which is conducive to export trade. Therefore, the expected coefficient of this variable is positive. If the two countries share a common border, value 1, and vice versa.
Diagram5.1- Variables and sources
In addition, since the research object of this paper is China's export trade, relevant data of China are not included in the model.
5.2 Empirical test
Based on the above statistical analysis, this section conducts an empirical analysis of the impact of trade facilitation in the regions along the “Belt and Road” on China's export. In addition to the overall situation of the areas along the route, this section also carries out a comprehensive and in-depth study of this issue within both regional and factorial aspects.
5.2.1 Influence of overall trade facilitation level on China's export trade
Variable Data source
EXPjt UN Comtrade
GDPjt the World Bank
POPjt the World Bank
DISij CEPII
TARjt Global Competitiveness Report
TFIjt Calculation in Chapter IV
POLjt China FTA Network
This paper uses SPSS V25 to conduct regression analysis of panel data of 49 countries along "Belt and Road" based on random effect, and applies the extended trade gravity model (5.3) to conduct the empirical test, results as follows:
Table III
Model Summary of Regression
The regression results of the above output show that the complex correlation coefficient R is 0.888, which reflects a very large degree of linear correlation between all independent variables (lnGDP, lnPOP, lnDIS, lnTAR, lnTFI, POL, BOR) and dependent variable (China’s export). The determination coefficient R Square is 0.788, indicating that the influence of countries along "Belt and Road" on China's export trade accounts for 78.8%. It can be seen that the trade gravity model constructed in this paper is feasible and has practical significance.
Table IV
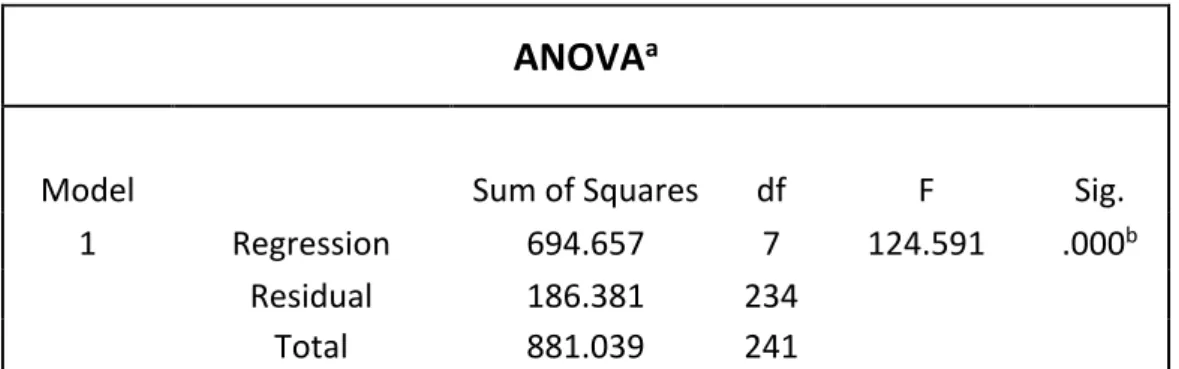
ANOVA Test for the equation
Model Summary
b Model R R Square Adjusted R Square Durbin-Watson 1 .888a 0.788 0.782 0.481a. Predictors: (Constant), BOR, lnGDP, POL, lnTAR, lnTFI, lnDIS, lnPOP
b. Dependent Variable: lnCHNEXP
ANOVA
aModel Sum of Squares df F Sig.
1 Regression 694.657 7 124.591 .000b
Residual 186.381 234
ANOVA is the result of variance analysis to test the overall significance of the regression model, in which the F statistic is 124.591 and the p value is < 0.001, which means under the test level α =0.05, it can be considered that the fitted multiple limit regression equation is statistically significant.
Table V Coefficients of the Model
In the Coefficients table of the results output, it is shown that p values of partial regression coefficient test of all variables and constant terms are <0.05, indicating that they are statistically significant and can be included in the final regression model. Meanwhile, the significance of the Standardized Coefficients of output lies in Standardized regression Coefficients that can compare the effects of different independent variables on dependent variables.
a Dependent Variable: lnCHNEXP
b Predictors: (Constant), BOR, lnGDP, POL, lnTAR, lnTFI, lnDIS, lnPOP
Coefficients
a Unstandardized Coefficients Standardized Coefficients t Sig. B Beta (Constant) 14.422 6.364 0 lnGDP 0.719 0.599 6.943 0 lnPOP 0.288 0.249 2.706 0.007 lnDIS -1.682 -0.357 -7.228 0 lnTAR -0.188 -0.102 -2.52 0.012 lnTFI 1.417 0.116 2.213 0.028 POL 0.587 0.118 3.023 0.003 BOR 0.065 0.217 5.145 0Based on the analysis of the above results, the final multiple linear regression equation can be written as:
lnEXP =14.422+0.719lnGDP+0.288lnPOP-1.682lnDIS-0.188lnTAR+1.417lnTFI+0.587POL+0.065BOR
Table VI
Summary of Regression Results
Variables β 95%CI P value (sig)
lnGDP 0.719 (0.515,0.923) <0.001 lnPOP 0.288 (0.078,0.498) 0.007 lnDIS -1.682 (-2.140,-1.223) <0.001 lnTAR -0.188 (-0.335,-0.041) 0.012 lnTFI 1.417 (0.156,2.679) 0.028 POL 0.587 (0.204,0.969) 0.003 BOR 0.065 (0.047,0.0657) <0.001
1.Gross Domestic Product of the importing country (GDP): the regression coefficient is 0.719, which is significant. This shows that for countries along the "Belt and Road" route, when their GDP shows a growth trend, it will drive the growth of China's export trade. Moreover, for every 1% increase in the GDP of importing countries, China's export volume will increase by about 0.72%.
2. Total population of importing country (POP): the regression coefficient is 0.288. The results are significant. When the total population of importing country increases, China's export trade increases. This may be closely related to the composition of countries along the "Belt and Road" line. When the population increases, the size and diversification of its market demand increase, which is conducive to the development of international trade activities.
3. Distance between importing country and China (DIS): the regression coefficient is -1.682, with significant results. For every 1% increase in the distance between importing countries and China, the volume of export trade decreases by 1.7%. This shows that the distance has a great obstacle to China's export trade. With the increase of the distance, the transportation cost and time cost will become higher and higher, which will make the importing country turn to other countries to import goods. Therefore, distance has become an important factor restricting the trade between countries along "Belt and Road".
4. The average tariff rate of the importing country (TAR): the regression coefficient is -0.188, which is significant. This means that for countries along the "Belt and Road", a 1% increase in the average tariff rate of importing countries will reduce the volume of China's export trade by about 0.19%. This is mainly because the rise of tariff rate will lead to the increase of export prices, which will affect the competitiveness of products.
5. Import country's trade facilitation index (TFI): the regression coefficient is 1.417, which is significant. This demonstrates that for countries along the "Belt and Road", every 1% increase in trade facilitation level will increase China's export trade volume by about 1.42%. It can be clearly seen that the trade facilitation level of importing countries plays an obvious role in promoting China's export trade, which basically achieves the ultimate goal of the empirical test in this paper.
6. Whether to sign the free trade agreement with China (POL): the regression coefficient is 0.587, which is significant. When two countries sign bilateral or multilateral trade agreements, the cost of trade will be greatly reduced, and thus increase the volume of trade between the two countries.
7. Whether the importing country borders on China (BOR): the regression coefficient is 0.065, which is significant. This shows that in today's high-speed development of transportation technology, whether two countries are adjacent or not
will only have a slight impact on the trade and the geographical advantages are even less obvious
The expected signs of the above independent variables (i.e. positive and negative influences) are consistent with the above prediction. One in all positive factors, lnTFI regression coefficient is 1.417 and its 95% CI is (0.156, 2.679), shows that in the case of other factors unchanged, lnTFI value every increase 1, lnEXP increased by 1.417, which is higher than others who has a positive influence (lnGDP-0.719, lnPOP-0.288,
lnPOL-0.587). Obviously, compared with the trade facilitation, other factors that affect
China's export trade slightly insufficient, but still cannot be ignored. 5.2.2 Impact of regional trade facilitation levels on China's export trade
In addition to the impact of the overall trade facilitation level of countries along the "Belt and Road" on China's export trade, the analysis of the actual situation of various regions can more directly and clearly show the extent of its impact. This section divides the regions along the route into three parts: (1)East Asia, south Asia and southeast Asia, (2)Central Asia, west Asia and north Africa, and (3)Central and eastern Europe. Next, this paper will conduct research on the impact of trade facilitation on China's export trade according to the three regions divided, so as to draw more constructive conclusions and put forward feasible suggestions. The following table is the basis for the specific regions and divisions of 49 "Belt and Road" countries besides China selected in this chapter.
Area Countries Characteristics
East Asia, South Asia, Southeast Asia
Bangladesh, Bhutan, Cambodia, India, Indonesia, Laos, Malaysia, Mongolia, Nepal, Pakistan, Philippines, Singapore, Sri Lanka, Thailand, Vietnam
Close to China, Cultural and trade exchanges are frequent
Diagram 5.2- Countries in Detail
According to the above partition results, SPSS V25 is used to conduct regression for the three regions respectively. The total results are as follows:
Table VII
Regional Regression Results
Variables East Asia, South Asia, Southeast Asia
Central Asia, West Asia, North Africa
Central and eastern Europe (Constant) 20.671*** 25.027*** -10.818 GDP 0.596* 0.244* 0.538*** POP 0.477 0.726*** 0.544*** DIS -1.479*** -2.470*** -1.4 TAR -0.326* -0.275 -0.421*** TFI 1.658 2.139** 5.064*** POL 1.038*** \ \ BOR 0.46 0.11*** .457*** R-square 0.885*** 0.806*** 0.824*** Central Asia, West Asia, North Africa
Bahrain, Egypt, Israel, Jordan, Kazakhstan, Kuwait, Kyrgyzstan, Lebanon, Oman, Qatar, Saudi Arabia, Turkey, United Arab Emirates,
Mostly Islamic countries,
Culture is similar
Central and eastern Europe
Albania, Armenia, Azerbaijan, Bosnia and Herzegovina, Bulgaria, Croatia, Czech Republic, Estonia, Georgia, Greece, Hungary, Latvia, Lithuania, Moldova, Montenegro, Poland, Romania, Russia, Slovakia, Slovenia, Ukraine
Countries close to each other and with lots of communication
It can be seen from the above empirical results that the regression results of different regions have the same trend as the overall results, but there are obvious differences among different regions. For instance, one of the variables in importers — the total population. The population growth in southeast Asia for China's export trade of regression coefficient is not significant, and the absolute value is minimum, but this variable is significant in central Asia and central and eastern Europe and its promoting effect obviously. The reason is that China and south-east Asia region countries have signed a multilateral trade agreement, trade level is higher, so the number of people does not greatly affect the growth of exports. Another variable, distance, from the central Asia regional its regression coefficient is the biggest and significant, but in central and eastern Europe its absolute value minimum and not significant, reason is that Chinese commodities exported to central and eastern Europe are mostly independent from distance and their transportation developed, instead of goods exported to southeast Asia and central Asia in which the distance factor need more to be taken into account.
Among the above variables, the most obvious difference between regions is the trade facilitation index, in which the Central and Eastern European region has the highest level of trade facilitation, so the impact on China's exports is also the largest. The table shows that for every 1% increase in facilitation in south-East Asia, Central and Eastern Europe, China's exports to the region have increased by 1.66%, 2.14% and 5.06% accordingly. This result confirms once again that the level of trade facilitation in countries along the “Belt and Road”, both as a whole and in part, has the greatest impact on China's exports to them, so this factor should be given primary consideration in the study of relevant export policies.
5.2.3. The impact of sub-factors on China's exports in trade facilitation
In the Trade Facilitation Index system constructed in this paper, the five first-level indexes are: Regulatory environment, Infrastructure, Border administration, Business environment and Information and communications technology. In the case of limited
resources, to achieve optimal distribution requires a full understanding of the corresponding impact of different indicators, in order to be more practical and specific to the formulation and implementation of policy programmes. In this section, five indicators are brought into the trade gravity model respectively, and new index models are obtained on the basis of the 5.3 equation as follows:
lnEXPjt = eα0+α1lnGDPjt+α2lnPOPjt+α3lnDISij+
α4TARjt+α5lnREjt+α6lnPOLjt+α7lnBORjt+uij (5.4- Model 1)
lnEXPjt = eα0+α1lnGDPjt+α2lnPOPjt+α3lnDISij+
α4TARjt+α5lnINjt+α6lnPOLjt+α7lnBORjt+uij (5.5- Model 2)
lnEXPjt = eα0+α1lnGDPjt+α2lnPOPjt+α3lnDISij+
α4TARjt+α5lnBAjt+α6lnPOLjt+α7lnBORjt (5.6- Model 3) lnEXPjt = eα0+α1lnGDPjt+α2lnPOPjt+α3lnDISij+
α4TARjt+α5lnBEjt+α6lnPOLjt+α7lnBORjt+uij (5.7- Model 4)
lnEXPjt = eα0+α1lnGDPjt+α2lnPOPjt+α3lnDISij+
α4TARjt+α5lnICjt+α6lnPOLjt+α7lnBORjt+uij (5.8- Model 5)
Using SPSS V25, the regression results are shown in the table.
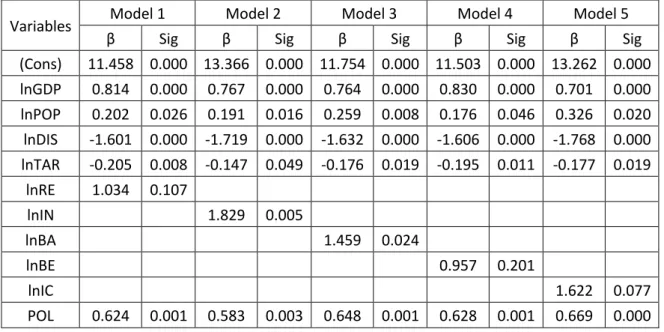
Table IIX
Sub-factorial Regression Results
Variables Model 1 Model 2 Model 3 Model 4 Model 5
β Sig β Sig β Sig β Sig β Sig
(Cons) 11.458 0.000 13.366 0.000 11.754 0.000 11.503 0.000 13.262 0.000 lnGDP 0.814 0.000 0.767 0.000 0.764 0.000 0.830 0.000 0.701 0.000 lnPOP 0.202 0.026 0.191 0.016 0.259 0.008 0.176 0.046 0.326 0.020 lnDIS -1.601 0.000 -1.719 0.000 -1.632 0.000 -1.606 0.000 -1.768 0.000 lnTAR -0.205 0.008 -0.147 0.049 -0.176 0.019 -0.195 0.011 -0.177 0.019 lnRE 1.034 0.107 lnIN 1.829 0.005 lnBA 1.459 0.024 lnBE 0.957 0.201 lnIC 1.622 0.077 POL 0.624 0.001 0.583 0.003 0.648 0.001 0.628 0.001 0.669 0.000
From the above regression results, all the models fitting is around 7.9, which shows that the model can respond to the reality more correctly. Among them, the most influential indicator of China's exports is Infrastructure (IN), which, for every 1% increase, can bring 1.829% of China's trade export increments to countries along the “Belt and Road”. The least influential is Business environment (BE), China increased its exports to the "Belt and Road" region by 0.96% when the indicator increased by 1%. In addition, Information and communications technology (IC) has a greater impact than Border administration, and Regulatory environment, indicating that in future trade, countries should more consider improving the competitiveness of telecommunications, network and other soft facilities to improve their own level of trade facilitation, so as to increase trade flows. The five specific trade facilitation indicators used in this paper rank the impact of China's trade exports to countries along the "Belt and Road": Infrastructure (IN) > Information and communications technology (IC) > Border administration (BA)> Regulatory environment (RE)> Business environment (BE).
BOR 0.075 0.000 0.041 0.000 0.128 0.000 0.047 0.000 0.085 0.000