3D AND TRANSIENT NUMERICAL MODELING OF DOOR OPENING AND
CLOSING PROCESSES AND ITS INFLUENCE ON THERMAL
PERFORMANCE OF COLD ROOMS
R. CARNEIRO
(*), P. D. GASPAR
(*), P. D. SILVA
(*)(*) University of Beira Interior, Edifício I das Engenharias Calçada Fonte do Lameiro nº 1, Covilhã,
6201-001, Portugal [email protected]
ABSTRACT
The need of rationalize energy consumption in agrifood industry has fasten the development of methodologies to improve the thermal and energy performances of cold rooms.
This paper presents a 3D transient Computational Fluid Dynamics (CFD) modelling of a cold room to evaluate the air infiltration rate through sliding doors. A species transport model is used for modelling the tracer concentration decay technique. Numerical predictions indicate that air temperature difference between spaces affects the air infiltration. For this case study, the infiltration rate increases 0.012 m3 s-1 per K of air temperature
difference. The knowledge about the evolution of air infiltration during door opening/closing times allows to draw some conclusions about its influence on the air conditions inside the cold room, as well as to suggest best practices and simple technical improvements that can minimize air infiltration, and consequently improve thermal performance and energy consumption rationalization.
1.
INTRODUCTION
The refrigeration of food products is associated with the need to preserve its quality. Storing food products in cold rooms, i.e., within an environment with controlled atmospheric conditions, ensures the product quality and safety during more time (Sun, 2007). Temperature is one of the most important parameters of the inner conditions of cold rooms. Storage at appropriate temperatures according to the type of product increases substantially its lifespan from a few days until months (Stoecker, 1998).
In the daily operation of any agrifood company is indispensable the repeated opening and closing of cold rooms doors for handling food products (storage or removal). This opening causes a natural convective airflow which is due to temperature difference and hence of difference densities between the inside air and outside air. As the density of the air inside the refrigeration room is higher than the outside air, the increasing height of the door will cause a faster increase of the pressure value in the air inside the refrigeration room than outside it. Associated to the air flows between the interior and the exterior of the refrigeration room, there is a combination of latent heat and sensible heats transfer. The sensible heat transfer occurs precisely because there is a temperature difference between the outside and inside air masses. The latent heat transfer is related to the moisture content of the air income from outside. In addition of being considered as a thermal load, it may also, in certain situations (case of freezing chambers), imply the condensation and subsequent frost formation on the evaporator surface (Stoecker, 1998; Sun, 2007). Thus, the door opening and closing cycles for storing or removing of food products from cold rooms implies a thermal load associated to air infiltration. This air infiltration is responsible for a large amount of thermal load that has to be removed from the inside environment using a refrigeration system. The energy consumption of this refrigeration system increases with the thermal load that must be removed. Evans et al. (2014) conducted a study to characterize the energy consumption of cold stores. Energy audits in cold stores of several European countries were performed to identify possible energy savings measures and practices. Infiltration/protection of doors represented about 8.3% of problems identified in cold rooms with a volume higher than 100 m3. An average energy saving from 6% to 17% was
estimated with the implementation of simple maintenance practices and/or improvement on the cold room doors.
The need of rationalize the energy consumption in the agrifood industry sector has fasten the development of methodologies to improve the thermal and energy performances of cold rooms. Several studies considered the development of analytical models to quantify the infiltration load over time. Table 1 includes the empirical
mathematical expressions to determine the air infiltration, I [m3s-1]. All equations have a common set of
variables. The density is an example, once the infiltration rate is directly related to the difference of density between the air of the interior, i, and external, o, environments. In addition, the opening area, A [m2], the
height of the door, H [m], and the acceleration of gravity, g [ms-2], are variables common to all equations. The
main difference between equations is the infiltration coefficient obtained by each author through experimental studies (Sun, 2007).
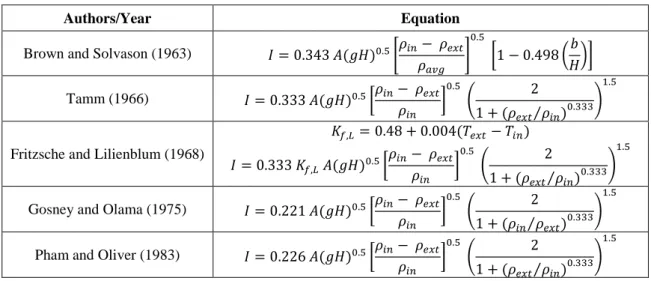
Table 1. Analytical air infiltration models by natural convection through the door opening.
Authors/Year Equation
Brown and Solvason (1963) 𝐼 = 0.343 𝐴(𝑔𝐻)0.5[𝜌𝑖𝑛− 𝜌𝑒𝑥𝑡 𝜌𝑎𝑣𝑔 ] 0.5 [1 − 0.498 (𝑏 𝐻)] Tamm (1966) 𝐼 = 0.333 𝐴(𝑔𝐻)0.5[𝜌𝑖𝑛− 𝜌𝑒𝑥𝑡 𝜌𝑖𝑛 ] 0.5 ( 2 1 + (𝜌𝑒𝑥𝑡⁄𝜌𝑖𝑛) 0.333) 1.5
Fritzsche and Lilienblum (1968)
𝐾𝑓,𝐿= 0.48 + 0.004(𝑇𝑒𝑥𝑡− 𝑇𝑖𝑛) 𝐼 = 0.333 𝐾𝑓,𝐿 𝐴(𝑔𝐻)0.5[ 𝜌𝑖𝑛− 𝜌𝑒𝑥𝑡 𝜌𝑖𝑛 ] 0.5 ( 2 1 + (𝜌𝑒𝑥𝑡⁄𝜌𝑖𝑛) 0.333) 1.5
Gosney and Olama (1975) 𝐼 = 0.221 𝐴(𝑔𝐻)0.5[𝜌𝑖𝑛− 𝜌𝑒𝑥𝑡 𝜌𝑖𝑛 ] 0.5 ( 2 1 + (𝜌𝑖𝑛⁄𝜌𝑒𝑥𝑡)0.333 ) 1.5
Pham and Oliver (1983) 𝐼 = 0.226 𝐴(𝑔𝐻)0.5[𝜌𝑖𝑛− 𝜌𝑒𝑥𝑡 𝜌𝑖𝑛 ] 0.5 ( 2 1 + (𝜌𝑒𝑥𝑡⁄𝜌𝑖𝑛) 0.333) 1.5
Computational Fluid Dynamics (CFD) modelling has been progressively adopted by engineering due to its remarkable capabilities to predict details of fluid flow with heat and mass transfers. This technique was been applied to analyse the influence of the air infiltration in refrigerated facilities. Foster et al. (2002, 2003) conducted experimental and numerical studies of air infiltration through doors of different sizes and with two different temperatures inside cold rooms. Results were compared with results of analytical and CFD models. The tracer gas concentration decay method was used in the experimental tests. Gonçalves et al. (2012) performed a numerical study of the influence of air curtains in the obstruction to the infiltration of thermal loads to the interior of a cold room. For the different simulated case studies, the air curtains placed outside the cold room had better thermal performance. Air curtains with vertical jet have a greater efficiency (> 70%) than the air curtains with horizontal jet (about 55%). Gaspar et al. (2011) investigated the effect of ambient air conditions in the thermal performance and energy efficiency of vertical open refrigerated displays cabinets (ORDC) and it air curtain that provides a barrier to the external environment. Additionally, Gaspar et al. (2012a) developed a comprehensive and detailed CFD modelling of airflow and heat transfer in an ORDC. Subsequently, Gaspar et al. (2012b) introduced modifications in the CFD model related to low cost geometrical and functional characteristics to perform parametric studies with the aim to predict improvements of the global performance and energy efficiency. Orlandi et al. (2013) performed a 3D numerical study of a closed refrigerated display cabinet with an air curtain and fir with different types of doors, hinged and sliding doors to evaluate the air infiltration during doors opening. These studies contributed greatly to improvement of the perception of this type of phenomena and its influence on the performance of refrigeration equipment. Additionally, the approaches used in these studies serve as a theoretical supplement to the development of numerical models, thereby facilitating the approach in certain parameters that influence the results accuracy. The study presented in this paper extends the abovementioned research results by using a 3D transient CFD model to evaluate the air infiltration rate into cold rooms during the opening and closing cycles of sliding doors with L×H = 1.2×2.2 m2. The influence of the air infiltration rate during the door opening/closing cycles on the
inner air temperature of the cold room is evaluated by setting different values for the antechamber air temperature. Additionally, the influence of the air infiltration rate on the air temperature field variation inside the cold room relatively to a reference model, Tin = 273.15 K and Text = 288.15 K, for a sliding door typology
(sensitivity analysis) is determined. The predictions of the numerical model for the reference case study are validated by comparison with results of analytical models shown in Table 1.
The novelty of the study is based on the use of the species equation for modelling the transport of a tracer gas. The tracer gas concentration decay method is used to determine the air infiltration rate through the sliding door of the cold room. The knowledge about the evolution of the air infiltration during the door opening/closing
times, allows drawing some conclusions about its influence on the air conditions inside the cold room. Besides promoting the adoption and development of equipment with better efficiency, it can be used to suggest costless best practices and simple technical improvements that can minimize air infiltration, and consequently improve thermal performance and energy consumption rationalization.
2.
MATERIALS AND METHODS
This study required the development of a 3D transient CFD model of a cold room. The physical-mathematical formulation uses a set of coupled non-linear partial differential equations, describing mass, momentum and energy conservation, together with initial and boundary conditions. The finite volume method was used solve the mathematical model. The CFD Ansys Fluent code (Ansys, 2011) was used to implement both mathematical and numerical formulations. As the air infiltration is due to natural convection, the airflow regime was considered laminar and the fluid, air, behaves as an ideal and incompressible gas.
2.1. Geometry and Computational Mesh
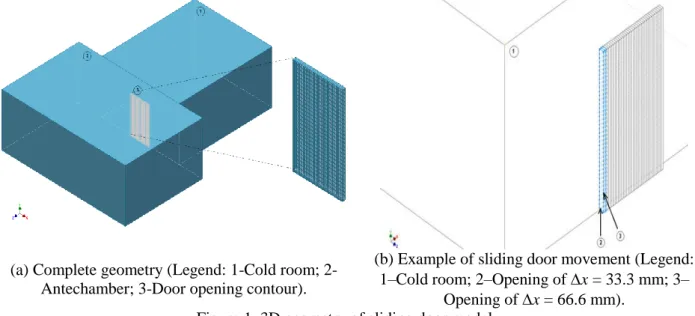
The cold room model has a geometry approximated to a real case but with some assumptions to reduce the computational cost of the CFD model without affecting the quality and accuracy of results. The simulation times defined for door opening, remaining open and closing periods were determined by Nunes et al. (2014). The 3D geometry (see Figure 1) consists of two adjacent rooms, the interior volume geometry (cold room),
Vin = 96 m3, and the outside volume (antechamber, Vext = 128 m3. It should also be highlighted that the model
considered only these volumes and the door geometry (A = 1.22.2 m2). The walls were considered adiabatic
and the cold room is hermetic, because the focus of the study is the analysis of the natural convection fluid flow through the door opening. Additionally, the model simplification allows a substantial decrease of the computational cost without affect the accuracy of results. For the region that represents the door, 36 individual geometries were created where each one corresponds to a different door position during the door opening/closing cycle (in each time step). Therefore, for a sliding door of 1,200 mm length (opening) each of the geometries has an approximate width of 33.3 mm.
An unstructured mesh composed by 2,818,425 tetrahedral elements and 494,475 nodes was created. This type of mesh is proper to the geometry complexity and ensures a better refinement in regions where high gradients are expected.
(a) Complete geometry (Legend: 1-Cold room; 2-Antechamber; 3-Door opening contour).
(b) Example of sliding door movement (Legend: 1–Cold room; 2–Opening of x = 33.3 mm; 3–
Opening of x = 66.6 mm).
Figure 1. 3D geometry of sliding door model.
2.2. Procedure of Opening and Closing Doors
The door opening and closing movements defined in simulations occurs at each time step. The average opening/closing times determined in work field can be described as follows: door opens from t = 0 to 3 sec, remains fully open during t = 8 sec, i.e. up to 11 sec, and closes in t = 3 sec., i.e. at 14 sec. the door is fully closed. Knowing that door movement is performed in steps of x = 33.3 mm, the time step corresponds to t = 83.3 msec. To simulate the door movement at each t = 83.3 msec is necessary to change boundary
opening/closing. The model starts from a steady state all over domain, with air temperature of Tin = 273.15 K
inside the cold room and Text = 288.15 K in the antechamber. Regarding to the tracer gas concentration, inside
the chilled space was set as Ctracer = 0.5% and on the antechamber, Ctracer = 0.0%.
2.3. Species Transport Model
The species transport model is one of the most important in this numerical model since it allows defining a mixture of "air + tracer gas". The new fluid, "tracer", has the same properties of air. The model is used to set the species transport depending on pressure variations. The tracer gas concentration decay technique involves in practice the injection of predetermined concentration, C1, of a tracer gas inside a hermetic room. This value,
final concentration after setting an opening, C2, and the time between measurements, t, allow calculating the
air infiltration rate, I, in the cold room of volume, V, using eq. (1) as described by ISO 12569:2012 or (ISO, 2012) ASTM E741-11 (ASTM Std, 2009) standards.
1 2 ln C V I t C (1)
3.
RESULTS AND DISCUSSION
3.1. Sensitivity Analysis
The sensitivity analysis determines the effect of air temperature outside the cold room on the air infiltration rate. First, the simulation of the reference model was performed, which air temperature outside the cold room is Text = 288.15 K. This value is usually found in antechambers of cold rooms. Subsequently, were developed
two models that consider a decrease and an increase of one unit of the air temperature value outside the cold room, i.e., Text = 287.15 K and Text = 289.15 K, respectively.
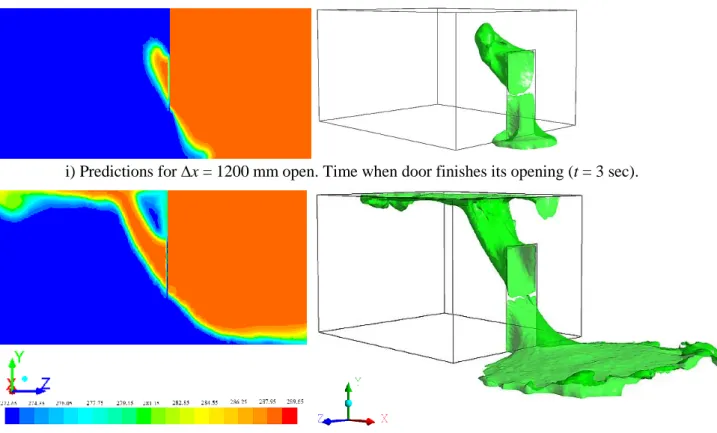
Figure 2 shows the air temperature field inside the cold room in the yz plane for x = 2750 mm, corresponding to the middle of the door opening (see Figure 2 a), and the tracer gas flow in a 3D perspective of the computational domain, in the Ctracer = 0.25% iso-surface concentration (see Figure 2 b).
i) Predictions for x = 1200 mm open. Time when door finishes its opening (t = 3 sec).
ii) Predictions for x= 1200 mm open. Time when door starts to close after being opened 8 sec (t= 11 sec).
(a) Temperature field (K) in yz plane,
x = 2750 mm.
(b) Iso-surface of tracer gas concentration of 0.25%. Figure 2. Numerical predictions for sliding door model.
In Figure 2 can be distinguished two instants, the instant for t = 3 sec (see Figure 2 i) that corresponds to the end of opening movement of the door. In this figure is predicted the existence of a neutral pressure line, above which the hot air flows from the external environment into the cold room due to the faster decreasing pressure inside the cold room than in the outside. Below the neutral pressure line, the air flows in opposite direction, from the interior to the exterior of the cold room, since the pressure inside the cold room increases more rapidly than in the outside. It is also possible to predict the formation of vortex in the zone above the neutral line. The other instant corresponds to t = 11 sec (see Figure 2 ii) in which also can be predicted the neutral pressure line. At this time, the airflow entrainment is further developed, since the door was fully opened during 8 sec. It is shown on the temperature field that the outside air infiltrated into the cold room rises and moves along the ceiling, since it has higher temperature (lower density) than remaining air, creating a layer of warm air near the ceiling. As the air temperature decreases, the air moves downwardly along the walls of the cold room. The air that leaves the cold room has lower temperature (higher density) than the air outside, therefore, the air moves along the bottom zone of the outer room. The existing vortex in the upper zone of the cold room is more developed, being its existence more noticeable.
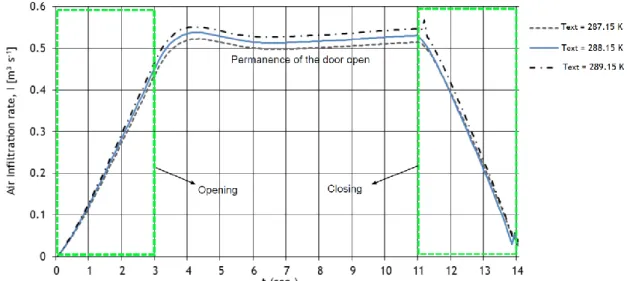
Figure 3 shows the numerical predictions of air infiltration rate profile during the door opening/closing cycle for different air temperatures outside the cold room. The results analysis suggests that higher the difference of air temperature between two rooms, higher is the air infiltration rate at each time step. Therefore, the difference of air temperature between two rooms and the increase/decrease of exchange area during door opening/closing movements lead to a huge airflow between two environments. According to Table 2, the time that the average air infiltration rate is greater corresponds to the time when the door is kept fully open by 8 sec regardless the air temperature inside the cold room. Table 2 shows the linear correlations to calculate the air temperature inside the cold room for each step of the cycle (opening, remain open and closing).
Figure 3. Numerical results of air infiltration rate profile in cold room at each time step for different air temperatures outside the cold room.
Table 2. Air infiltration rate and cold room air temperature correlations. Antechamber air
temperature, 𝑻𝐞𝐱𝐭
(K)
Air infiltration rate, I (m³s-1)
Opening t 0 3 sec Remain open t 3 11 sec Closing t 11 14 sec 287.15 0.210 0.505 0.287 288.15 0.219 0.520 0.282 289.15 0.227 0.535 0.304 Correlation 𝑇in = 0.0028t + 273.13 𝑇in = 0.0066t + 273.01 𝑇in = 0.0035t + 274.44
The results show that, on average, for each K of air temperature increase outside the cold room (or air temperature difference between two rooms), the air infiltration rate through the door opening increases 0.012 𝑚³𝑠−1, i.e., 12 liters s-1, considering a sliding door with an area of A = 2.64 m2. At the end of the cycle,
Itotal = 68.0 m3s-1 and Itotal = 70.6 m3s-1 for Text = 287.15 K, Text = 288.15 K and Text = 289.15 K, respectively.
So, in relation to the reference model (Text = 288.15 K), the total air infiltration rate decreased 2.3% and
increased 3.7% respectively decreasing and increasing the air temperature outside the cold room by 1 K. A similar analysis can be performed concerning the average air temperature inside the cold room. At the end of the cycle, the average air temperature inside the cold room is Tin = 273.93 K, Tin = 274.03 K and Tin = 274.11 K, for Text = 287.15 K, Text = 288.15 K and Text = 289.15 K, respectively. Thus, on average, for
each K of air temperature increase outside the cold room (or air temperature difference between two rooms), the air temperature inside the cold room increases Tin = 0.09 K, considering a sliding door with an area of A = 2.64 m2. Table 3 shows the linear correlations to calculate the air infiltration rate and the air temperature
inside the cold room as function of the air temperature outside it.
Table 3. Correlations for air infiltration rate and cold room air temperature.
Type Correlation
air infiltration rate, I (m³s-1) I = 0.0121 T
ext – 3.0884
cold room air temperature, Tin (K) Tin = 0.0873 Text – 24.279
The air temperature inside the refrigerated space is affected by the door opening/closing cycles that lead to warm air infiltration into the cold room. Thus, its evaluation and quantification may promote actions and solutions to reduce the operating frequency of the refrigeration system, and consequently the reduction of energy consumption and longer products safety. To control of atmospheric conditions such as air temperature outside the cold room (use of antechambers), other solutions may be considered that lead to the adoption of protective devices placed on the door opening creating a barrier that minimizes the air infiltration, such as air curtains, strip PVC curtains and flexible fast-opening doors. Regardless the devices that can be used to reduce air infiltration into the cold room, there is an aspect that should always be taken into account and, above all must be considered in any situation, which is the use of loading and unloading products maps. These maps promote methodical openings of the cold room when the quantity of products to load/unload justify it, avoiding unnecessary doors opening.
3.2. Comparison of numerical predictions with analytical results
This section presents the comparison between air infiltration rate through the door opening based on numerical model predictions (reference model) and calculated by analytical models shown in Table 1. The comparative results are shown in Figure 4.
Figure 4. Air infiltration rate profile into the cold room: Comparison of numerical predictions and analytical models results to sliding door case.
In general, the numerical model underestimate the air infiltration rate, excepting when results are compared with those obtained with the model developed by Fritzsche and Lilienblum (1968) during the permanence of door open and closing period. Foster et al. (2003) indicates that the models developed by Fritzsche and
Lilienblum (1968) and Gosney and Olama (1975) provide the closest predictions. Thus, by the comparison of numerical predictions and analytical models results can be concluded that the numerical model predicts closely the air infiltration rate. Thus, based on analysis performed for the air infiltration through the sliding door it seems that analytical models do not consider small perturbations such as vortices and oscillations that promoted by the thermal entrainment and then,for a given opening area, the air infiltration value does not include these effects. Given the transient nature of the numerical model equations, there are small variations of air infiltration rate due to these effects, turning this model more realistic. In order to perform a more complete analysis of the comparison between numerical predictions and analytical models results, two distinct tests were carried out that aim to evaluate the percentage variation of total air infiltration rate at different periods (%var). The first
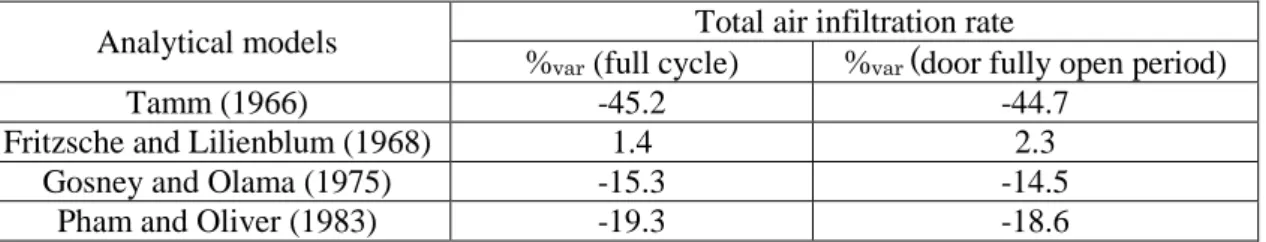
test corresponds to the entire door opening/closing cycle, i.e., the total air infiltration rate obtained with numerical and analytical models corresponding to the complete cycle will be compared. Subsequently, the variation percentages are calculated relatively to the total air infiltration rate obtained by the analytical models. The second test corresponds to calculate these variation percentages for the period when door remains fully open (3 sec < t < 11 sec). Table 4 shows the results for both cases. Comparing the percentage deviation between the numerical predictions and analytical models, it appears that the numerical predictions are accurate due to the proximity to the results obtained with Fritzsche and Lilienblum (1968) and Gosney and Olama (1975) models, which are considered as the most accurate (Foster et al., 2003). Comparing the percentage variation of total air infiltration rate relatively to the Fritzsche and Lilienblum (1968) model, it is possible to conclude that for the sliding door case, the total air infiltration rate calculated based on numerical predictions is greater 1.4% and 2.3% at the end of the cycle and during the period which door remains fully opened, respectively. Comparing the results with the Gosney and Olama (1975) model, the air infiltration rate calculated based on numerical predictions is 15.3% and 14.5% lower for the same tests. Therefore, the numerical model predictions are in agreement with the analytical models results due to its proximity. In addition, the numerical modelling can predict the air infiltration rate in a transient regime taking into account the 3D effects of the flow and other effects that affect the linearity of the results.
Table 4. Percentage comparison of total air infiltration rate predictions with analytical models results for a sliding door during all cycle and during the period for door fully open.
Analytical models % Total air infiltration rate
var (full cycle) %var (door fully open period)
Tamm (1966) -45.2 -44.7
Fritzsche and Lilienblum (1968) 1.4 2.3
Gosney and Olama (1975) -15.3 -14.5
Pham and Oliver (1983) -19.3 -18.6
A comparison of the air infiltration rate through the door opening into the cold room obtained by numerical model predictions with the results of analytical models indicates that the air infiltration rate has a variation profile over the time depending on the opening area, however the analytical models results admit it as being permanent. The comparison and evaluation of the numerical models predictions and the results of the most precise analytical models (Fritzsche and Lilienblum, 1968; Gosney and Olama, 1975) results allowed concluding that the numerical model predict accurately the air infiltration rate.
4.
CONCLUSIONS
This paper presents the 3D transient CFD modelling of a cold room to evaluate the air infiltration rate through sliding doors. The novelty of this study is based on the use of the species equation for modelling the transport of a tracer gas. The tracer gas concentration decay method is used to determine the air infiltration rate through the sliding door of the cold room.
Sensitivity analysis allows conclude that higher the difference of air temperature between the two spaces, greater will be the air infiltration rate and, subsequently, greater will be the increasing of air temperature inside the cold room.
The use of CFD method offered flexibility to this application, since it allows the simulation of the tracer gas to enable the calculation of the air infiltration rate through the concentration decay method. The transient predictions of the tracer gas concentration were obtained each time step, i.e., every 83 msec, providing a detailed and almost continuous profile of the parameter variation. The acquisition frequency using an experimental tracer gas would be much larger. Associated with experimental measurements there are always
errors from measuring instruments, leaks that over- or underestimate the air infiltration rate, among other aspects associated with difficulties encountered in the experimental testing. This CFD modelling of an experimental technique obtained results that are more accurate during all the door opening/closing cycle, allowing to trace a variation profile of the air infiltration rate into the cold room.
5.
REFERENCES
Ansys. 2011, Ansys Fluent 14 User's Guide.
ASTM E741-11. 2011, Standard Test Method for Determining Air Change in a Single Zone by Means of a Tracer Gas Dilution, ASTM Standard.
Brown WG, Solvason KR. 1963, Natural convection in openings through partitions-1, vertical partitions.
International Journal of Heat and Mass Transfer 5:859-868.
Evans JA, Hammond EC, Gigiel AJ, Foster AM, Reinholdt L, Fikiin K, Zilio C. 2014, Assessment of methods to reduce the energy consumption of food cold stores, Appl Therm Eng 62(2):697-705.
Foster AM, Barrett R, James SJ, Swain MJ. 2002, Measurement and prediction of air movement through doorways in refrigerated rooms, International Journal of Refrigeration 25(8):1102-1109.
Foster AM, Swain MJ, Barrett R, James SJ. 2003, Experimental verification of analytical and {CFD} predictions of infiltration through cold store entrances. Int J Refrig 26(8):918-25.
Fritzsche C, Lilienblum W. 1968, Neue messengun zur bestimmung der kalterluste an kuhlraumturen,
Kaltetechnik-Klimatiserung 20:279–86.
Gaspar PD, Gonçalves LC, Pitarma RA. 2011, Experimental analysis of the thermal entrainment factor of air curtains in vertical open display cabinets for different ambient air conditions, Appl Therm Eng 31(5):961-9.
Gaspar PD, Gonçalves LC, Pitarma RA. 2012a, Detailed CFD modelling of open refrigerated display cabinets,
Modelling and Simulation in Engineering, vol. 2012, Hindawi Publishing Corporation.
Gaspar PD, Gonçalves LC, Pitarma RA. 2012b, CFD parametric studies for global performance improvement of open refrigerated display cabinets, Modelling and Simulation in Engineering, vol. 2012, Hindawi Publishing Corporation.
Gonçalves JC, Costa JJ, Figueiredo AR, Lopes AMG. 2012, CFD modelling of aerodynamic sealing by vertical and horizontal air curtains, Energy and Buildings 52:153-160.
Gosney WB, Olama HAL. 1975, Heat and enthalpy gains through cold room doorways, Proc. IOR 72:31-41. ISO. 2012, ISO 12569:2012: Thermal performance of buildings and materials -- Determination of specific
airflow rate in buildings -- Tracer gas dilution method, International Organization for Standardization (ISO).
Nunes J, Neves D, Gaspar PD, Silva PD, Andrade LP. 2014, Predictive tool of energy performance of cold storage in agrifood industries: The portuguese case study, Energ Convers Manage 88:758-767.
Orlandi M, Visconti FM, Zampini S. 2013, CFD assisted design of display cabinets, Proc. of ICCC 2013, International Institute of Refrigeration (IIR), Paris, France.
Pham QT, Oliver DW. 1983, Infiltration of air into cold stores, Proc. of 16th ICR 4, 67-72. Stoecker WF. 1998, Industrial Refrigeration Handbook, New York, McGraw-Hill.
Sun D-W. 2007, Computational Fluid Dynamics in Food Processing, CRC Press, pp. 167-193. Tamm W. 1966, Kalterveluste durch kuhlraumoffnungen, Kaltetechnik-Klimatisierung 18:142-144.