Contents lists available atScienceDirect
Applied Soft Computing Journal
journal homepage:www.elsevier.com/locate/asoc
Towards an accurate sleep apnea detection based on ECG signal:
The quintessential of a wise feature selection
André Pinho
a,∗,
Nuno Pombo
a,
Bruno M.C. Silva
a,c,
Kouamana Bousson
b,
Nuno Garcia
d aInstituto de Telecomunicações, Universidade da Beira Interior, Covilhã, PortugalbUniversidade da Beira Interior, Covilhã, Portugal
cUniversidade Europeia, IADE, Av. D. Carlos I, 4, 1200-649, Lisboa, Portugal dInstituto de Telecomunicações, Universidade da Beira Interior, Covilhã, Portugal
h i g h l i g h t s
• Efficiency of feature selection and classification approaches in order to improve sleep apnea detection of Sleep Apnea moments on ECG.
• Feature extraction from the ECG to detect Sleep Apnea.
• Evaluation of different features to understand their importance. Comparison between different classification models to increase accuracy
a r t i c l e i n f o
Article history:
Received 24 December 2018 Received in revised form 27 May 2019 Accepted 8 June 2019
Available online xxxx
Keywords:
Sleep apnea
Electrocardiogram (ECG) Heart rate variability (HRV) ECG-derived respiration (EDR) Feature selection
Classification
Artificial neural network (ANN) Support vector machine (SVM) Linear discriminant analysis (LDA) Partial least squares regression (PLS) Regression analysis (REG)
Wiener–Hopf equation (wienerHopf) Augmented naive bayesian classifier (aNBC) Perceptron learning algorithm (PLA) Least mean squares (LMS)
a b s t r a c t
A wise feature selection from minute-to-minute Electrocardiogram (ECG) signal is a challenging task for many reasons, but mostly because of the promise of the accurate detection of clinical disorders, such as the sleep apnea. In this study, the ECG signal was modeled in order to obtain the Heart Rate Variability (HRV) and the ECG-Derived Respiration (EDR). Selected features techniques were used for benchmark with different classifiers such as Artificial Neural Networks (ANN) and Support Vector Machine(SVM), among others. The results evidence that the best accuracy was 82.12%, with a sensitivity and specificity of 88.41% and 72.29%, respectively. In addition, experiments revealed that a wise feature selection may improve the system accuracy. Therefore, the proposed model revealed to be reliable and simpler alternative to classical solutions for the sleep apnea detection, for example the ones based on the Polysomnography.
© 2019 Elsevier B.V. All rights reserved.
1. Introduction
Sleep apnea is a common sleep-related breathing disorder that is characterized by recurrent episodes of partial or com-plete upper airway obstruction during sleep, resulting in sleep fragmentation and oxygen desaturation [1]. A brief summary on several sleep apnea conditions is presented below:
∗
Corresponding author.
E-mail addresses: [email protected](A. Pinho),[email protected]
(N. Pombo),[email protected](B.M.C. Silva),[email protected]
(K. Bousson),[email protected](N. Garcia).
•
Obstructive sleep apnea (OSA): A patient exhibitsrespira-tory effort that results in the presence of thoracic and ab-dominal strain for continued breathing, due to the cessation or significant decrease in airflow.
•
Central sleep apnea (CSA): Complete cessation of bothair-flow and respiratory movements for at least 10 s.
•
Mixed sleep apnea (MSA): Consists of the combination ofOSA with CSA.
•
Hypopnea: Condition wherein small amounts of oxygen areprovided to the lungs as a result of slow and shallow breath-ing. Is less severe than apnea.
https://doi.org/10.1016/j.asoc.2019.105568
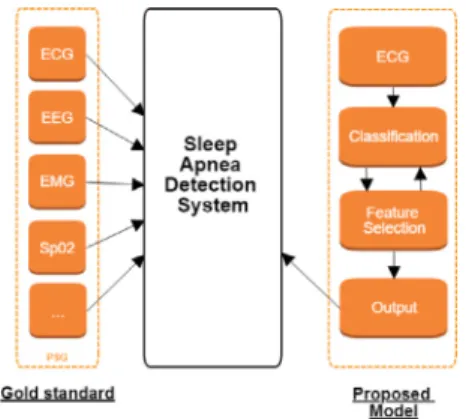
Fig. 1. The Gold standard (PSG) vs. the proposed model.
Sleep apnea disorders contribute to increased morbidity and compromised cardiovascular outcomes [2]. As cardiovascular dis-ease is the leading cause of mortality [3], untreated sleep apnea is a significant public health burden and a large challenge in terms of its prediction, detection, and/or treatment. A precise detection of sleep apnea is based on counting the number of apnea and hypopnea episodes over a given period of time (e.g., a night’s sleep). The per hour average of apnea events is a relevant metric in commonly used standards, such as the apnea/hypopnea index (AHI) [4] or the respiratory disturbance index (RDI) [5].
In the recent years, new approaches for simplified sleep ap-nea detection have been developed, commonly based on the analysis of a reduced set of signals, such as Electrocardiography (ECG) [6,7], Electroencephalography (EEG) [8,9], Electromyogra-phy (EMG) [10], Peripheral capillary Oxygen Saturation (SPO2) [11] and/or a combination of some of these signals [12]. These ap-proaches aim to represent an effective alternative to the Polysomnography (PSG), the gold standard method in the study of sleep apnea, which requires an extensive (and expensive) examination in a hospital room.
Hence, the development of novel, non-invasive, accurate and home-bound techniques based on a reduced and simplified set of biometric signals [13] may represent a feasible and accurate alternative method to PSG. In fact, this scenario may enable an affordable and ubiquitous recording of patient data in the comfort of their houses, offering the opportunity for broader and more effective monitoring of the population, using less resources of the public and/or private health systems. However, since the sleep apnea detection is based on a reduced set of signals, the use of signal processing techniques such as filtering, wrapping, feature extraction, and feature selection becomes critical and challenging regarding the design of specialized computerized systems. On the one hand, the wise selection of the most informative and/or rep-resentative features may lead to improve the overall accuracy of the system. On the other hand, methods for feature selection are prone to produce new suggested features which require further evaluation that may lead to additional computational costs.
Thus, with these principles in mind, this study presents the evaluation of different features for the sleep apnea detection. As
depicted inFig. 1 based on a single biometric signal; the ECG,
the proposed method determines the most promising features based in its meaningfulness. The ultimate goal is to propose a novel method that could provide practitioners with a more robust, simple and cost-efficient tool compared with the classical screening schemes provided by PSG.
Results showed that an adequate feature selection may lead to an increase in the classifiers’ accuracy. In addition, these results suggest that our method is as feasible and accurate as an ECG-based sleep apnea detection, and therefore, it may represent an alternative to the classical models based on the PSG.
The main contribution of this work are highlighted as follows:
•
Implementation of feature selection principles aiming at todetermine the most suitable features;
•
Evidence of the correlation between a wisely featureselec-tion and a higher system accuracy;
•
Benchmark of multiple classification models to detect sleepapnea;
•
Proposal of a reliable simplified sleep apnea detection model as an alternative to classical models based on the PSG. This article is organized as follows: this paragraph concludesSection1, which contains the introduction; Section2introduces
the principles of Feature Selection; in Section 3, the materials
and methods deployed in this study are presented, including details about the data along with the rules and assumptions
used to establish the different classification models; Section 4
presents the results obtained from the comprehensive
experi-mental evaluation; Section5discusses the meaning and
signif-icance of the results; and Section 6 concludes the paper and proposes complementary studies in this area.
2. Background
Real-time monitoring requires data collected around the clock, usually obtained from different sensors (e.g. temperature, blood
pressure, proximity, gyroscope,
. . .
) resulting in a massiveamount of data recorded. As these data are increasingly complex, it challenges for computational models capable of both, to infer information and to deal with a large source of data. In line with this, emergent machine learning and artificial intelligence technologies have been developed for example to support the clinical decision-making based on patients health records [13], or to sequence genomes on the bioinformatics context [14]. At the grassroots level, the easiest way to deal with high dimensional and complex data is to reduce the number of features extracted from the collected data. In fact, is expected that some features will be more useful than others due to the fact that every distinct feature is likely to carry a different amount of information. Thus, feature selection is used to reduce the size of the problem, decreasing the computation time and space required to deal with data. In addition, the selection of an appropriate set of features may pave the way for the design of computational models with accurate classifiers.
The simpler approach is to rank each feature based on its usefulness (e.g. by discarding those least useful), and then arbi-trarily select some of the best features. However, as features work together [15] this method is neither accurate nor convincing. Thus, instead, to select a single feature the principle is to select a set of features that may provide more information about the data that any other combination. Till date, several models have been implemented as described below.
2.1. Filter methods
An adequate selection of features is the principle of filtering methods in order to enhance the accuracy of a classifier. As each feature is ranked based on it likeliness to improve the classifica-tion, then the feature set encompasses the best combinations. 2.1.1. Pearson’s correlation coefficient
This method determines the correlation between two sets of data [16], namely, how much does a variation in one of them affect the variation in the other one.
2.1.2. Mutual information
This method determines the common information between two sets of data, namely, ‘‘how much knowing one of these variables reduces uncertainty about the other’’ [17].
2.1.3. Relief
This method, first presented in [18], aims to determine the separation capabilities of randomly selected instances on a data set, namely, the nearest same-class and opposite-class instances are obtained for each randomly selected item.
2.1.4. Ensemble with data permutation
The concept of ensemble techniques may be applied to the feature selection [19]. Unlike to consider a single feature at a time, this method is based on the principle that combining multiple features may produce a high-ranked feature.
2.1.5. F-score feature selection
This method determines not only the F-score value of each feature but also the average (also known as threshold) of all of the F-score values. Thus, a feature is added to the feature set since it F-score value is bigger than threshold value [20].
2.1.6. Hill-climbing method
The simplest hill-climbing method is based on a forward selec-tion (FS) approach. In simple terms, it starts with the empty set and greedily adds attributes one at a time until all attributes have been added. At each step, FS adds the attribute that, when added to the current set, yields the learned structure that generalizes best. Once one attribute is added, FS cannot later remove it [21]. 2.2. Wrapper methods
These methods aim to wrap a classifier up in a feature se-lection algorithm [19]. The optimal feature set is obtained based on the evaluation of the efficacy of different feature subsets, as an opposite of brute-force methods which require to evaluate all possible combinations of features.
2.2.1. Greedy forward search
This method aims to produce changes on the feature set by means of adding additional features when they notable improve the accuracy rate [15].
2.2.2. Exhaustive search
This method aims to incrementally produce a feature set based on a combination of features that maximizes the accuracy rate. It starts to determine the best one-feature subset, and succes-sively determines the n-feature subset which may consist of any combination of n single features.
2.3. Hybrid methods
These methods aim to obtain better classification by means of combine models for ranking features and models for searching all the possible subset of features.
2.3.1. Ranked forward search
This method starts to rank the features and then performs a greedy forward search over that ranking. If the accuracy rate is improved, an additional feature is included in the feature set. Hence, it is expected that the high ranked features are co-dependent among them.
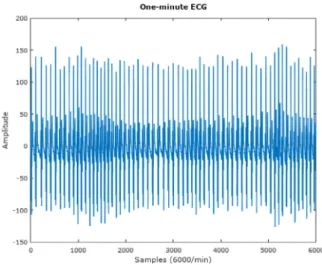
Fig. 2. Example of a one-minute normal ECG signal.
Fig. 3. Example of a sleep apnea moment in an 1 min ECG signal.
2.3.2. Refined exhaustive search
Since in high dimensional and complex problems it is a mas-sive task to explore the entire feature space for feature selection, divide and conquer techniques are used to reduce its dimension and complexity. In line with this, the Refined Exhaustive Search aims to reduce the entire space in some useful subsets in which the feature selection is determined. The subset is obtained by means of ranking the features according to user-defined criteria. 2.4. Theory
McNames and Fraser found that the Heart Rate (HR), S-pulse amplitude and pulse energy of the ECG signal are the features informative for sleep apnea detection, as well as the ECG itself, which may represent a useful tool to support physicians in the clinical decision making process [22].
The two examples presented onFigs. 2and3, clearly stand out the change in HR. Furthermore, the change in the amplitude of the different waves and the higher S-wave when these moments occur is also notable. These observations indicate that sleep apnea can be detected from the ECG signal. Therefore a promising method for the clinical decision, aiming to improve the quality of diagnoses can be proposed and developed. In line with this, the hypothesis that the ECG alone is a promising signal to use for sleep apnea detection needs to be tested.
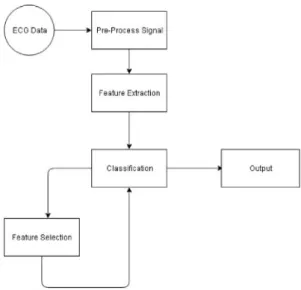
Fig. 4. Proposed system architecture.
2.5. Considerations
This paper studies the importance of feature selection in the sleep apnea detection and in consequence using the best ones to improve the accuracy of different models. Also, compares differ-ent models to study the best approach to detect sleep apnea. As a result of the study, the authors consider that it leads to better accuracy, and the promising early results show that the method can help physicians detect sleep apnea at a lower cost and better comfort for the patient.
3. Methods and materials
For the development of this study it was used GNU Octave,1
which is software compatible with MATLAB2and its packages.
3.1. Proposed system
The flow of the designed software, as depictedFig. 4consists in receiving an ECG signal as input, pre-process it and then extract the features. Firstly, the Savitzky–Golay filter, and the TEO
algorithm (as detailed explained in Section3.3. QRS Detection)
are applied to the ECG data. Secondly, the Feature Extraction is focused not only on the Heart Rate Variability (HRV), but also in the ECG-Derived Respiration (EDR). Thirdly, the feature selec-tion and the classificaselec-tion are inter-leaved aiming at to obtain a suitable selection of features (considered as the Output of the proposed model) that may lead to reliable and accurately sleep apnea detection systems (as detailed explained in the sections below).
3.2. Database
The proposed method was comprehensively tested evaluated on ECG files obtained from the PhysioNet database [23]. This data source comprises 70 records, but only 35 records were used due to the fact that they include annotations. Each record was sam-pled at 100 Hz and is approximately 8 h long, with annotations every minute. The records were acquired with respiration signals.
1 https://www.gnu.org/software/octave/.
2 https://www.mathworks.com/products/matlab.html.
The annotations were made by sleep disorder experts using stan-dard criteria with respiration signal analysis. Each minute was labeled as ‘A’ or ‘N’ in case of a sleep apnea moment or no apnea, respectively.
3.3. QRS detection
It is very important to perform a correct QRS detection, be-cause it represents a relevant feature that must be extracted. The QRS is defined as the time of occurrence of the QRS complex in the ECG signal. However, before this detection, the signal must be free from noise, such as baseline wander, because the existence of noise tends to decrease the performance of the classifier. With this in mind, a Savitzky–Golay filter was used in order to smooth data and pre-process the signal. An ECG signal free from noise, allows the detection of the R-peaks and the QRS complex with a reduced risk of bias.
The R wave detection was performed with the TEO algo-rithm [24], which is defined as follows:
ϕ
[x(
t)
]=
(
dx(
t)
dt)
2−
x(
t)
d 2x(
t)
dt2,
(1)where t is the normalized time variable, and x(t) is the signal. On the basis of the discrete time domain, the TEO algorithm is applied over the ECG signal, as follows:
ϕ
[x(
t)
]=
x(n)−
x(n−
1)−
x(n)2+
2x(n)x(n−
2),
(2)where x(t) is the signal, and n is the time variable.
The signal is processed in a one-second window aiming to detect the R waves. Due to the different amplitude of the R-peaks along the signal, it is desirable to apply an adaptive threshold at the 10% of the maximum R amplitude. Thus, t0 is marked as an R-peak since its output exceeds the threshold and no greater value was observed in the next 0.25 s, then t0 is marked as an R-peak. 3.4. Feature extraction
The feature extraction was processed along the HRV and the EDR signals. On the one hand, the time interval from one R wave to the next meaning the cycle variation over the duration of the heartbeat is considered as the HRV. On the other hand, the EDR is a processing signal technique for deriving the respiration signals from ordinary electrocardiograms. The area of the R wave was obtained using a trapezium.
Since the database classification was provided for one-minute segments of data, features were extracted from these segments. In total, 50 features were extracted from the HRV and 34 from the EDR signal, giving a total of 84 features.Table 1presents the
18 extracted features from the HRV andTable 2presents the 2
features from the EDR.Table 3presents the features extracted by the 256-points FFT power spectral density.
The 256-point FFT power spectral density was computed for HRV and EDR, but only the first 32 points are kept [25].
3.5. Feature selection
As already mentioned, the feature selection process is ex-pected to select a suitable feature subset from the initial features. This process aims to highlight the relevant and eliminate the irrel-evant features that may lead to improving both data visualization, and data knowledge extraction. In addition, it is also desirable that this process may reduce the training, and the computation cost [26]. Since the ultimate goal is to promote an accurate classification, then the Receiver Operating Cover (ROC) curve was selected to measure the quality of each classifier implemented into our experiments. The main ability of the ROC is to select
Table 1
Time-domain measure for HRV(m) epoch sequence.
RR(m) RR(m)= [rri]mi=1 Feature count Mean µ =∑rri m 1 Standard deviation σ = √∑(rr i−µrr)2 m 1
Sum of beats with interbeat difference over 50 ms, variant 1 NN50v1= ∑m i=2unit[|rri−rri+1| − 50 ms] 1
Sum of beats with interbeat difference over 50 ms, variant 2 NN50v2= ∑m−1 i=1 unit[|rri+1−rri| − 50 ms] 1 Ratio of NN50v1 to segment length pNN50v1=NN50v1 m 1 Ratio of NN50v2 to segment length pNN50v2=NN50mv2 1 Mean of interbeat differentials µrd= ∑rd i m , where rdi=rri+1−rri 1 Standard deviation of interbeat differentials σ =√∑(rd i−µrd)2 m 1
Root mean square of interbeat differentials RMSSD= √ ∑rd2 i m 1 Serial correlation coefficients (k =1, . . . ,5) rk= ∑m i=1(rri−µrd)(rri+k−µrr) ∑m i=1(rri−µrr)2 5
Fractal alan factors (k=5,10,15) ATk= ∑(N i+1[k]−Ni[k])2 2∗∑N i+1[k] , Ni[k]
is the number of beats in the ith window of k seconds
3 NEP (Number of extreme points) NEP=m1−2∑m−1 i=2(1− unit[(rri−rri−1)(rri+1−rri)]) 1 Table 2
Time-domain measure for EDR(q) epoch sequence.
EDR(q) EDR(q)=[edr]qi=1 Feature count
Mean µedr=
∑edr
i
q 1
Standard deviation σedr= √
∑(edr
i−µedr)2
q 1
Table 3
Spectral-domain measures for HRV and EDR epoch sequences.
Spectral-domain measure Feature count
PSD/FFT points 64
an optimal classifier dependent on different types of problems. With this principle in mind, the ROC was applied to present a graphical plotting of the fraction of true positives vs. the fraction of false positives for the proposed binary classification system. In addition, the area under a ROC curve, AUC, represents the global accuracy of a classifier varying between 1 (maximum accuracy) and 0.50 (minimum).
Moreover, the features were ranked and selected using the Discriminant Relevance (DR) method, a filter method whose prin-ciples rely on computing the difference between the discrimina-tory power of the model using all the features and the model with all the features except that one that is under study. Mathemati-cally, DR is defined as:
DRi
=
AUC0
−
AUCi AUC0−
12(3)
In addition, the feature is only significant if∆AUC cannot be explained by randomness due to a finite sample. A hypothesis
test H0 is proposed to compare the equality of AUCs against the
alternative hypothesis of a positive difference: H0
:
AUCi=
AUC0H1
:
AUCi<
AUC0}
(4)
where H0 is the null hypothesis and H1 is the alternative
hy-pothesis. The purpose of this method is to reject the H0 hypoth-esis when the feature makes a significant contribution to the model [26].
Finally, a statistical test to compare the two AUC models is defined below [27]: z
=
AUC0−
AUCi√
SE2 0+
SE2i+
2pSE0SEi,
(5)where SE0 is the standard error of AUC0 and SEi is the standard error of AUCi, and p is the correlation between the AUC0and AUCi. Thus, the algorithm for the feature selection is defined as follows [26]:
Repeat 100 times:
1. sqrt(N)
=
200 random sub-samples are selected astraining set and another 200 different samples are randomly selected for validation
2. Classify using choose a classifier
3. ROC Curve and SE error calculated using all variables
4. For every variable:
•
ROC Curve AUCiand SEi calculated•
DRiusing(3)and ziusing(5) 5. Variable is significant if zi>
0.3.6. Classification
To classify the extracted features, all the 17401 records ob-tained from each minute of the ECG signals were labeled as 0 or 1 in the event of an apnea moment or a non-apnea moment, respectively. These data were divided into three different vectors: training vectors, testing vectors, and a validation vector. The
k-fold cross-evaluation method was used, with k
=
10, aiming toimprove the training of the classifiers. For comparison with other studies and to generate evaluation metrics, the sensitivity, speci-ficity, and accuracy were calculated for the different classifiers. These metrics are defined as follows:
sensiti
v
ity=
TP TP+
FN (6) specificity=
TN TN+
FP (7) accuracy=
TP+
TN P+
N (8)where TP (True Positive) and TN (True Negative) refer to the number of correctly detected apneic and normal moments, re-spectively. Similarly, FP (False Positive) and FN (False Negative) stand for the number of misidentified apneic and normal mo-ments, respectively. In addition, P (Positive) and N (Negative) represent the total number of epochs with or without apneic moments, respectively. Hence, the sensitivity reflects the ability to correctly detect sleep apnea moments, the specificity conveys
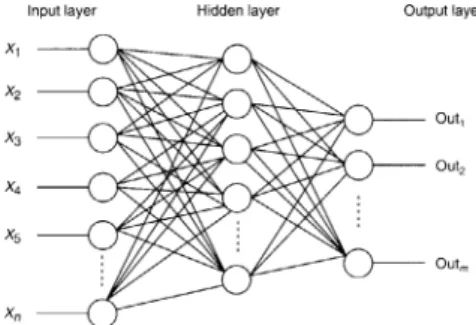
Fig. 5. A standard multi-layer ANN structure with l layers of units.
the ability to distinguish the normal moments and accuracy refers to the correct detection of sleep apnea and normal moments.
In the classification phase, nine classifiers such as Artificial Neural Network (ANN), Support Vector Machine (SVM), Linear Discriminant Analysis (LDA), Partial Least Squares Regression (PLS), Regression Analysis (REG), Wiener–Hopf equation (Wiener-Hopf), Augmented Naive Bayesian Classier (aNBC), Perceptron Learning Algorithm (PLA), and Least Mean Square (LMS) were implemented and its performance was comparatively evaluated. First, a feed-forward back propagation neural network was im-plemented.
Unlike the ANN and the SVM that were configured with spe-cific parameters in our experiments, the other algorithms were tested with the Octaves’ pre-defined parameters. Both ANN, and SVM settings are detailed explained in the next sections. 3.6.1. Artificial Neural Network (ANN)
The ANN implemented in this project was configured with 20 input neurons (corresponding to 20 features extracted) or with 84 input neurons (corresponding to the extension of the study). First, inputs where standardized and then, the maximum and minimum were defined for each input. The activation function used was the tansig function (hyperbolic tangent sigmoid transfer function) as a transfer function between the input layer and the hidden layer, and the purelin function (linear transfer function) was used as a transfer function between the hidden layer and the output layer. The tansig function is defined as
tansig(n)
=
21
+
e−2n−
1and the purelin function is defined as purelin(n)
=
n.
Fig. 5presents a standard multi-layer ANN structure.
3.6.2. Support Vector Machine (SVM)
The SVM implemented with a Gaussian Radial Basis Function (RBF) as a kernel. The RBF kernel is defined as
K (xi
,
xj)=
e−γ ∥xi−xj∥2
, γ ≥
0,
(9)in which
γ
determines the variance i.e. the similarity measurebetween two points. A large value means a small variance (two points are similar when they are close to each other). On the contrary, a lower value means a large variance (two points are similar even if are distant to each other).
In addition, the SVM was tuned in terms of soft margin, namely the C parameter. The soft margin was introduced by Cortes and Vapnik [28] in order to provide a better overall fit model, due to its ability to ‘‘ignore’’ selected instances, for exam-ple, those placed on the wrong side of the margin. In line with
this, the C parameter represents the soft margin cost function, controlling the influence of each individual support vector. In this study, the best result was achieved using a C equal to 512.
4. Results and discussion
This section presents comparisons of classification accuracy, sensitivity, and specificity between the proposed method and the benchmark methods. In line with this, two scenarios were designed to evaluate the proposed system. First, 84 features ex-tracted were used to train and simulate the system. Second, feature selection was applied to the 84 features, dividing them according to rank. All the implemented classifiers were trained using 8507 records of features, with 2836 records used to mini-mize over-fitting and 5671 records used to evaluate the perfor-mance. The data provided to the classifiers for training and testing
were divided using the k-fold cross-validation method with k
=
10.
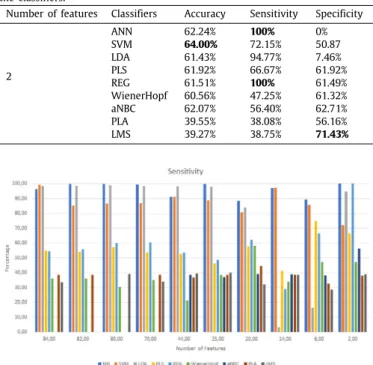
The experiments were divided into two parts: one part regard-ing the extraction and classification of features and another part regarding its feature selection and classification. It was initially extracted and classified 84 features which led to the best result by the PLS of 63% of accuracy; the best specificity was of 99.23% from the SVM, and the best sensitivity was of 68.36% by the PLA. When then feature selection method was applied, as explained in the classification section, all the different set of features were classified, organized by the rank of the features and calculated with the Discriminant Relevance. In addition, all set of features were classified with the same classifiers.Tables 4and5present the performed tests and respective results. These results are im-portant to understand the evolution of the classification, namely, it should be noted that the sensitivity is mostly high. This sug-gests the ability of the implemented algorithms to detect sleep apnea moments. Moreover, related to the detection of non-apnea moments was observed that the sensitivity is always constant at some point, this is, sensitivity maintains a high score with more or fewer features. Finally, the specificity is lower with more features than with fewer features.
Then, it is clearly observed, that the best result is achieved by the ANN, with 20 features, with an accuracy of 82.12%. Here it can be seen that these features are more correlated with the detection of sleep apnea and normal moments. It is seen that the best sensitivity value is of 100% with 2 features but with a specificity of 0%. The accuracy, in this case, is lower (62.24%), because the specificity is 0. It is clearly seen that the best specificity, in a balanced classification, is of 96.88% (LDA).
When the specificity increases, the classifiers tend to produce lower sensitivity, in other words, it presents a reduced detection of sleep apnea moments. As example, using 14 features, the LDA had 96.88% of specificity but the sensitivity is of 3.31%.
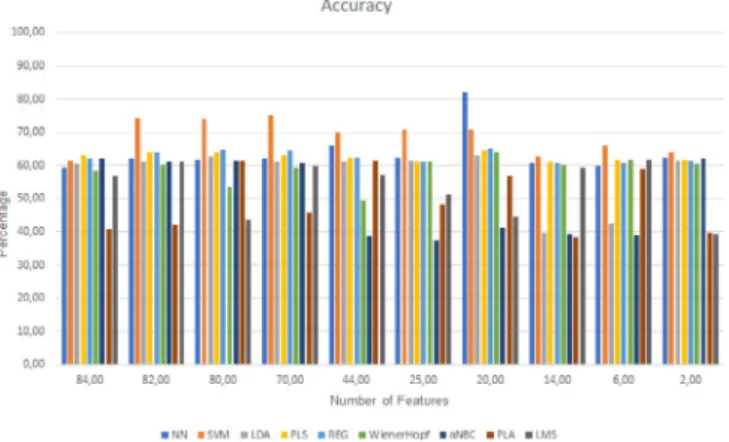
The Figs. 6, 7, and 8 present the evolution of the different
parameters as the features were being removed and also compare the different performance of the classifiers in terms of sensitivity, specificity, and accuracy respectively.
Analyzing the results presented in the previous section, the different classifiers present different behaviors, depending on the number of features given to them to classify. For example, with 70 features the accuracy was of 75.18% by the SVM and with a sensitivity of 86.79% and a specificity of 56.45%. However, with 44 features it was achieved an accuracy of 70.00% by the SVM, but the sensitivity is of 91.33% and a specificity of 34.88%. Here it can be seen that with different features different accuracy, specificity, and sensitivity are different as well.
The training time varies between 2 h for the ANN and a single minute for the LDA. On the contrary, the learning is achieved faster; around 3 min, with the ANN. These results, however,
Table 4
Results for the different set of features with comparison between the classifiers.
Number of features Classifiers Accuracy Sensitivity Specificity
84 ANN 59.40% 96.43% 2.67% SVM 61.61% 99.23% 0.87% LDA 60.57% 98.56% 0.95% PLS 63.00% 54.93% 65.24% REG 62.14% 54.66% 64.59% WienerHopf 58.43% 36.21% 61.06% aNBC 62.12% 0% 62.12% PLA 40.91% 38.64% 68.36% LMS 56.92% 33.53% 60.96% 82 ANN 61.98% 99.75% 0.37% SVM 74.46% 85.29% 56.52% LDA 61.19% 98.66% 0.92% PLS 63.88% 53.99% 66.93% REG 64.00% 55.78% 66.37% WienerHopf 60.15% 36.14% 62.16% aNBC 61.28% 0% 61.28% PLA 42.12% 38.62% 66.21% LMS 61.01% 0% 61.01% 80 ANN 61.82% 99.94% 0.10% SVM 74.09% 86.53% 54.12% LDA 62.61% 98.88% 0.86% PLS 63.90% 57.26% 65.79% REG 64.70% 60.16% 65.71% WienerHopf 53.51% 30.69% 59.59% aNBC 61.47% 0% 61.47% PLA 61.33% 0% 61.33% LMS 43.59% 39.11% 65.83% 70 ANN 62.17% 99.58% 0.74% SVM 75.18% 86.79% 56.45% LDA 61.01% 98.57% 0.64% PLS 62.89% 53.72% 65.66% REG 64.65% 60.35% 65.75% WienerHopf 59.29% 35.16% 61.76% aNBC 60.91% 0% 60.91% PLA 45.72% 38.57% 59.86% LMS 59.87% 33.98% 61.36% 44 ANN 66.01% 91.17% 9.41% SVM 70.00% 91.33% 34.88% LDA 61.17% 98.44% 0.87% PLS 62.40% 52.64% 64.03% REG 62.24% 53.67% 63.39% WienerHopf 49.48% 21.33% 57.43% aNBC 38.86% 38.43% 66.00% PLA 61.36% 36.84% 61.70% LMS 57.06% 39.64% 61.23% 25 ANN 62.348% 99.97% 0% SVM 70.84% 88.70% 41.78% LDA 61.58% 97.92% 1.17% PLS 61.28% 46.12% 63.26% REG 61.28% 48.74% 62.85% WienerHopf 61.15% 38.56% 62.13% aNBC 37.67% 37.14% 65.71% PLA 48.19% 38.57% 61.56% LMS 51.47% 39.99% 62.00% 20 ANN 82.12% 88.41% 72.29% SVM 70.94% 80.87% 54.94% LDA 62.93% 83.98% 28.40% PLS 64.49% 57.78% 66.05% REG 65.13% 62.23% 65.65% WienerHopf 64.05% 58.14% 65.27% aNBC 41.20% 39.24% 79.21% PLA 56.74% 44.58% 66.40% LMS 44.72% 32.09% 58.46%
(continued on next page)
should be interpreted with caution because the training perfor-mance is dependent on the platform and available computational resources. The experiments were realized in a laptop featured as follows: Manjaro OS, Intel Core i7-4702MQ CPU 2.20 GHz as processor, and 6 GB of RAM.
Table 4 (continued).
Number of features Classifiers Accuracy Sensitivity Specificity
14 ANN 60.89% 97.13% 2.21% SVM 62.68% 97.32% 5.63% LDA 39.62% 3.31% 96.88% PLS 61.21% 41.38% 61.31% REG 60.99% 29.09% 61.24% WienerHopf 60.12% 33.98% 61.89% aNBC 39.37% 38.97% 64.44% PLA 38.53% 38.53% 0% LMS 59.17% 38.44% 61.86% 6 ANN 59.80% 89.40% 11.15% SVM 65.92% 85.59% 34.37% LDA 42.33% 16.46% 83.65% PLS 61.75% 75% 61.74% REG 60.73% 66.67% 60.73% WienerHopf 61.65% 47.21% 62.26% aNBC 38.95% 38.26% 67.15% PLA 59.03% 32.57% 60.75% LMS 61.72% 28.70% 62.35% Table 5
Results for the different set of features with comparison between the classifiers.
Number of features Classifiers Accuracy Sensitivity Specificity
2 ANN 62.24% 100% 0% SVM 64.00% 72.15% 50.87 LDA 61.43% 94.77% 7.46% PLS 61.92% 66.67% 61.92% REG 61.51% 100% 61.49% WienerHopf 60.56% 47.25% 61.32% aNBC 62.07% 56.40% 62.71% PLA 39.55% 38.08% 56.16% LMS 39.27% 38.75% 71.43%
Fig. 6. Chart for comparison between the sensitivity results.
Fig. 7. Chart for comparison between the specificity results.
It is observable that the best classifier is the ANN using 20 features. So, these features, together, are more correlated and
Fig. 8. Chart for comparison between the accuracy results.
more informative to the solution of the problem among all of the features extracted. Besides that, it is clearly seen that different classifiers have different results in the sensitivity and specificity aspect.
The results presented in this paper are comparable with other
studies using the same database (PhysioNet ECG-Apnea
Database). This is important for understanding and validating the methods used in this study and in the other studies. In a study comparing the performances of different classifiers, the best classifier was reported to be Bagging. REPTree, which had an accuracy of 84.4% and a specificity of 85.9%. The best sensi-tivity was achieved by the AdaBoost algorithm with a score of 87.03% [25].
Moreover, [29] extracted only four features and achieved a sensitivity of 72.47% with AdaBoost, a specificity of 83.29% and an accuracy of 85.07%.
In one study using the ELM classifier [30], the results achieved were as follows: an accuracy of 87.71%, a specificity of 91.7% and a sensitivity of 81.3%. Despite the good results, the sensitivity is a little lower than in other studies and the correct detection of sleep apnea moments should be a priority. If a moment is misclassified it can be corrected and it is not a serious hazard. However, a sleep apnea moment misclassified can be health and/or life jeopardizing, and therefore, sensitivity is much more important than specificity.
In a real-time monitoring scenario [31], good results were achieved with a sensitivity of 96%; however, a PSG device was used on the study to support all the participants on the study.
In [32], two classifiers were developed to solve this problem, Linear Discriminant (LD) and Quadratic Discriminant (QD). These classifiers were tested using three different methods, including no optimization, feature selection, and co-variance regularization. The results were interesting. With no optimization, QD achieved the best specificity, 94.6%, and LD achieved the best sensitivity (94%). The best accuracy, as expected, was achieved by the feature selection (93.2% with QD). However, the test with no optimization achieved better sensitivity.
In [33], the use of Lomb Periodogram showed good results with an accuracy of 92.1%, a specificity of 90.1% and sensitivity of 94.3%.
In study [34], LogitBoost was first time implemented to detect sleep apnea and the use of wavelet to extract features. The proposed method achieved a result of 84.4% accuracy, 90.38% of sensitivity and 74.84% of specificity.
At [35], the method used using Gabor filters and LS-SVM achieved an overall accuracy of 93.31%, a sensitivity of 93.05% and a specificity of 93.46%.
Table 6
A comparative table with the state of art.
Study Accuracy Sensitivity Specificity [28] 84.40% 87.30% 85.90% [29] 85.07% 72.47% 83.29% [30] 87.71% 81.30% 91.70% [31] – 96.00% – [32] 93.20% 94.00% 94.60% [33] 92.10% 94.30% 90.10% [34] 84.40% 90.38% 74.44% [35] 93.31% 93.50% 93.46% [36] 87.50% – – [37] 80.00% 60.00% 100.00% [38] 97.80% – – This study 82.12% 88.41% 72.29%
In study [36], the combination of feature selection and neuro-fuzzy achieved an accuracy of 87.5%. There is no information regarding sensitivity and specificity.
At study [37], using a database collection of Department of Neurology of Amrita Institute of Medical Sciences, Kochi, and using the SVM as a classifier the best accuracy was of 80%, with a sensitivity of 60% and a specificity of 100%.
Finally, in [38], using the same database, a recurrent neural network without feature selection, the final result achieved a 97.80% of accuracy.
TheTable 6, compares the results of the state of the art with
the presented study.
The proposed system obtained an accuracy of 82.12%, a speci-ficity of 72.29%, and sensitivity of 88.41%. Our experiments re-vealed that the sensitivity/specificity ratio is high which means that the detection of either normal or sleep apnea moments is precise. The higher sensitivity supports the approach taken in this study.
5. Conclusions and open issues
The ultimate goal of this research work is to provide an overview of the importance of features in order to detect sleep apnea events; based on the ECG signal, as an alternative to the classical PSG approach. Each set of features, based in its rank, are applied to compare the effectiveness and efficiency of different classifiers.
Extensive experiments have demonstrated that different fea-tures meet different significance in the system performance and, as a consequence, different classifiers induce to different be-haviors in solving the same problem when presented different features.
In addition, as evidenced in our experiments, an adequate feature selection may lead to an increase in the classifiers’ ac-curacy. Therefore, the proposed system evidenced its suitability, feasibility, and accuracy on the detection of sleep apnea using the ECG signal. In this study, the accuracy of 82.12%, with a sensitivity of 88.41% and a specificity of 72.29% were obtained through an ANN with 20 features. In addition, our study is contradictory with the literature in terms of the adequate combination of features, due to the fact that some of the selected features were not considered in previous studies (e.g. the spectral-domain measure for both EDR, and HRV signals).
The models trained in this study evidenced that it is possible to support the clinical decision-making based in a single signal, namely the ECG, in the context of sleep apnea detection.
Finally, complementary studies should be addressed in or-der to enhance the proposed system including the classifiers’ performance, and the use of different features and methods. On the one hand, prospective investigations could be conducted
not only in larger datasets, but also evaluating additional clas-sifiers as the Recurrent Neural Networks. On the other hand, it is timely and pertinent to further research on a benchmark on the balance between the computational burden (of signal pre-processing, feature extraction, and selection) and the outcome performance.
Acknowledgments
The authors would like to acknowledge the contribution of the COST Action IC1303 - Architectures, Algorithms, and Platforms for Enhanced Living Environments (AAPELE). Contributing to this research, the authors affiliated with the Instituto de Telecomu-nicações also acknowledge the funding for this research: the FCT/MEC through national funds and when applicable co-funded by FEDER – PT2020 partnership agreement under the project UID/EEA/50008/2019. (Este trabalho é financiado pela FCT/MEC através de fundos nacionais e quando aplicável cofinanciado pelo FEDER, no âmbito do Acordo de Parceria PT2020 no âmbito do projeto UID/EEA/50008/2019). This work was also partially sup-ported by Operação Centro-01-0145-FEDER-000019–C4-Centro de Competências em Cloud Computing, co-financed by the Pro-grama Operacional Regional do Centro (CENTRO 2020), through the Sistema de Apoio à Investigação Científica e Tecnológica– Programas Integrados de IC&DT.
Funding
Funding was received fo this work.
All of the sources of funding for the work described in this publication are acknowledged below:
(1) COST Action IC1303 - Architectures, Algorithms, and Plat-forms for Enhanced Living Environments (AAPELE).
(2) Instituto de Telecomunicações: FCT/MEC through national funds and when applicable co-funded by FEDER – PT2020 part-nership agreement under the project UID/EEA/50008/2019.
Declaration of competing interest
No author associated with this paper has disclosed any po-tential or pertinent conflicts which may be perceived to have impending conflict with this work. For full disclosure statements refer tohttps://doi.org/10.1016/j.asoc.2019.105568.
References
[1] Kentaro Okuno, Benjamin T. Pliska, Mona Hamoda, Alan A. Lowe, Fer-nanda R. Almeida, Prediction of oral appliance treatment outcomes in obstructive sleep apnea: A systematic review, Sleep Med. Rev. (ISSN: 1087-0792) 30 (2016) 25–33,http://dx.doi.org/10.1016/j.smrv.2015.11.007, URL
http://www.sciencedirect.com/science/article/pii/S1087079215001586. [2] Tetyana Kendzerska, Andrea S. Gershon, Gillian Hawker, Richard S. Leung,
George Tomlinson, Obstructive sleep apnea and risk of Cardiovascular events and all-Cause mortality: A decade-long historical cohort study, PLOS Med. 11 (2) (2014) 1–15,http://dx.doi.org/10.1371/journal.pmed.1001599. [3] Ike S. Okwuosa, Sabra C. Lewsey, Tolulope Adesiyun, Roger S. Blumen-thal, Clyde W. Yancy, Worldwide disparities in cardiovascular disease: Challenges and solutions, Int. J. Cardiology (ISSN: 0167-5273) 202 (2016) 433–440,http://dx.doi.org/10.1016/j.ijcard.2015.08.172.
[4] Warren R Ruehland, Peter D Rochford, Fergal J O’Donoghue, Robert J Pierce, Parmjit Singh, Andrew T Thornton, The new AASM criteria for scoring hypopneas: Impact on the apnea hypopnea index, Sleep (ISSN: 0161-8105) 32 (2) (2009) 150–157, URLhttp://www.ncbi.nlm.nih.gov/pmc/ articles/PMC2635578/.
[5] Daniel J. Gottlieb, Relation of sleepiness to respiratory disturbance index, Amer. J. Respiratory Critical Care Med. (ISSN: 1073-449X) 159 (2) (1999) 502–507,http://dx.doi.org/10.1164/ajrccm.159.2.9804051.
[6] A. Patangay, P. Vemuri, A. Tewfik, Monitoring of obstructive sleep apnea in heart failure patients, in: 2007 29th Annual International Conference of the IEEE Engineering in Medicine and Biology Society, 2007, pp. 1043–1046,
http://dx.doi.org/10.1109/IEMBS.2007.4352473.
[7] T. Al-ani, C.K. Karmakar, A.H. Khandoker, M. Palaniswami, Automatic recognition of obstructive sleep apnoea syndrome using power spectral analysis of and hidden Markov models, in: 2008 International Conference on Intelligent Sensors, Sensor Networks and Information Processing, 2008, pp. 285–290,http://dx.doi.org/10.1109/ISSNIP.2008.4762001.
[8] T. Sugi, F. Kawana, M. Nakamura, Automatic EEG arousal detection for sleep apnea syndrome, In: Biomedical Signal Processing and Con-trol. Special Issue on Biomedical Systems, Signals and Control Extended Selected papers from the IFAC World Congress, Seoul, July 2008 4.4 (Oct.2009), pp. 329337. (ISSN:1746-8094).http://dx.doi.org/10.1016/ j.bspc.2009.06004. URL https://www.sciencedirect.com/science/article/pii/ S1746809409000494(visited on 01/30/2017).
[9] Chien-Chang Hsu, Ping-Ta Shih, A novel sleep apnea detection system in electroencephalogram using frequency variation, Expert Syst. Appl. (ISSN: 0957-4174) 38 (5) (2011) 6014–6024, http://dx.doi.org/10.1016/ j.eswa.2010.11.019, URL http://www.sciencedirect.com/science/article/pii/ S095741741001256X.
[10] Necmettin Sezgin, Necmettin Sezgin, EMG classification in obstructive sleep apnea syndrome and periodic limb movement syndrome patients by using wavelet packet transform and extreme learning machine, Turkish J. Electr. Eng. Comput. Sci. 23 (3) (2015) 873–884,http://dx.doi.org/10.3906/ elk-1210-6, URLhttp://sdu.dergipark.gov.tr/tbtkelektrik/144851. [11] Laiali Almazaydeh, Khaled Elleithy, Miad Faezipour, Ahmad Abushakra,
Apnea detection based on respiratory signal classification, in: Procedia Computer Science, in: The 4th International Conference on Emerging Ubiquitous Systems and Pervasive Networks (EUSPN-2013) and the 3rd International Conference on Current and Future Trends of Information and Communication Technologies in Healthcare (ICTH), 21, 2013, pp. 310–316, http://dx.doi.org/10.1016/j.procs.2013.09.041, (ISSN:1877-0509) URLhttp://www.sciencedirect.com/science/article/pii/S187705091300834X
(visited on 01/30/2017).
[12] N. Pombo, N.M. Garcia, Ubisleep: An ubiquitous sensor system for sleep monitoring, in: 2016 IEEE 12th International Conference on Wireless and Mobile Computing, Networking and Communications (WiMob), 2016, pp. 1–4,http://dx.doi.org/10.1109/WiMOB.2016.7763192.
[13] Nuno Pombo, Nuno Garcia, Kouamana Bousson, Classification techniques on computerized systems to predict and/or to detect apnea: A systematic review, Comput. Methods Programs Biomed. (ISSN: 0169-2607) 140 (2017) 265–274, http://dx.doi.org/10.1016/j.cmpb.2017.01.001, URL http://www. sciencedirect.com/science/article/pii/S0169260716306113.
[14] Peter Tarczy-Hornoch, Mark Minie, Bioinformatics challenges and oppor-tunities, in: Hsinchun Chen, Sherrilynne S. Fuller, Carol Friedman, William Hersh (Eds.), Medical Informatics: Knowledge Management and Data Mining in Biomedicine, Springer US, Boston, MA, ISBN: 978-0-387-25739-6, 2005, pp. 63–94,http://dx.doi.org/10.1007/0-387-25739-X_3.
[15] Isabelle Guyon, André Elisseeff, An introduction to variable and feature selection, J. Mach. Learn. Res. (ISSN: 1532-4435) 3 (2003) 1157–1182, URL
http://dl.acm.org/citation.cfm?id=944919.944968.
[16] M.M. Mukaka, Statistics corner: A guide to appropriate use of correlation coefficient in medical research, Malawi Med. J.: J. Med. Assoc. Malawi (ISSN: 1995-7270) 24 (3) (2012) 69–71.
[17] R. Moddemeijer, On estimation of entropy and mutual information of continuous distributions, Signal Process. (ISSN: 0165-1684) 16 (3) (1989) 233–248, http://dx.doi.org/10.1016/0165-1684(89)90132-1, URL http:// www.sciencedirect.com/science/article/pii/0165168489901321 (visited on 05/18/2017).
[18] Kenji Kira, Larry A. Rendell, A practical approach to feature selection, in: Proceedings of the Ninth International Workshop on Machine Learning, in: ML92, Morgan Kaufmann Publishers Inc., San Francisco, CA, USA, 1992, pp. 249–256, ISBN:1-5586-247-X. URL http://dl.acm.org/citation.cfm?id= 141975.142034.
[19] Yvan Saeys, Thomas Abeel, Yves Van de Peer, Robust feature selection using ensemble feature selection techniques. en, in: Machine Learn-ing and Knowledge Discovery in Databases, SprLearn-inger, Berlin, Heidelberg, 2008, pp. 313–325,http://dx.doi.org/10.1007/978-3-540-87481-2_21, URL
https://link.springer.com/chapter/10.1007/978-3-540-87481-2_21 (visited on 05/30/2017).
[20] Kemal Polat, Salih Güneş, A new feature selection method on classification of medical datasets: Kernel F-score feature selection, Expert Syst. Appl. (ISSN: 0957-4174) 36 (7) (2009) 10367–10373,http://dx.doi.org/10.1016/ j.eswa.2009.01.041, URL http://www.sciencedirect.com/science/article/pii/ S0957417409000840.
[21] Abdulnasir Yildiz, Mehmet Akın, Mustafa Poyraz, An expert system for automated recognition of patients with obstructive sleep apnea us-ing electrocardiogram recordus-ings, Expert Syst. Appl. (ISSN: 0957-4174) 38 (10) (2011) 12880–12890,http://dx.doi.org/10.1016/j.eswa.2011.04.080, URLhttp://www.sciencedirect.com/science/article/pii/S0957417411006075. [22] J.N. McNames, A.M. Fraser, Obstructive sleep apnea classification based on spectrogram patterns in the electrocardiogram, IEEE, ISBN: 978-0-7803-6557-5, 2000, pp. 749–752, http://dx.doi.org/10.1109/CIC.2000.898633, URLhttp://ieeexplore.ieee.org/document/898633/.
[23] T. Penzel, G.B. Moody, R.G. Mark, A.L. Goldberger, J.H. Peter, The apnea-ECG database, in: Computers in Cardiology 2000, 2000, pp. 255–258,
http://dx.doi.org/10.1109/CIC.2000.898505.
[24] J.F. Kaiser, Some useful properties of Teager’s energy operators, in: 1993 IEEE International Conference on Acoustics, Speech, and Signal Processing, Vol. 3, 1993, pp. 149–152,http://dx.doi.org/10.1109/ICASSP.1993.319457. [25] B. Xie, H. Minn, Real-Time Sleep Apnea Detection by Classifier
Combina-tion, IEEE Trans. Biomed. Eng. (ISSN: 1089-7771) 16 (3) (2012) 469–477,
http://dx.doi.org/10.1109/TITB.2012.2188299.
[26] Feature selection using ROC curves on classification problems, URL
https://www.researchgate.net/publication/221533549_Feature_selection_ using_ROC_curves_on_classification_problems(visited on 01/31/2017). [27] A Method of Comparing the Areas Under Receiver Operating Characteristic
Curves Derived from the Same Cases, URL https://www.researchgate. net/publication/16319730_A_Method_of_Comparing_the_Areas_Under_ Receiver_Operating_Characteristic_Curves_Derived_from_the_Same_Cases
(visited on 02/01/2017).
[28] Corinna Cortes, Vladimir Vapnik, Support-vector networks, Mach. Learn. (ISSN: 1573-0565) 20 (3) (1995) 273–297, http://dx.doi.org/10.1023/A: 1022627411411.
[29] C. Varon, D. Testelmans, B. Buyse, J.A.K. Suykens, S. Van Huffel, Sleep apnea classification using least-squares support vector machines on single lead ECG, in: 2013 35th Annual International Conference of the IEEE Engineering in Medicine and Biology Society (EMBC), 2013, pp. 5029–5032,
http://dx.doi.org/10.1109/EMBC.2013.6610678.
[30] N. Sadr, P. de Chazal, Automated detection of obstructive sleep apnoea by single-lead ECG through ELM classification, in: Computing in Cardiology 2014, 2014, pp. 909–912.
[31] M. Bsoul, H. Minn, L. Tamil, Apnea medassist: Real-time sleep apnea monitor using single-lead ECG, IEEE Trans. Inf. Technol. Biomed. (ISSN: 1089-7771) 15 (3) (2011) 416–427, http://dx.doi.org/10.1109/TITB.2010. 2087386.
[32] P. de Chazal, C. Heneghan, E. Sheridan, R. Reilly, P. Nolan, M. O’Malley, Au-tomated processing of the single-lead electrocardiogram for the detection of obstructive sleep apnoea, IEEE Trans. Biomed. Eng. (ISSN: 0018-9294) 50 (6) (2003) 686–696,http://dx.doi.org/10.1109/TBME.2003.812203. [33] Wai-Chi Fang, I.-W.ei Chen, Shu-Han Fan, Chih-Kuo Lee, An
electrocar-diography system design for obstructive sleep apnea detection based on improved lomb frequency analysis algorithm, in: 2017 IEEE Biomedi-cal Circuits and Systems Conference (BioCAS), IEEE, Torino, Italy, ISBN: 978-1-5090-5803-7, 2017, pp. 1–4,http://dx.doi.org/10.1109/BIOCAS.2017. 8325151, URLhttp://ieeexplore.ieee.org/document/8325151/.
[34] Ahnaf Rashik Hassan, Syed Khairul Bashar, Mohammed Imamul Hassan Bhuiyan, Computerized obstructive sleep apnea diagnosis from single-lead ECG signals using dual-tree complex wavelet transform, in: 2017 IEEE Region 10 Humanitarian Technology Conference (R10-HTC), IEEE, Dhaka, ISBN: 978-1-5386-2175-2, 2017, pp. 43–46, http://dx.doi.org/10.1109/R10-HTC.2017.8288902, URLhttp://ieeexplore.ieee.org/document/8288902/. [35] T. Sunil Kumar, Vivek Kanhangad, Gabor filter-based one-dimensional
local phase descriptors for obstructive sleep apnea detection using single-lead ECG, IEEE Sens. Lett. (ISSN: 2475-1472) 2 (1) (2018) 1–4, http: //dx.doi.org/10.1109/LSENS.2018.2807584, URL https://ieeexplore.ieee.org/ document/8294252/.
[36] Soumya Gopal, T. Aswathy Devi, Obstructive sleep apnea detection from ECG signal using neuro-fuzzy classifier, in: 2017 International Conference on Intelligent Computing, Instrumentation and Control Technologies (ICI-CICT), IEEE, Kerala State,Kannur, India, ISBN: 978-1-5090-6106-8, 2017, pp. 910–915, http://dx.doi.org/10.1109/ICICICT1.2017.8342686, URL http: //ieeexplore.ieee.org/document/8342686/.
[37] Anju Prabha, Akta Trivedi, A. Anand Kumar, C Santhosh Kumar, Auto-mated system for obstructive sleep apnea detection using heart rate variability and respiratory rate variability, in: 2017 International Con-ference on Advances in Computing, Communications and Informatics (ICACCI), IEEE, Udupi, ISBN: 978-1-5090-6367-3, 2017, pp. 1303–1307,
http://dx.doi.org/10.1109/ICACCI.2017.8126021, URLhttp://ieeexplore.ieee. org/document/8126021/.
[38] Maowei Cheng, Worku J. Sori, Feng Jiang, Adil Khan, Shaohui Liu, Recurrent neural network based classification of ECG signal features for obstruction of sleep apnea detection, in: 22017 IEEE International Conference on Computational Science and Engineering (CSE) and IEEE International Con-ference on Embedded and Ubiquitous Computing (EUC), IEEE, Guangzhou, China, 2017, pp. 199–202, http://dx.doi.org/10.1109/CSE-EUC.2017.220, ISBN:978-1-5386-3220-8 978-1-5386-3221-5. URL http://ieeexplore.ieee. org/document/8005997/(visited on 03/10/2019).
André Pinho holds a BSc at Universidade da Beira Interior (UBI), Covilhã,
Portugal (2016). He is a member of the Assisted Living Computing and Telecom-munications Laboratory (ALLab), a research group within the Instituto de
Tele-comunicações at UBI. His current research interests include machine learning,
algorithms for bio-signal processing, e-Health and clinical decision support systems.
Nuno Pomno is an Assistant Professor at University of Beira Interior (UBI),
Covilhã, Portugal. His current research interests include information systems (with a special focus on clinical decision support systems), data fusion, artificial intelligence, and software. He is the coordinator of the Ambient Living Comput-ing and Telecommunication Laboratory (ALLAB) at UBI. He is also a member of BSAFE Lab, and Instituto de Telecomunicações - IT at UBI. Member of the COST Action CA15109 "European Cooperation for Statistics of Network Data Science (COSTNET)’’.
Bruno M.C. Silva holds a Ph.D. degree in Computer Science Engineering from the
University of Beira Interior (Covilhã, Portugal) in 2015. Currently, He is Assistant Professor, Head of the Technology Department and coordinator of Games & Apps Development Course at Universidade Europeia, IADE - Faculty of Design, Technology, and Communication. He is also an Invited Assistant Professor at University of Beira Interior (Covilhã, Portugal) and a Senior Research at Instituto
de Telecomunicações(Covilhã delegation). He is a member of many international
TPCs and participated in several international conferences organization. He authors or co-authors several international conference papers and International Journal publications. His research areas include: Delay Tolerant Networks; Vehicular Networks; Mobile Computing; but especially: e-Health; Mobile Health; Internet of Things; Ambient Assisted Living.
K. Bousson received an MEng degree in aeronautical engineering from the
Ecole Nationale de l’Aviation Civile (ENAC) in 1988, an MSc degree in computer science (with emphasis on Artificial Intelligence) from Paul Sabatier University in 1989, and a PhD degree in control & computer engineering from the Institut National des Sciences Appliquées (INSA) in 1993, all in Toulouse France. He was a researcher at the LAAS Laboratory of the French National Council for Scientific Research (CNRS) in Toulouse, from 1993 to 1995, and has been a professor in the Department of Aerospace Sciences at the University of Beira Interior, Covilhã, Portugal, since 19958. His current research activities include trajectory optimization and control of aerospace vehicles, robust filtering, and control uncertain systems, and computational intelligence. Dr. K. Bousson is a Member of the Portuguese Association for Automatic Control (APCA) and a Senior Member of the American Institute of Aeronautics and Astronautics (AIAA).
Nuno M. Garcia holds a Ph.D. in Computer Science Engineering from the
University of Beira Interior (UBI, Covilhã, Portugal)(2008) and he is a 5-year BSc in Mathematics/Informatics (Hons.) also from UBI (1999–2004). He is Assistant Professor at the Faculty of Engineering Computer Science Department at UBI and Invited Associate Professor at the Universidade Lusófona de Humanidades e
Tecnologias (Lisbon, Portugal). He was the founder and is the coordinator of
the Assisted Living Computing and Telecommunications Laboratory (ALLab), a research group within the Instituto de Telecomunicações at UBI. He was also co-founder and is the coordinator of the Executive Council of the BSAFE LAB - Law enforcement, Justice and Public Safety Research and Technology Transfer Laboratory, a multidisciplinary research laboratory in UBI. He is the coordinator of the Cisco Academy at UBI and Chair of the COST Action IC1303 AAPELE - Architectures, Algorithms, and Platforms for Enhanced Living Environments (Brussels, Belgium). He is the main author of several international, European and Portuguese patents. He is a member of the Non-Commercial Users Constituency, a group within GNSO is ICANN. He is also a member of ISOC. His main in-terests include Next-Generation Networks, algorithms for bio-signal processing, distributed and cooperative protocols.