Crack Formation and Growth During Thermal-Shock and
Mechanical Cycles in Refractories
Maria João Margarido Rodrigues Master Dissertation
Supervisor in FEUP: Prof. Jorge Lino Alves Supervisor in Tata Steel: Kirill Andreev
Integrated Master in Mechanical Engineering July 2019
Abstract
The present dissertation aimed at studying crack formation and growth in silica refractories under cyclic thermal-mechanical loading, which is one of the main causes of failure in service conditions. Two methodologies of tests were carried out: mechanical and thermal-shock cyclic tests. The application of Digital image correlation (DIC) for both approaches was also studied. The thermal shock tests were carried out between 200 °C and room temperature for samples of different sizes. The damage was assessed by ultra-sound measurements. The crack development was visually registered after each cycle and the Hausdorff parameter was calculated for the fracture surfaces. A theoretical approach was also used and confirmed the results obtained The mechanical test selected was the wedge splitting test. The compliance and irreversible displacements were calculated to evaluate damage development throughout the test. The fracture surfaces were analysed using a wide area 3D measurement system and different roughness parameters (including the Hausdorff parameter) were calculated.
It was possible to observe that in thermal shock tests the strain is determined by the size of the sample. Three patterns of damage development were observed: exponential, sigmoidal and saturation for large, intermediate and small samples respectively. It was observed that the standard size for thermal-shock testing might not represent the service conditions. In mechanical tests, both exponential and sigmoidal behaviours were observed depending on the amplitude tested (higher amplitude - higher tendency for exponential behaviour).
For thermal shock tests, the roughness increased with the number of cycles until a peak was reached, after which the roughness decreased and stabilized for a high number of cycles. In mechanical tests, due to the lack of relevant data, the presence of this peak could not be confirmed. The roughness in the thermal shock surfaces tended to be higher than in the mechanical tests.
DIC was used to measure crack opening during the tests. It also enabled to identify cracks before they were visually detected and to predict their path. The crack opening measurements were in agreement with the experimental results obtained and the theoretical approach used. While mechanical and thermal shock tests are inherently different, similar behaviours in the damage and crack development were possible to observe.
Formação e Desenvolvimento de Fendas em Refratários Durante Ciclos
de Choque Térmico e Mecânicos
A presente dissertação focou-se no estudo da formação e crescimento de fendas em tijolos de sílica submetidos a cargas termomecânicas, as quais são uma das principais causas de falha nas condições de serviço. Foram utilizadas duas metodologias de teste distintas: testes cíclicos mecânicos e de choque térmico. A aplicação de correlação digital de imagem, para ambos os testes, foi também estudada.
Os testes de choque térmico foram efetuados entre 200 °C e a temperatura ambiente para amostras de diversos tamanhos. A degradação das amostras foi estudada através da medição da velocidade do som durante os ciclos. O desenvolvimento das fendas foi visualmente registado em cada ciclo e a constante de Hausdorff foi calculada para cada superfície de fratura. Foi também utilizada uma abordagem teórica que confirmou os resultados experimentais obtidos O teste mecânico escolhido foi o wedge splitting test. A flexibilidade e os deslocamentos irreversíveis foram calculados de modo a avaliar a desenvolvimento do dano durante o teste. As superfícies de fratura foram analisadas usando um sistema de medição de área 3D e foram calculados diversos parâmetros de rugosidade.
Foi possível observar que nos testes de choque térmico a carga/deformação é determinada pelo tamanho das amostras. Foram observados três comportamentos de desenvolvimento de dano distintos: exponencial, sigmoidal e saturação, para amostras de grandes, intermédias e pequenas dimensões respetivamente. Foi observado que o tamanho normalizado para testes de choque térmico pode não ser representativo das condições de serviço. Nos testes mecânicos, tanto o desenvolvimento de dano exponencial como sigmoidal foram observados, dependendo da amplitude de teste utilizada (quanto maior a amplitude mais provável é observar-se o comportamento exponencial).
Para os testes de choque térmico a rugosidade aumentou com um número de ciclos até ser atingido um pico, após o qual a rugosidade decresceu e estabilizou para um elevado número de ciclos. Nos testes mecânicos a presença deste pico não pode ser confirmada devido à falta de dados relevantes. A rugosidade encontrada nos testes de choque térmico tendeu a ser superior à dos testes mecânicos.
A técnica de correlação digital foi utilizada para a medição da abertura da fenda durante os testes. Esta técnica permitiu ainda detetar fendas que não eram visíveis e prever a sua trajetória. As medidas de abertura de fenda obtidas em ambos os testes estiveram de acordo com os resultados experimentais obtidos e com o algoritmo utilizado
Embora os testes térmicos e mecânicos sejam inerentemente distintos foi possível observar um comportamento similar para ambos, tanto no desenvolvimento do dano como na formação e crescimento das fendas.
Acknowledgements
Firstly, I would like to thank Sido Sinnema for the possibility of participating in this project. I would also like to thank my supervisor at Tata Steel, Kirill Andreev for the help and guidance throughout the project.
Additionally, I would like to thank Paul Tamis for the help in the simulation and Donald Mittertreiner, Frank Van der Does and Mustafa Keskin for all the support during the experimental procedures.
Moreover, I would like to thankall the employees at the Ceramic Research Centre which were very welcoming and created a friendly work environment.
I would also like to thank the University of Porto and specially my supervisor at FEUP, Fernando Jorge Lino Alves which, was always available for my questions and doubts throughout the project.
I would like to thank my family for all the support they gave me throughout this project. Finally, I would like to thank both Tata steel IJmuiden and the Erasmus programme for the financial support.
Contents
1 Introduction ... 1
1.1 Project Framing ... 1
1.2 Increasing Value in Use of Refractory Linings in Tata Steel IJmuiden ... 1
1.3 Project Goals ... 1
1.4 Project Methodology... 2
1.5 Structure ... 2
2 Bibliographic Review ... 5
2.1 Refractories ... 5
2.2 Microstructure and Failure ... 8
2.3 Analysis of Thermo-Mechanical Failure ... 11
2.3.1 Analytical……….11
2.3.2 Thermal Cycle………14
2.3.3 Mechanical Cycl……….16
2.4 Wedge Splitting Test (WST) ... 18
2.5 Digital Image Correlation ... 20
2.6 Fractal Analysis ... 21
3 Materials and Methods ... 23
3.1 Thermal Cycle Tests ... 25
3.1.1 Damage Measurements ... 27
3.1.2 Fractography ... 29
3.2 Mechanical Tests ... 31
3.2.1 Wedge Splitting Test ... 31
3.2.2 Fractography ... 35
4 Results and Discussion ... 39
4.1 Mechanical Tests ... 39
4.1.1 Damage Development ... 39
4.1.2 Fractography ... 41
4.1.3 Digital Image Correlation ... 45
4.2 Thermal Cycle Tests ... 49
4.2.1 Damage Development ... 49
4.2.2 Fractography ... 65
4.2.3 Thermal Cycles ... 83
4.3 Comparison between mechanical and thermal cycle tests ... 84
4.3.1 Damage Development ... 84
4.3.2 Roughness ... 86
5 Conclusions ... 89
6 Future Work ... 91
References ... 93
Appendix A: Technical drawing S1 and S ... 97
Appendix B: Crack Development (Area Calculation) ... 99
Appendix C: Crack Profile ... 101
Appendix D: Digital Image Correlation ... 103
List of Symbols A - Area
A total - Total area created if crack fractured. AP - Area of the projection of the fracture surface
𝐴𝑛 - Percentual increase in the area in the respective n cycle. b - Height
Bi - Biot number 𝐶 - Compliance
D - Hausdorff dimension
Db - Displacement correspondent to the minimal force reached in a given cycle dh - Distance grown in the normal direction
Dt - Displacement correspondent to the maximal force reached in a given cycle Dirr - Irreversible displacement for a N cycle
dw - Distance grown in the transversal direction E - Young’s modulus
E0 - Young’s modulus before the experiment Ed - Young’s modulus after the experiment Fb - Minimal force reached in a given cycle
FH - Splitting force (horizontal component of the force in the wedge splitting test) FV - Vertical force of the test machine in the wedge splitting test
FHmax - Maximum load
Ft - Maximum force reached in a given cycle H - Hurst exponent
H - Coefficient of heat transfer K - Thermal conductivity KI - Stress intensity factor KIC - Fracture toughness
𝐾 - Maximum stress intensity factor
𝐾∗ - Normalized maximum stress intensity factor
L - Length
Lc - Characteristic length
𝐿𝑒𝑓𝑓 - Effective characteristic length Lth - Theoretical characteristic length N - Number of the cycle
n - Euclidian dimension
𝑅 - kinetic thermal shock damage resistance Rst - quasi static thermal shock resistance
Sa - Arithmetical mean height Sq - Root mean square height
Sz - Maximum height
𝑡∗ - Dimensionless time of occurrence of 𝜎∗
𝑡∗ - Dimensionless time of occurrence of 𝐾∗
V - Volume
v - Velocity of sound
𝛼 - Linear coefficient of thermal expansion
𝛽 - Slop obtained from the straight-line fit performed on the Fourier power spectrum
𝛾 - Work-of-fracture (measured originally by Nakayama and subsequently by Tattersall and Tappin);
𝛿 - Load point displacement δult - Ultimate displacement 𝛥𝑇 - Thermal gradient
𝛥𝑥 - Displacement in the x direction
∆𝑥𝑖 - Displacement in x direction in point i ∆𝑥 𝑐𝑟𝑎𝑐𝑘 - Crack opening 𝜀 - Real strain 𝜈 - Poisson’s ratio Ρ - Specific density 𝜎 - Nominal strength 𝜎 - Maximum stress 𝜎 , - Tensile strength
𝜎∗ - Normalized maximum stress
List of Figures
Figure 1 - Schematic microstructures of refractories made from (a) large aggregate and finer matrix
powders and (b) cast, electrofused ceramic……… 8
Figure 2 - SEM image of a low cement castable containing a range of aggregate phases including tubular Alumina (TA), white fused alumina (FA, lack of second phases) and sintered magnesia (M, with light contrast calcium and magnesium silicate second phases). HA is a hydratable alumina in the matrix………9
Figure 3 – Schematic of the crack process zone for refractory materials. CMOD – Crack mouth opening displacement………...10
Figure 4 – Thermal fatigue damage curve for a general property P, where P decreases with increasing thermal fatigue damage. P0 is the property before the cycles and Psat the property after N number of cycles when saturation occurs……….15
Figure 5 – Schematic representation of cyclic tests for both Method II and Method III………17
Figure 6 – Schematic drawing showing the cumulative acoustic emission signals (A.E) and the load, function of time. Representation of three different periods of damage accumulation for refractory materials in cyclic loading………...18
Figure 7 – Schematic representation of the wedge splitting test. FV – vertical load, FH – horizontal load, δ - displacement, 1 – wedge, 2 – rolls, 3 – load transmission pieces, 4 – starter notch, 5 – side groove, 6 – linear support………19
Figure 8 –Geometry of the specimen for WST to enable stable crack propagation (dimensions in mm).19 Figure 9 – Schematic load-displacement curves for refractories in the wedge splitting test……….20
Figure 10 – Concrete step after being subjected to load test, showing one large crack but no other visible cracks………..21
Figure 11 – Output from DIC as a map of local deformation showing cracks not visible to the human eye………...21
Figure 12 – Scheme of the experimental procedure………24
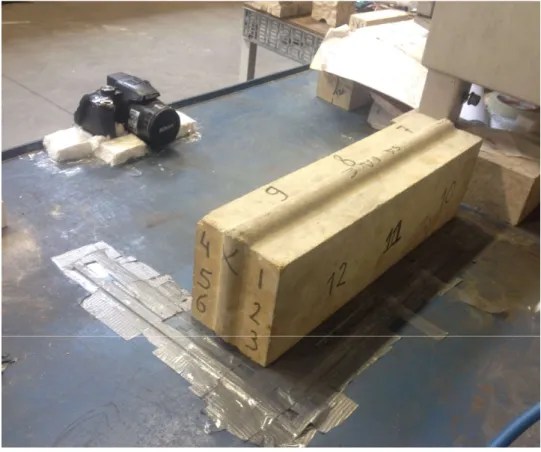
Figure 13 – Different sizes of samples tested………...25
Figure 14 – Technical drawing of the XL samples……….25
Figure 15 – Marked surfaces on the samples and oven used for the thermal shock………..26
Figure 16 – Damage measurements procedure………27
Figure 17 – Measurements points for XL samples………...27
Figure 18 – Measurements points for L samples………..27
Figure 19 – Measurements points for M samples……….28
Figure 20 – Measurements points for S and XS samples………28
Figure 21 – White grains measurements: Original photo (left), photo after photoshop manipulation (middle), Photo used for the measurements in Fiji software (right)……….29
Figure 22 –Samples surfaces: samples with low contrast with marks (left and middle), sample with high contrast (right)……….30
Figure 23 – Set up used to capture the photos for Digital Image Correlation………..30
Figure 24 – Set up used throughout the cycles to capture the photos or DIC………...…….31
Figure 25 – Sample for wedge splitting test - geometry 1………32
Figure 26 – Sample for wedge splitting test - geometry 2………32
Figure 27 – Sample for wedge splitting test with wedge mounted………...33
Figure 29 – Configuration of the wedge splitting test with DIC………...34
Figure 30 – Wide-Area 3D Measurement SystemVR-300 from Keyence………..35
Figure 31 – Surface area measurements for both convex (left) and concave (right) regions of one of the samples tested……….36
Figure 32 – White grains measurements: Original photo (left) and photo used for the measurements in Fiji (right)………36
Figure 33 – Selection of three distinct profiles using Analyser Software VR-H2AE from Keyence……37
Figure 34 – Force displacement curves for wedge splitting test for different bricks………39
Figure 35 – Fracture surface of the Brick 1- monotonic (left) and cyclic (right)………..41
Figure 36 – Fracture surface of the Brick 3f – Monotonic (left) and Cyclic (right)……….41
Figure 37 – Fracture surface of Brick 3 – Monotonic (left) and Cyclic (right)………41
Figure 38 – Fracture surface of Brick 5 – Monotonic (left) and Cyclic (right)……….41
Figure 39 – Points were displacements for crack opening were calculated……….45
Figure 40 – Points were displacements for crack opening were calculated. Displacement field (xx) developed at 35 minutes of the beginning of the test………..48
Figure 41 – Interaction of shielding zone for cracks developing at the same time………50
Figure 42 – Manufacturing defects observed in M1 before cyclic thermal shock tests………57
Figure 43 –Scale used for thickness distinction in the different cracks………65
Figure 44 – Cracks at the end of the last thermal cycle for XL samples………66
Figure 45 – Cracks at the end of the last thermal cycle for L samples………66
Figure 46 – Cracks at the end of the last thermal cycle for M samples……….66
Figure 47 – Crack development in L1 after 6 cycles………67
Figure 48 – Crack development in XL1 after 7 cycles (top left), 13 cycles (top right) and 26 cycles (bottom). Red represents the cracks that appeared in the first wave, blue the cracks in the second wave and green the cards in the third wave………..67
Figure 49 –Crack development in sample L2 after 20 cycles. Arrows indicate cracks which deflect and arrest………68
Figure 50 – Fracture surface of XL1 ZY1………69
Figure 51 – Fracture surface of XL1 ZY2………70
Figure 52 – Fracture surface of XL2 ZY1………70
Figure 53 – Fracture surface of XL2 ZY2………71
Figure 54 – Profile of both sides of cracks ZY1 and ZY2 from XL1………72
Figure 55 – Profile of both sides of cracks ZY1 and ZY2 from XL2 sample………73
Figure 56 – Profile of both sides of crack ZY3 from S2 sample………...73
Figure 57 – Location of the points were displacements were measured during cooling………..76
Figure 58 – Displacement x during cooling of XS1: First phase (left), Second phase (right)…………76
Figure 59 – Displacement y during cooling of S1………77
Figure 60 – Displacement y during cooling of XS1………77
Figure 61 – Location of the points were displacements in x direction were calculated in sample SI1…77 Figure 62 – Crack appearance at the beginning of the cooling phase – after 9.5 min (top) and crack appearance at the end of the cooling phase – after 2 hours and 40 minutes (bottom)………79
Figure 63 – Photo and respective DIC image of displacements x for XL4 in the first cycle after 16
minutes in the cooling stage………81
Figure 64 – Photo and respective DIC image of displacements x for XL4 in the x cycle after x minutes in the cooling stage………..82
Figure 65 – Photo (left) and respective DIC (middle) of the displacements x for XL3 in the cycle 2 after x minutes in the cooling stage. Photo of sample after fracture, cycle 5 (right)……….…82
Figure 66 – Results of the simulation for both heating (left) and cooling (right) conditions………83
Appendixes Figure A1 – Technical Drawing of XL samples………..….97
Figure B1 – Crack zy2 in SI1 in different faces: Side A, bottom and side b (left to right)………99
Figure B2 – Scheme of crack development throughout the different cycles………..…………...……...99
Figure C1 – Crack profile highlighted………...101
Figure C2 – Grid created using Adobe Photoshop……….101
Figure C3 – Comparison between real profile and calculated profile………102
Figure D1 – Definition of the Surface Component and assessment of Pattern quality………...103
Figure D2 – Quality of pattern for natural surface (left) and artificial pattern in surface (right)……….103
Figure D3 – Definition of a scale in GOM Inspect Software………..104
Figure D4 – Set up used for DIC………104
Figure D5 – Measurements of two different displacements, d2 and d3 (from right to left)………105
List of Graphs
Graph 1 - Production (%) of the major refractory producing countries………5
Graph 2 – Typical load displacement curve of quasi-brittle materials; Region I is linear, region II is non-linear, and region III is post peak softening……….10
Graph 3 – Maximum surface stress (cold shock) and maximum centre stress (hot shock) as a function of 1/Biot………..………14
Graph 4 – Thermal expansion values of different crystallographic forms of silica………23
Graph 5 and Graph 6 – Irreversible strain and compliance (left to right) for each cycle……….40
Graph 7 –Compliance for each cycle for the samples with high number of cycles………40
Graph 8 – Roughness (Sa) for the different samples tested………..42
Graph 9 – Roughness (Sq) for the different samples tested………..42
Graph 10 –Roughness (Sz) for the different samples tested……….42
Graph 11 –Hausdorff for the different samples tested……….43
Graph 12 –Ratio of the surface area to the cross-section area for the different pair of samples………..43
Graph 13 –Percentage of white grains for the different samples……….43
Graph 14 and Graph 15 –Sa (left) and Sz (right) parameter for the different number of cycles……….44
Graph 16 and Graph 17 –Sq parameter (left) and Surface area ratio (right) for the different number of cycles………..44
Graph 18 –Hausdorff dimension for samples subjected to wedge splitting test with different number of cycles………..45
Graph 19 –Force displacement curve of Brick 8 sample D………46
Graph 20 –Displacements of points 1 to 6 in brick 8 sample D during WST………46
Graph 21 – Crack opening and force developed during WST of brick 8 sample D………..46
Graph 22 – Crack opening and Force During WST of brick 8 sample D- First stage………..47
Graph 23 – Crack opening and force developed during WST of brick 8 sample C………..47
Graph 24 – Force Displacement curve developed in WST of brick 8 sample C………48
Graph 25 –Initial damage variation throughout the different points of sample XL1 and XL2………49
Graph 26 – Damage development in XL1 for the points in the longitudinal direction n………..49
Graph 27 – Damage development in XL2 for the points in the longitudinal direction……….50
Graph 28 – Damage development in XL1 for the points in the transversal direction………..51
Graph 29 – Damage development in XL2 for the points in the transversal direction………...51
Graph 30 – Damage development in XL1 for the points in the normal direction………52
Graph 31 – Damage development in XL2 for the points in the normal direction………52
Graph 32 – Initial damage variation throughout the different points of sample L1 and L2………..53
Graph 33 – Damage development in L1 for the points in the longitudinal direction n………53
Graph 34 – Damage development in L2 for the points in the longitudinal direction………54
Graph 35 – Damage development in L1 for the points in the transversal direction………54
Graph 36 – Damage development in L2 for the points in the transversal direction……….55
Graph 38 – Damage development in L2 for the points in the normal direction………55 Graph 39 – Damage development in M1 for the points in the longitudinal direction………...56 Graph 40 – Damage development in M2 for the points in the longitudinal direction………..56 Graph 41 – Damage development in samples of smaller dimensions for the points in longitudinal direction………..57 Graph 42 – Evolution of the dimensionless maximum stress with the inverse of the Biot and location of the samples analysed in this function………..59 Graph 43 – Evolution of the dimensionless maximum stress with the inverse of the Biot. Size of the samples analysed displayed………60 Graph 44 – Evolution of the dimensionless time to achieve maximum stress with the inverse of the Biot and location of the samples analysed in this function………..61 Graph 45 – Evolution of the dimensionless time to achieve maximum stress intensity factor with the inverse of the Biot and location of the samples analysed in this function for hot and cold shock (coincidence curve)……….61 Graph 46 – Real strain calculated with theoretic characteristic length (Lth) and effective characteristic length (Leff) for the different samples……….62 Graph 47 – Real stress intensity factor calculated with theoretic characteristic length (Lth) and effective characteristic length (Leff) for the different samples………...62 Graph 48 –Real time to achieve maximum strain calculated with theoretic characteristic length (Lth) and effective characteristic length (Leff) for the different samples………..63 Graph 49 – Real time to achieve maximum stress intensity factor with theoretic characteristic length (Lth) and effective characteristic length (Leff) for the different samples………..63 Graph 50 – Evolution of the dimensionless maximum stress with the inverse of the Biot. Size of the samples tested, and samples indicated in DIN 993–11 displayed………64 Graph 51 – Damage developed in the first cycle for the predicted strain by Lu and Fleck………..65 Graph 52 – Damage developed in the first cycle where a crack was observed for the predicted strain by Lu and Fleck………65 Graph 53 –Influence of the length (volume) available for crack development with the crack area
developed at first appearance in mm2………..69
Graph 54 – White grains percentage with the number of cycles to fracture………71 Graph 55 – Fourier Power spectrum of XL2 ZY2 – side B………74 Graph 56 – Hausdorff constant obtained for samples which undergone thermal-shock tests…………75 Graph 57 – Displacements in x direction in different areas of the sample S1………..75 Graph 58 – Displacement y during cooling of S……….76 Graph 59 – Displacements in x direction in the defined points of the sample L1……….78 Graph 60 – Crack opening of two cracks in L1. Dashed line represents the time were maximum stress intensity factor is expected to occur based on Lu and Fleck analysis………..78 Graph 61 – Crack opening in sample XL3 during cycle 2, 3 and 4. Lines represent the beginning of a new cycle and dashed lines represent the time were maximum stress intensity factor is expected to occur based on Lu and Fleck analysis………80 Graph 62 – Crack opening in sample XL4 during cycles 4 to 9. Lines represent the beginning of a new cycle and dashed lines represent the time were maximum stress intensity factor is expected to occur based on Lu and Fleck analysis………80 Graph 63 –Temperature profile in the centre of XL samples during heating………83 Graph 64 –Temperature profile in the centre of XL samples during cooling……….84
Graph 65 – Influence of the cycle number where first, second and third crack appear on the predicted Lu and Fleck strain, for each size of samples tested in thermal shock……….85 Graph 66 – Influence of the cycle number were first fracture occur on the predicted Lu and Fleck strain for each size of samples tested in thermal shock………85 Graph 67 – Fatigue behaviour at room temperature for silica bricks obtained with different mechanical tests. 3PB - three point bending tests, WST – Wedge splitting test……….………….86 Graph 68 – Influence of number of cycles in the roughness for both mechanical and thermal-shock
tests………..87
Appendixes
List of Tables
Table 1 – Weakly Project planing……….2 Table 2 – General Features and application of several refractories………..6 Table 3– List of three criteria categories: stress-based criteria, strain-based criteria and energy-based criteria……….12 Table 4 – Properties of Silica Bricks (KOK)………24 Table 5 – Sizes of the samples used for thermal shock testing……….26 Table 6 – Types of loading that each sample was subjected in the wedge splitting test for geometry 1...33 Table 7 – Types of loading that each sample was subjected in the wedge splitting test for geometry 2...33 Table 8 – Theoretical characteristic length (Lc), Biot (Bi) and the inverse of Biot (1/Bi) for all the samples………58 Table 9 – Effective characteristic length (Leff), Biot (Bi) and the inverse of Biot (1/Bi) for all the samples………59 Appendixes
1 Introduction
1.1 Project Framing
The present dissertation was conducted at Tata Steel IJmuiden in the COE Refractories at Lab 3 of Tata Steel R&D in a partnership with the Mechanical Engineering Department of the Faculty of Engineering of the University of Porto, Portugal, as a Master Thesis Dissertation within the Production, Conception and Manufacturing option of the Integrated Master in Mechanical Engineering.
1.2 Increasing Value in Use of Refractory Linings in Tata Steel IJmuiden
Tata Steel is one of the largest and most advanced steel producers in the world. To produce steel, it operates various high temperature units (e.g. blast furnace, coke ovens) that are lined with special ceramic refractory materials (refractories). During service, refractories are exposed to cyclic thermo-mechanical loads. Over time, the loads cause cracking and degradation of the units. A part of the direct costs is allocated to restore the lining. Moreover, the unplanned failure of refractories can inflict significant losses due to unrealised production and can ultimately be a cause of serious material damage. Additionally, it can also represent a threat to the health of the personnel. Proper refractory lining is one of the key enablers of a reliable and efficient steelmaking process.
There are many alternative refractories on the market. Tata Steel IJmuiden, as the user of these materials, constantly monitors the market to select the most suitable. In-house Ceramics Research Centre has the duty to provide, in cooperation with other technical and financial departments, the best value in use concepts of the refractory linings. Those should combine high reliability and be cost effective. On annual basis, the savings of several millions of Euros are achieved. The duties of the Centre include testing of refractories, modelling of the linings and related process, data analysis (including Advanced Analytics), in-field measurements of the linings. The testing is done for Quality Control and to assess the specific properties of refractories. The latter is seen as a critical enabler for all other activities of the Ceramics Research Centre.
1.3 Project Goals
The project aims at contributing to the development of advanced test procedures to assess the refractories resistance to cyclic failure. Traditionally, the selection of the materials is based on the ranking of properties measured for the alternative materials. Modern trends of prolonged campaign lives and increased demand for reliability of the performance warrant algorithms predicting the response of materials in given process conditions. In this way, the material properties are to be compared with the loads inflicted by the process. The project goal is to contribute to the activity to develop effective methods to predict and monitor cyclic fatigue degradation due to thermal and mechanical cyclic loads. Damage development due to different loading schemes will be assessed by non-destructive techniques and by fractography. For the latter, alternative techniques will be tried. The correlation of the test piece geometry and the
damage progress will be studied. The diagrams relating the progress of damage and load intensity will be created.
1.4 Project Methodology
The organization of the work was based on Table 1. The first weeks were used for literature survey and preparation of samples. When samples were prepared the experiments were carried out. Weekly meetings were conducted throughout the project for updates on the results of the experimental procedure and decision making in relation with the direction of the project. A mid-term presentation was also carried out to show the progress development. The experimental procedures were not completely delimited from the beginning since they depended on the results of the first tests. Therefore, the approach used was an iterative one, which allowed to define new tests based on the results and questions which would arise from the first results. To enable this type of organization the analysis and interpretation of the results were done in parallel with the experimental procedure. The dissertation was developed throughout the project. The final weeks were left for the finalization of the dissertation.
Project plan:
Activity 1: Literature survey Activity 2: Preparation of samples
Activity 3: Conduction of the experiments, post-processing of the results Activity 4: Analysis of the experimental results
Activity 5: Final report: Reporting of experimental findings and analysis. Xx* - mid-term presentation
Tabel 1 – Weakly Project planing
1.5 Structure
The structure of this dissertation was defined to enable an easier understanding of the problems at hand. Firstly, a bibliographic review of refractories is presented. In this section, the different types of refractories as well as their application and main properties are studied. The failure of these materials and the crack formation is also explored as well as the influence of their microstructure in the failure mechanisms. This brief overview of these materials is followed by the study of different methodologies used in literature to access thermal shock resistance in refractories. Three different approaches are explored as well as their advantages and limitations: analytical, mechanical and thermal approaches. The last section in the bibliographic review is dedicated to several techniques used during the project which required some background information and, therefore, a brief presentation of them was considered pertinent.
Weeks (Start at : 06/02/2019) 1-2 3-4 5-6 7-8 9-10 11-12 13-14 15-16 17-18 19-20 Activity 1 xx xx xx xx xx xx xx xx Activity 2 xx xx xx Activity 3 xx xx xx xx xx xx xx Activity 4 xx xx xx xx xx xx Activity 5 Xx* xx xx xx xx
Secondly, the materials and methodology used during the work are presented. The project can be divided into two different branches: the mechanical and the thermal tests. Despite the materials study in both being the same, the methodologies used are different, and therefore these branches are presented independently. In both approaches the main focus is to study how damage and cracks develop.
The following section is the results and discussion. Since a high number of different tests and analysis were carried out for the different branches, it was considered that presenting both the results and the analysis simultaneously would enable a better understanding of the discussion. To validate the results, an analytical approach already developed by Lu and Fleck (1998)[1] is also considered. In both branches, the application of digital image correlation was also studied. In the last section of this chapter, a comparison of the different methodologies used (mechanical and thermal) is also presented.
Finally, the conclusions of the work developed are presented as well as some consideration for future work.
To avoid an unnecessary descriptive and dense dissertation, several methodologies carried out are presented with more detail in the Appendixes. In this section, images representative of crack development during the thermal cycles are also presented for all the samples sizes.
2 Bibliographic Review
2.1 Refractories
Refractories are materials capable of withstanding high temperatures. These materials are normally ceramics with high melting point that are able to maintain their properties at elevated temperatures.ASTM C71 defines them as non-metallic materials having chemical and physical properties that make them applicable for structures or components of systems that are exposed to environments above 538°C [2]. The main consumer of this type of materials is the iron and steel industry, which consumes about 65% of production [3]. Other industries such as the glass melting, cement and ceramic industries are also significant consumers of refractories, using 8 % of production [3]. Globally, the total refractory production is about 38.6 million tons. Graph 1 shows the percentual production of the primary refractory manufacturing countries [2]. The main application of these materials is for furnace linings, kilns, boilers, incinerators or applications where resistance to high temperature is necessary ([4], [3]).
Graph 1 - Production (%) of the major refractory producing countries [2].
There are several ways to classify refractories. They can be divided by their chemical nature: basic, neutral or acid. They can also be distinguished by a physical classification, based on the shape of the products: shaped (bricks or cast shaped), unshaped (monolithic) and fibrous materials [5].
Acidic refractories are those that are resistant to any acidic conditions like slag, fume, and gases at high temperatures. But they are readily attacked by any basic slag or basic environments. Examples of acid refractories are Silica or Zirconia. On the contrary, basic refractories are attacked by acidic components but stable against alkaline slags, dust, fumes, and environments, for example refractories such as Magnesia or Doloma (calcined dolomite). Neutral refractories
are chemically stable to both acidic and alkaline environments. However, some of these materials behave with some chemical affinity at high temperatures and therefore their use for high aggressive environments at high temperature is rare. Examples of these refractories are Carbon or Graphite and Alumina [2].
In Table 2 the most common refractories are represented as well as their main advantages/limitations and applications.
Table 2 – General features and application of several refractories. Adapted from [4].
Families General Features Application
SiO2
Silica
High strength at high temperatures Residual expansion
Low specific gravity
High expansion coefficient at low temperatures Low expansion coefficient at high temperatures
Coke ovens
Electric arc furnace roof
Fused Silica
Low thermal expansion coefficient Hight thermal shock resistance Low thermal conductivity Low specific gravity Low specific heat
Coke oven door Ladle shroud
Al2O3
Alumina High refractoriness High mechanical strength High slag resistance High specific gravity
Hot stove Stopper head High Alumina Aluminium melting furnace Incinerator MgO Magnesia High refractoriness
Relatively low strength at high temperatures High basic slag resistance
Low thermal shock resistance
Low durability at high humidity - Hygroscopic
Hot-metal mixer Electric arc furnace
wall
ZrO2
Zircon
High thermal shock resistance High slag resistance
High specific gravity
Ladle Nozzle Zirconia
High melting point
Low wettability against molten metal Low thermal conductivity
High specific gravity
Nozzle for
continuous casting Crucible
Alumina zirconia silica
High slag resistance
High corrosion resistance against molten glass
Incinerator Ladle
C Carbon
High refractoriness High slag resistance Low oxidation resistance
Blast furnace hearth Electric arc furnace
SiC carbide Silicon
High refractoriness
High strength at high temperature Hight thermal conductivity High thermal shock resistance
Reduced oxidation resistance at high temperature
Blast furnace Incinerator
Refractories in industrial installations are usually subjected to thermo-mechanical cyclic loads, which are the major cause leading to their premature failure. This happens due to temperature fluctuations during batch production cycles, for example, when molten metal is introduced into a relatively cold ladle or when an operating furnace is suddenly opened, exposing the refractory to cold air [6]. These loads are mainly strain-controlled since they result from the thermal expansion of the materials [7].
Refractory materials will work in high temperature conditions and under thermomechanical loads. Therefore, they must be chemically and physically stable at high temperatures. Depending on the operating environment, they need to be resistant to thermal shock, to be chemically inert, and/or to have specific ranges of thermal conductivity and of the coefficient of thermal expansion [2].
In terms of physical properties, the porosity is one of the most important properties since it influences not only the mechanical properties and thermal properties but also the reaction between the refractory material and gas or liquids during service at high temperatures [4].This interaction is mostly affected by open pores. The closed pores are the ones that are not connected to the surface. The apparent porosity is the ratio of the volume of the open (surface) pores, into which a liquid can penetrate, to that of the total volume of the sample, expressed as a percentage [2]. The porosity of these materials can range from relatively dense (up to 10% porosity) bricks to low density (90% porosity) fibrous thermal insulation [8].
The chemical properties should also be taken into consideration since refractories are in contact with different chemical environments and with chemically active solids, liquids, or gases at high temperatures. Hence, for refractories, resistance to these chemicals is necessary to ensure structural integrity, performance, and life of refractory and furnace structure. The corrosion behaviour depends not only on the chemical affinity but also on the porosity, impurities (amount and types) and strength [2]. The evaluation of the chemical composition of a refractory is important to understand and predict how will the combination of phases given by the equilibrium diagram vary with temperature [4].
Thermo-mechanical properties are also of extreme importance since the refractory will be subjected to mechanical loadings with varying degrees of intensity. The behaviour of a material is greatly dependent on the temperature. The main important thermal properties are the thermal expansion, the thermal conductivity and heat capacity [2]. In service, refractories face compression, bending, shear, and sometimes partial tension and twisting. Moreover, all these different loadings are generally active simultaneously. The principal mechanical properties used to describe the mechanical behaviour of refractories are the cold crushing strength and the modulus of rupture (MOR). To characterize the fracture behaviour, the wedge splitting test can be used [2].
Since the service temperature of refractory materials is high, it is important to evaluate the mechanical properties at the same range of temperatures of the service conditions. Refractories must have enough strength to withstand the load of the furnace and the mechanical action of the charge and process materials at the processing conditions [2].
Refractories are made from natural materials so, the presence of impurities, even in a small amount, is very common. A minor quantity of impurities is enough to form a low melting phase in the refractory which can cause the degradation of strength at elevated temperatures. Since refractories are subjected to high temperatures and loads during long periods of time, they are also susceptible to creep. Under heat and load, the material tends to deform through a viscous flow, which is not elastic. The presence of liquid phase in the material at high temperatures under load cause grain sliding and deformation. A refractory material has better creep resistance if the liquid phase at high temperatures has a higher viscosity [2].
There are two common techniques for measuring strength at high temperatures: the hot modulus of rupture (which is measured in three-point bending test inside a furnace at a desired temperature) and compressive creep which measures the deformation against time under a specific load and temperature conditions.
2.2 Microstructure and Failure
The microstructure of refractory materials can be explained by their manufacturing process. Shaped (brick) manufacture is most often done from powder mixtures which commonly combine grains of several mineral types, graphite flakes and polymer resins to form the final product. These powders have a broad particle size distribution (PSD) which enables small (sub-μm) particles to pack in the gaps between large (up to several mm) particles so that most of the densification occurs during the shape forming operation. This is unlike most engineering ceramics where most densification occurs in the sintering step. Unfired, powder processed, refractories are often 85% dense. Processing from large PSD powders leads to a complicated microstructure composed of large, discrete aggregate (filler) refractory grain particles held together by a continuous bonding matrix often containing extensive porosity, grain and bond microstructure, which can be seen in Figure 1- (a). This microstructure is similar to that of civil engineering concrete. Refractory blocks can also be made from molten liquids produced in electric arc furnaces (EAF) that are poured into graphite moulds and cooled slowly over several days. This process is normally called fused cast. The microstructure obtained with this type of process is much like a cast metal, Figure 1– (b). In this process, crystallization from the melt, and subsequent grain growth, leads to interlocked grains that may be up to several mm long, which results in low levels of porosity and little glassy phase. Because of this, fused blocks are interesting for applications where extreme chemical resistance is required, since liquid ingress is limited by such a microstructure [8].
Figure 1 - Schematic microstructures of refractories made from (a) large aggregate and finer matrix powders and (b) cast, electrofused ceramic [3].
The microstructure of a typical refractory obtained from powder processing consists of grain and bond phases. The grain materials can be made by fusion (alumina, mullite, MgO) and sintering (MgO, Mg aluminate spinel). Fusion is an expensive process due to the high temperature. However, it might promotes the volatilization of impurities which improves the purity of the grains. On the other hand, although sintering is a cheaper process and often achieves lower density grains, these grains have impurities in their boundaries which reduce
the high temperature properties. Fused and sintered grains can easily be distinguishable since fused grains contain a lower proportion of second phase at grain boundaries (Figure 2). Grains can also be obtained from raw materials such as quartz, dolomite, graphite, bauxite, materials that have normally simple pre-processing [8].
Figure 2 - SEM image of a low cement castable containing a range of aggregate phases including tubular Alumina (TA), white fused alumina (FA, lack of second phases) and sintered magnesia (M, with light contrast calcium and magnesium silicate second phases). HA is a hydratable alumina in the matrix. Adapted from [8].
The resistance of refractories to initiation of fracture and crack propagation is regulated by different mechanisms and can be explained by the analysis of refractories with different microstructures [9].
In refractories, material flaws are one of the principal sources of fracture. These flaws can be introduced during the manufacturing process, exposure to aggressive environments or surface preparation. The critical flaws act as stress concentrators and initiate crack propagation, which will lead instantaneously to failure, unless crack arrest mechanisms are developed. These mechanisms are found in some quasi-brittle materials where flaws initiate crack-induced damage [10].
Refractory materials are quasi-brittle material and, therefore, exhibit a non-linear portion of the load-displacement curve (Graph 2). This non-linearity can be explained by the inelastic phenomena occurring near the crack. Two different regions where this phenomena occurs can be defined: the following wake region and the frontal process zone, both regions are illustrated in Figure 3. [5]. In the frontal process zone, microcracking and multiple crack branching are usually observed. In the wake process zone, grain bridging and friction of the crack faces consume energy [9].
Graph 2 – Typical load displacement curve of quasi-brittle materials in the wedge splitting test; Region I is linear, region II is non-linear and region III is post peak softening [11].
Figure 3 – Schematic of the crack process zone for refractory materials. CMOD – Crack mouth opening displacement [5].
Microcracking is typical in this type of microstructures due to the thermal expansion mismatch of the different phases, and due to the lower sintering time of the fine particles, which causes shrinkage and opens cracks between the large particles that take longer to sinter. These microcracks, if smaller than the critical flaw size, can increase the resistance to crack propagation and to thermal shock [3].
The microcrack growth and development is intrinsically connected with the characteristics of the aggregates. Microstructures with low porosity and well sintered aggregates have a higher toughness in comparison with aggregates where a high level of porosity is found. Porosity acts as stress intensity sinks during fracture, which leads to an increased fracture energy and therefore a lower fracture toughness [9].
On the other hand, the presence of microstructural features capable of crack arrest and deflection is needed for high resistance to crack propagation. Materials with homogenous composition throughout the microstructure and well bonded constituents tend to present lower toughness. When aggregates are tougher than the matrix, a more tortuous crack propagation
tends to develop (crack surrounds the aggregates) in comparison with well bonded aggregates of homogenous composition, where the crack path tends to be straight and transverse to the grains and, therefore, less resistance to crack propagation is observed in the latter [9, 12]. 2.3 Analysis of Thermo-Mechanical Failure
The several alternative approaches to study the thermo-mechanical response of refractory materials found in literature can be divided in three main groups: analytical, thermal cycle tests and mechanical cycle tests. In each subsection, each group of methodologies will be addressed along with their respective limitations.
2.3.1 Analytical
The ability of a refractory to resist failure according to its thermo-mechanical response can be evaluated by analytical tools, based on material properties obtained in monotonic loading tests. A simple fracture criterion is considering that fracture will occur when nominal stress reaches a critical value, the strength of the material;
σ=σu (2.1) where:
σu, is the tensile strength σ, is the nominal strength
The stress criterion provides good results for crack-free bodies. However, for bodies containing a crack, it provides a null failure load due to considering a singular stress field in front of the crack tip [13].
On the other hand, Griffith (1921) studied the failure in brittle materials and correlated the low fracture strength observed in these materials with microscopic flaws [14]. From this concept, fracture mechanics was developed. A common used criteria is an energy-based criterion, which states that failure will happen if the crack driving force G equals the crack resistance Gf, where Gf represents the energy necessary to create the unit fracture surface (fracture energy) [10, 13]. This criterion is called the maximum energy release rate criterion.
It can be expressed equivalently in terms of stress-intensity factor KI and fracture toughness KIC (Irwin’s relationship) [13]:
KI =KIC (x) (2.2) where:
KI, is Stress intensity factor
KIC, is Fracture toughness
The maximum energy release rate criterion is physically sound for bodies containing a sufficiently large crack. However, it provides an infinite failure load for a crack-free body because, in the absence of cracks, the stress-intensity factor is zero [13].
Both criteria above only work for the extreme cases. In order to overcome this drawback, several failure criteria have been proposed in the literature. These can be divided into 3 distinct groups: Stress-based, strain-based and energy-based criteria. In Table 3, a list of these different criteria is presented. Among these, the Maximum tangential stress criterion (MTS), the strain energy density criterion (SED) and the maximum energy release rate criterion (G) are classical fracture criteria and have been widely used to study brittle failure [15].
Table 3 – List of three criteria categories: stress-based criteria, strain-based criteria and energy-based criteria [15].
Each group is based in a different concept to describe the fracture mechanism and has intrinsic advantages and disadvantages. The stress‐based fracture criteria are usually described with a simpler set of equations than the energy‐based criteria, and the role of each stress field parameter is clearly represented in estimating the onset of fracture. On the other hand, the energy‐based criteria are based on the concept of energy dissipation due to the crack extension which are based on more realistic platforms [16].
Heping Xie et al. (2009) pointed out the limitation of a strength criteria based on classical elasto-plastic theory to analyse the behaviour of rocks (quasi-brittle materials). These limitations are mainly due to the inhomogeneous microstructure of the rocks. The application of external forces changes the stress and strain distribution within the material, while at the same time some of the dissipated energy may produce damage. Locally, high stress and strain can cause strength deteriorations but not structural failures. The deformation and failure are irreversible processes involving energy dissipation. It is only when strain energy is released completely that failure is achieved [17].
Strength-based criteria as well as criteria based on linear elastic fracture mechanics are not representative of the behaviour of quasi-brittle materials since fracture process zone has an intermediate size (it does not cover all of the sample or is negligible) and shielding mechanisms are developed (micro cracking, bridging) [18].
The strain-based criteria are less common. However, for some geometries and materials, the fracture propagation can be predicted in a more accurate way with these methods than by applying any of the other criteria. Wu et al. [16] pointed out the adequacy of this criteria for predicting the fracture behaviour of concrete. A scalar‐valued function of strain tensor was found to determine the onset of fracture.
Several researchers have applied these criteria and extensions thereof in a wide range of geometries materials and conditions (e.g. fatigue, notch analysis or mixed modes fracture) [13]. The extent of damage during fracture in refractory materials when subjected to thermal stresses can also be approached by an energy criterion. Hasselmen (1996) [19] considered two types of crack propagation: although usually a quasi-static crack extension is observed, a kinetic crack growth is also possible. Similar equations address both situations. In eq 2.3 and 2.4 the kinetic thermal shock damage resistance (𝑅 ) and the quasi static thermal shock resistance (Rst) are shown [5, 20].
𝑅 = 𝐸𝛾 /𝜎 (2.3) 𝑅 = 𝛾 /𝐸𝛼 / (2.4)
where:
E, is the Young’s modulus;
𝛾 , is the work-of-fracture (measured originally by Nakayama and subsequently by Tattersall and Tappin [21]);
𝛼 , is the coefficient of thermal expansion; 𝜎 ,, is the tensile strength.
Considering that the thermoelastic stress can be expressed in simple form for total linear restraint in one dimension, eq 2.5:
𝜎 = 𝛼𝐸 ∙ 𝑓(𝑇) (2.5) where:
𝑓(𝑇), is a function of temperature;
which, when squared on both sides indicates that:
𝜎 ~ 𝛼 𝐸 (2.6) Combining eq 2.4 with eq 2.6, it is possible to assess the inverse proportionality of 𝑅 and 𝑅 with the stress squared divided by the Young modulus (𝜎 /𝐸). This coefficient represents the stored elastic strain energy in an object at the stress level 𝜎, which is the driving force for fracture or crack extension. Therefore, it is possible to conclude that the thermal stress damage resistance decreases as the strength increases and it does so as the square of the strength, which makes high-strength refractories much more susceptible to thermal shock damage [5]. However, this analysis neglects the thermal conductivity, which is a central parameter to thermal shock resistance [1].
Lu and Fleck (1998) developed an analytical algorithm to allow the comparison of the materials performance to cyclic thermal shock over the full range of Biot numbers:
Bi ≡ Lc∙h/k (2.7) where:
Bi, is Biot number Lc, is characteristic length h, is coefficient of heat transfer k, is thermal conductivity
As can be seen from eq 2.7, the Biot number is not only dependent on the properties of the material but also on the geometry of the sample. The maximum stress in the centre and surface of a plate subjected to thermal shock is plotted against the inverse of the Biot number in Graph 3. For higher Biot numbers (higher heat exchange) higher stress is generated in thermal shock. Therefore, in order to successfully predict the fracture behaviour of a component subjected to thermal shock, the material properties, geometry and the thermal field characteristics must be coupled. The faster the heat can diffuse out of the system (smaller thickness, higher thermal conductivity), the lower the gradient temperature will be and therefore lower stress will be generated.
Graph 3 – Maximum surface stress (cold shock) and maximum centre stress (hot shock) as a function of 1/Biot [1].
However, the experimental failure data obtained for brittle materials is generally not reproducible and can fluctuate by an order of magnitude. This can be attributed to the random number and distribution of flaws present in brittle materials. The severity, location and dimension of the flaws is an unknown factor which disables an accurate prediction of the behaviour of a brittle material with these methods. The probability of the presence of a flaw that initiates the crack must be introduced in the analysis.
Because of this, several statistical approaches have been developed, based on functions that describe the distribution of fracture strengths. Two different types of probabilistic-statistical approaches can be distinguished: the phenomenological/macroscopic type (e.g. the Weibull model) and the fundamental type, which considers flaws as physical entities and is based on flaw strength density functions [10].
2.3.2 Thermal Cycle
Another way to study the resistance of refractories due to thermo-mechanical cyclic loads is by the simulation of thermal shock service conditions and by quantifying the damage. The material is more thermal-shock resistant during thermal cycles when no cracks are developed, and a lower loss of Young’s modulus and higher residual strength occurs [22].
The damage can be assessed by measuring the longitudinal velocity of sound between the cycles. Damage causes an increase in transit time (due to micro-cracks) and thus a decrease in the velocity of sound and dynamic Young’s modulus. The latter can be calculated from eq 2.8 [23] :
𝐸 = 𝜌 ( )( . ) v2 (2.8) where:
E, is the Young’s modulus ρ, is the specific density v, is the velocity of sound 𝜈, is the Poisson’s ratio
Therefore, the relative change of the Young’s modulus during the experiment can be used to calculate the damage, considering that the sample density and Poisson’s ratio are not affected by the damage – eq 2.9 [23]:
𝐷𝑎𝑚𝑎𝑔𝑒 (%) = ∗ 100 (2.9) where:
E0, is the Young’s modulus before the experiment
Ed, is the Young’s modulus after the experiment
This type of tests are normally done at a fixed ΔT with N > 1 (number of cycles) [24]. The extent of the thermo-mechanical induced damage can be quantified by its effect on a physical property, for example the Young’s modulus. The accumulation of damage can be a function of the increasing N [24]. Generally, since the resulting damage (elastic modulus) is a function of the number and lengths of the cracks, the decrease in the elastic modulus after a thermal shock is directly related with the nucleation and propagation of the cracks in the material [25]. However, damage may saturate (become independent of N), a behaviour that was found for several ceramic materials and is represented in Figure 4. This phenomenon is not always observed but it is associated with the microstructure (porosity, grain size, second phases or initial damage). This phenomenon develops when short crack behaviour is developed (crack whose length is comparable to the grain size of the specimen). The transition into a long crack is inhibited by the dispersed pore phase. When this happens a break-away from the damage saturation behaviour is observed and failure will develop [24, 25]. In some refractory materials this saturation behaviour can be observed either for low levels of thermal shock or severe thermal shock [26].
Figure 4 – Thermal fatigue damage curve for a general property P, where P decreases with increasing thermal fatigue damage. P0 is the property before the cycles and Psat the property after N number of cycles when
saturation occurs [24].
Nicolas Rendtorf (2014) observed the degradation of the Young’s modulus in the first 3 to 6 cycles, followed by the saturation of damage which occurs when the energy provided by the thermal shock is not high enough to propagate the existing cracks. Before reaching saturation, despite an increase in damage is observed, the variation between two consecutive cycles is decreasing until saturation is reached [25, 27].
The advantages of the thermal shock test are that all the properties of the material relevant for the thermal shock resistance are considered. On the other hand, this test is similar to the service
conditions. The main differences are the dimensions and the thermal and mechanical boundary conditions, which difficult the interpretation of the test results, not allowing a direct translation of the number of cycles to failure. This translation may be possible by measuring the strain development throughout the cycles. Another question regards the saturation of damage, which can either happen permanently or as a secondary phase of degradation (which is reportedly seen in mechanical tests) [22].
2.3.3 Mechanical Cycle
Another methodologies to evaluate the resistance of refractories to thermo-mechanical cyclic loads is to study the behaviour of refractories to mechanical cyclic loadings [7]. A correlation between the mechanical cyclic fatigue and the thermal shock test has been pointed out for several refractory materials [7, 27-29].
The similarity of these approaches (fatigue induced by mechanical loading and fatigue induced by thermal loading), can be explained by the thermal expansion that occurs in thermal loading. The thermal expansion introduces strains which cause fatigue after several cycles, the same way as an entirely mechanical load would cause. However, there are several differences that should be considered, such as: the rate at which mechanical and thermal-stress are conducted (generally very different), the effect of the temperature variations on mechanical behaviour of the material and the combination of this effect with the strain variation (which may not occur on mechanical cycles, which are generally done at a fixed temperature) [28].
Because of all these factors, it can be challenging to predict life in thermal fatigue from life in mechanical fatigue. The life found for the thermal-stress fatigue tests tends to be considerably inferior to the life of the mechanical cyclic tests [28].
The advantage of using mechanical cycle tests is the decoupling of fatigue failure from other material properties such as conductivity. The consideration of temperature distribution and gradient are not relevant, rendering this method as attractive for analytical algorithms and computational models to predict failure [7]. It allows a direct correlation of loads and the material response in the stress-strain response curve, enabling the quantification of the degradation due to repetitive cycles [17].
The fatigue degradation can be evaluated from the stress-strain parameters, such as irreversible strains. In some cases, cyclic stress-strain measurements performed at discrete temperatures can be representative of the failure due to temperature fluctuations [22, 28, 29].
Several methods of cyclic fatigue tests can be used: either a force controlled, or displacement-controlled method. The method chosen should be the one that represents the service solicitations.
Force controlled methods are simpler to implement and allow a comparative analysis of the refractories. However, these are not representative of the service conditions which result mostly from strain loads [7].
Different displacement control methods have been used by K. Andreev et al. (2016) such as Method II (constant displacement) and Method III (constant displacement amplitude). The difference between these resides in the fact that in Method II the loading piston is allowed to decouple from the samples in contrast with Method III where the piston does not decouple from the sample and therefore the unloading stops when the zero force is reached. A scheme of the cyclic test with both methods is represented in Figure 5 [7, 30].
Figure 5 – Schematic representation of cyclic tests for both Method II and Method III [7].
Compressive test of Method II is the most representative of service conditions where thermal expansion is constrained. This can happen when material compaction occurs and the joints between the refractory bricks open up during unloading parts of the cycle [7].
Method III performed in bending is the most representative of service conditions where lining parts are unconstrained, which are considered to be the most dominant comportment in furnaces of silica refractories [7].
The methodologies chosen will have an impact on the damage development. In tests with fixed maximal strain (Method II) the development of irreversible strains results in the reduction of the effective loading amplitude which promotes the development of damage saturation. In tests with constant effective strain amplitude (Method III) the maximal strain grows with the damage development. Saturation is less probable and appears mainly when amplitude is small [22, 31], The temperature is an influential factor on the failure process in cyclic fatigue. K. Andreev et al. (2017) reported a more brittle failure in cyclic fatigue tests at high temperatures for silica bricks, where post peak softening was not developed. This can be explained by the thermal expansion which promotes less damage location available for crack initiation and propagation and therefore a less tortuous crack is expected [7].
Commonly, the fatigue cyclic tests are done either in compression or bending. Bending allows a simpler analysis of the tensile failure in comparison with the compression where the shear and tensile stress are more complicated. Failure in bending test occur by the formation of a single crack which allows a more accurate estimation of the fracture mechanism parameters. However, the size of the standard bending samples is smaller in comparison with the size of the fracture process zone measured in refractories.
The fatigue degradation is controlled by the formation of damage and its subcritical loads [7]. This degradation occurs due to the gradual growth and merging of cracks. These micro-cracks exist at pre-existing cavities in the matrix. In compression these micro-micro-cracks can also appear in a larger grain. Resistance to crack propagation is expected to increase for cracks with tortuous paths. These paths can form either by two pre-cracks located on different parallel planes that grow together or by large grains without pre-cracks that deviate the crack trajectory from a straight line (most important mechanism in bending). Displaced debris are formed during the process disabling the closure of the cracks upon unloading. Locations with large amount of debris are expected to allow the formation of the major crack. De-bounding and rotation of large-grains was also identified as a critical mechanism of failure for fatigue crack growth in
refectories. This mechanism can develop when cohesion of the large grains and the matrix is not high [7].
Three different periods of damage accumulation can be usually found in refractory materials. Firstly, the rates of strain accumulation decrease. In this phase the formation and growth of micro-crack occurs due to encountering barriers, and the rate of micro-crack growth reduces. Secondly the rates of strain accumulation are constant. In this phase, the barriers are overcome by the reduction of friction and bringing effects in the crack wave. Finally, in the third phase the irreversible strain increases. It is in this phase that a major crack is formed, which causes the sample fail. Having a well-developed third phase should mean considerable resistance to major crack forming and propagation. The three different phases are schematized in Figure 6 [22, 31].
Figure 6 – Schematic drawing showing the cumulative acoustic emission signals (A.E) and the load, function of time. Representation of three different periods of damage accumulation for refractory materials in cyclic loading
[31].
In cyclic tests a less brittle failure is observed, which can be resultant from a more distributed failure process (where more tortuous cracks occur) and from the more gradual nature of the cyclic test (energy is consumed by the crack propagation). When a larger crack is formed, the material is unloaded outside of the crack zone. If the load is not capable of overcoming the material resistance, the defects in a larger volume of material are loaded and grow. These defects increase the possibility of the crack to deviate from a straight line. Therefore, an increase in the number of cycles to failure is expected when a high concentration of critical defects is developed before the resistance to the crack propagation is overcome [7].
2.4 Wedge Splitting Test (WST)
The wedge splitting test is particularly interesting to study fracture since fully stable fractures are developed, which allows a reliable record of the total energy for crack propagation throughout the sample [5]. This test favours a stable crack propagation because of a relatively low ratio of specimen volume to fracture surface area and a reduction of the testing force by action of a wedge, thus decreasing the energy elastically stored in the testing machine [20]. The scheme of this test is represented in Figure 7. As it can be seen, cubically shaped samples are equipped with a groove. The groove hosts a load transmission equipment which transforms the c into a horizontal force (FH).
The specimen size was studied by Harmuth et al. (1995) and an ideal size which enables stable crack propagation for a high range of brittle materials was determined, as it is represented in Figure 8 [32].

![Figure 3 – Schematic of the crack process zone for refractory materials. CMOD – Crack mouth opening displacement [5]](https://thumb-eu.123doks.com/thumbv2/123dok_br/15489583.1041171/34.892.230.717.101.463/figure-schematic-process-refractory-materials-crack-opening-displacement.webp)
![Table 3 – List of three criteria categories: stress-based criteria, strain-based criteria and energy-based criteria [15]](https://thumb-eu.123doks.com/thumbv2/123dok_br/15489583.1041171/36.892.103.829.140.407/table-criteria-categories-stress-criteria-strain-criteria-criteria.webp)
![Figure 5 – Schematic representation of cyclic tests for both Method II and Method III [7]](https://thumb-eu.123doks.com/thumbv2/123dok_br/15489583.1041171/41.892.266.666.156.439/figure-schematic-representation-cyclic-tests-method-method-iii.webp)
![Figure 8 –Geometry of the specimen for WST to enable stable crack propagation (dimensions in mm) [32].](https://thumb-eu.123doks.com/thumbv2/123dok_br/15489583.1041171/43.892.238.691.579.838/figure-geometry-specimen-enable-stable-crack-propagation-dimensions.webp)

![Figure 11 – Output from DIC as a map of local deformation showing cracks not visible to the human eye [35]](https://thumb-eu.123doks.com/thumbv2/123dok_br/15489583.1041171/45.892.245.693.639.938/figure-output-local-deformation-showing-cracks-visible-human.webp)