This paper compares the results between a non-linear three-dimensional numerical analysis of pile caps with two piles and the experimental study conducted by Delalibera. It is veriied the load-carrying capacity, the crack pattern distribution, the principal stress in concrete and steel, the delec -tion and the fracture of the pile cap. The numerical analysis is executed with the inite-element software ATENA 3D, considering a perfect bond between concrete and steel. The numerical and experimental results are presented and have demonstrated a good approximation, reasserting the results of the experimental model and corroborating the theory.
Keywords: pile caps, inite elements, reinforced concrete, foundation.
Neste artigo é realizado um estudo comparativo entre o comportamento experimental de blocos de concreto armado apoiados sobre duas esta -cas, a partir de modelo experimental de Delalibera, e o obtido a partir de análise numérica tridimensional não-linear. A comprovação de resultados é feita observando-se a força última, o panorama de issuração, o luxo de tensões atuantes no concreto e no aço, as deformações e o padrão de ruína. A simulação numérica do comportamento estrutural do bloco de concreto armado é realizada com o emprego do programa computacional de elementos initos ATENA 3D, considerando a aderência perfeita entre as barras de aço da armadura e o concreto. Os resultados numéricos e experimentais são apresentados e quando comparados apresentam uma boa aproximação, comprovando os fundamentos teóricos e os resul-tados experimentais.
Palavras-chave: blocos sobre estacas, elementos initos, concreto armado, fundacões.
Three-dimensional analysis of two-pile caps
Análise numérica tridimensional de blocos sobre
duas estacas
T.E.T. BUTTIGNOL a
L.C ALMEIDA b
a Mestre em Estrururas pela Faculdade de Engenharia Civil, Arquitetura e Urbanismo da Universidade Estadual de Campinas, [email protected], Rua Capitão José de Sousa, 118 – Centro – Campinas-SP - Brasil
b Professor Doutor do Departamento de Estruturas da Faculdade de Engenharia Civil, Arquitetura e Urbanismo da Universidade Estadual de Campinas, [email protected], Campus Zeferino Vaz - Av. Albert Einstein, 951 - Campinas-SP - Brasil
Received: 21 Nov 2011 • Accepted: 27 Feb 2012 • Available Online: 02 Apr 2012
Abstract
1. Introduction
The primary function of pile caps is to transfer superstructure forces to the infrastructure elements. In the last decades there was a signiicant progress in the study of the structural behavior of pile caps. With the introduction of computing systems and the Finite Element Method (FEM) new reined techniques of analysis were developed.
The current theory of pile caps is due to the original work
devel-oped by Blévot & Frémy [3], whose authors published a study which came to be a reference for all posterior works and served as the framework for the formulation of most of the national codes in this ield up to date.
Based on experimental results, Blévot & Frémy [3] formulated a theory on struts and ties to explain the structural behavior of pile caps. The authors observed that the collapse of the majority of pile caps specimens have occurred by concrete splitting (open -ing cracks parallel to principal compressive stresses as a result of
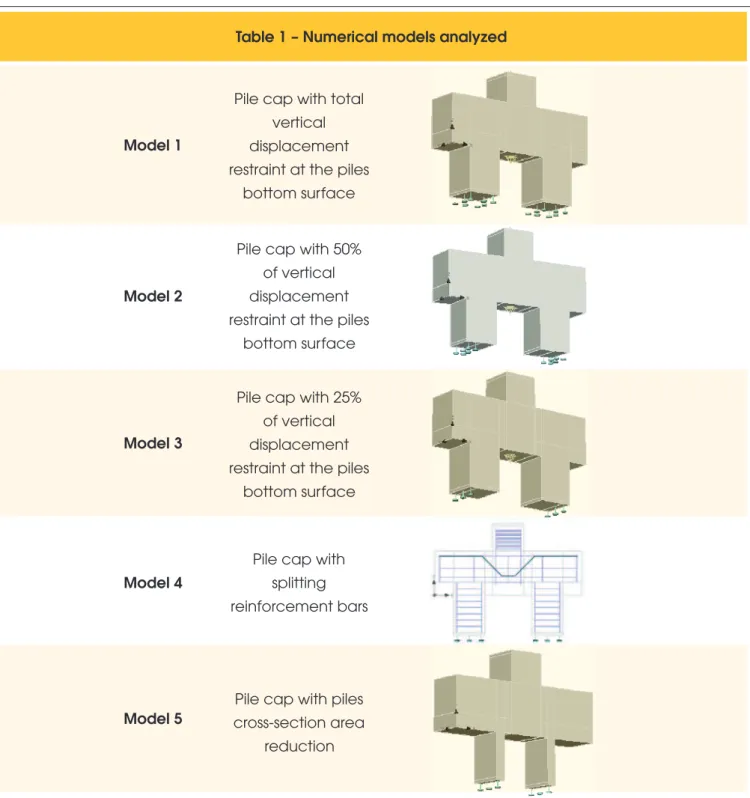
Table 1 – Numerical models analyzed
Model 1
Pile cap with total
vertical
displacement
restraint at the piles
bottom surface
Model 2
Pile cap with 50%
of vertical
displacement
restraint at the piles
bottom surface
Model 3
Pile cap with 25%
of vertical
displacement
restraint at the piles
bottom surface
Model 4
Pile cap with
splitting
reinforcement bars
not submitted to lexure. The principal design guidelines are pro-vided by an array of codes such as the Canadian National Code (CSA Standard A23.3-94), the Australian National Code (AS3600-1994), the New Zealand National Code (NZS3101: Part2: 1995) and the FIB Model Code 1990. Despite that, each code has its own materials and loading safety factors and different design method -ologies. In particular the NBR-6118: 2007 [11] only mentions the preference for tridimensional strut and tie models in spite of linear and non-tridimensional models.
1.1 Justiication
Researches have been evolving to a consensus that the struts and tie model is assumed to be the most accurate method to represent the structural behavior of pile caps. Notwithstanding, there still remains a dissent in the literature, for example, in the subject of the coniguration of compressive struts and distribution of stresses inside the specimen. Delalibera [1] afirms that “there is a lack of knowledge on the geometrical shape of compressive stresses that forms the struts in pile caps submitted to axial and eccentric loads” and “numerical analysis of rigid pile caps have demonstrated that the distribution of stress in the struts on the surface of piles is not uniform, demanding an adaptation to the chosen hypothesis”.
Therefore, this paper has the main objective to verify the behav-ior of reinforced concrete pile caps with two piles by comparing, on one side, Delalibera’s [1] experimental results and, on the other side, non-linear numerical analysis results. Experimental and numerical results comparison has the merit to expose dis-crepancies and convergences between them, and, hence, vali -dates the inite elements method software analysis. Moreover, numerical analysis contributes to the corroboration of the pile caps theoretical fundaments.
The crack pattern is analyzed in this paper, including initial crack formation in Stadium II and its propagation within the structure, besides stress and strain distribution in pile caps and steel bars. In addition, the load carrying capacity and pile caps collapse by con-crete splitting and compressive struts crushing in the nodal zones is veriied.
2. Analysis Method
A numerical analysis of ive pile caps with two piles is developed, as described on Table 1. For that, the inite element software AT -ENA 3D [2], from Cervenka Consulting, was used. The pile caps perpendicular tension stresses within the structure) with the
forma-tion of several cracks before the collapse. In relaforma-tion to anchorage, Blévot & Frémy [3] proved that the reinforcing bar slipping of ridged steel bars without hooks only occurs after the strut crushes. Mautoni [4] noted that most pile caps were subjected to a fragile collapse by struts splitting in nodal zones. Before the structural collapse the cracks ran parallel to the struts. This fact was also noted in experimental tests conducted by Clarke [5] and Sabnis & Gogate [6].
Studying the strut and tie model, Adebar et. al. [7] proved that the collapse of pile caps is due to the concrete splitting with the expan-sion of compressive stresses (concrete crushing and increase of cracks) and the subsequent yielding of ties rebars.
Delalibera & Giongo [8] demonstrated the formation of cracks par -allel to the struts in pile cap models. The authors verify that pile caps collapse by concrete splitting and crushing in the superior nodal zone (C-C-C), on the interface between the column and the pile cap, and in inferior nodal zones (C-C-T), on the interface be -tween the piles and the pile cap. Moreover, the authors support that in the design of pile caps the column’s forces are equally di -vided in two halves at the cross-section between the column and the pile cap. Reinforcing bars adherence analysis conducted by Delalibera [1] demonstrated that there is no tie steel bar slipping due to struts compressive stresses favorable contribution. This re-duces tensile stress values and signiicantly diminishes reinforcing bar strains in inferior nodal zones.
According to Souza et. al. [9] it is important to mention that there is not yet a general procedure accepted to pile caps design. Despite the existence of several design procedures, there is still a large difference among them. Most of national codes recommend deep beams, bending beams or truss models for the design pile caps. Notwithstanding, Souza et. al. [9] demonstrated that many pile caps designed to lexural collapse presented a fragile rupture by shear. The authors also attested that pile caps are submitted to a complex tridimensional non-linear strain distribution nominated as D-region. In general, D-regions are developed due to static order (caused by load actions) and geometric disturbances (caused by abrupt geometric changes). Particularly in the case of pile caps, all the structure behaves as a D-region due to the concentration of stresses both in the superior and inferior sections caused by the intersection between the column and the pile cap, and between the pile and the pile cap.
It is worth mentioning that in the last decades, according to Su & Chandler [10], struts and tie models have been one of the most popular and rational methods of structural analysis of structures
Table 2 – Concrete properties
Pile caps
Piles and columns
Poisson’s ratio (
n
)
0,2
0,2
Specific Fracture Energy (G )
F
2
79 J/m
116 J/m
2Tension Stiffening Factor (c )
ts
0,40
0,40
Modulus of Elasticity (E )
c
30.320 MPa
41.060 MPa
Characteristic Compressive Strength (f
ck)
40 MPa
73 MPa
Tension stiffening effect is the ultimate concrete tensile stress value that contributes to prevent crack propagation, increasing the stiffness of the structures. It is deined by the tension-stiffening factor (cts). In elastic state, concrete obeys Hookes’s Law. In post-cracking state, structure’s rupture plane is determined by Drucker-Prag-er’s plasticity model in compression and by Rankine’s theory in tension. Speciic Fracture Energy, determined through equation 1, is a concrete essential parameter that allows numerical simula -tion of concrete structures and corresponds to the strain energy deformation tax release that is stored in the system and is re-leased according to crack opening and propagation. It describes concrete behavior in post-cracking state and corresponds to the internal graphic area of stress versus crack opening curve that is shown in Table 3.
(1)
ef tf
'
000025
,
0
G
F=
×
[MN/m]
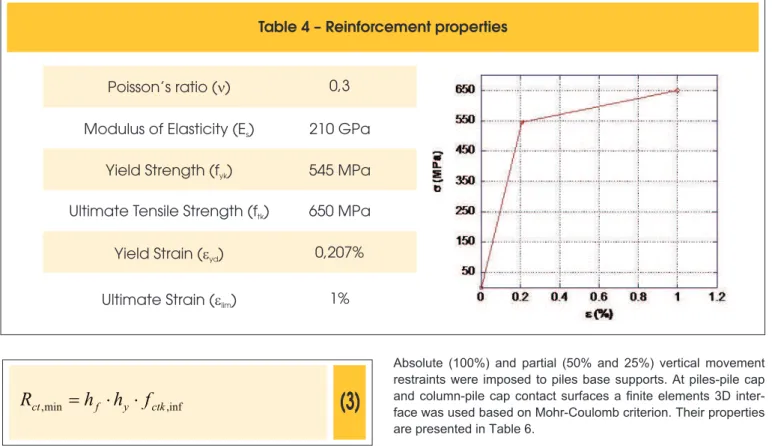
For steel bars, an elastic-perfectly plastic behavior is adopted. Steel bar materials properties are listed in Table 4. The yielding criterion is based in von Mises deinitions.
Finally for steel plates pile supports an isotropic elastic material was deined as shown in Table 5.
2.3 Geometric model and steel bars disposal
Figure 1 shows the geometric characteristics of the pile caps. The distribution of pile caps is presented in Figures 1, 2, 3 and 4. For the pile cap with splitting reinforcing bars (model 4) two 16mm steel bars were used passing perpendicularly through the struts, following Delalibera’s [1] recommendations. The reinforcing bars were designed according to requirements proposed by [1], due to equations 2, 3 and 4.
(2)
ydct
sf
f
R
A
,minmin
,
=
studied are originated from Delalibera’s [1] experimental model nº B35P25E25e0. The numerical models maintained the shape of the structural elements, the distribution of the reinforcing bars and the materials properties.
In the model 1, all vertical displacements at the base of the piles were restrained (Table 1, model 1). In the models 2 and 3 verti -cal displacements are restrained respectively on 50% and 25% of the base of the piles, as shown in Table 1. The reduction of piles supports (vertical displacements restrain) has the main purpose to study its inluence on pile caps stiffness.
Model 4 characteristics are equal to model 1 except for splitting steel bar addition as shown in Table 1. The objective of this reinforcement is to observe its contribution to pile caps load bearing capacity. Another aspect analyzed is the concentration of the struts compres-sive stress in the cross-section on the surfaces of the piles. High compressive stress concentration was observed on cross-section region of the pile closer to the column. Compressive stresses were more intensive in the beginning of inferior nodal zone, being very low in the end of the inferior nodal zone. To detect this phenom-enon and observe the behavior of specimens (compressive stress low) a pile cap with the pile’s cross-section width reduced was modeled (Table 1, model 5).
2.1 Computational software
Numerical analysis was carried out with computational software ATENA 3D [2]. The software’s basic concept operation is based on inite element theory and non-linear analysis of reinforced con-crete structures.
The software simulates the behavior of real structures using either linear or non-linear analysis. Maximum load is obtained by incre-ments of time force integration, applying Arc-Length and Newton-Rhapson methods. To determine concrete strain structural behav -ior it is used the Lagrangian or Euler’s formulations.
2.2 Materials properties
A plastic fracture model is adopted for concrete as described by Cervenka [2] and shown in Table 3. Concrete principal character-istics are presented in Table 2.
Table 3 – Concrete constitutive laws (Cervenka [2])
(3)
,infmin
, f y ctk
ct
h
h
f
R
=
×
×
(4)
2 2)
4
2
(
L
a
d
h
est xf
=
+
+
Where:
Rct, min : minimum tensile force;
hf : vertical dimension – strut and tie model (Delalibera [1]); hy : column cross-section;
fctk, inf : inferior value of concrete characteristic tensile resistance; Lest : piles span;
Ax : pile dimension in the considered direction.
2.4 Analysis method
The Newton-Rhapson analysis method was adopted with a con -centrated load at the center of the column’s superior cross-section and force increments of 25 kN. Added to this, an hexahedral inite elements mesh was adopted to pile caps, piles and columns as shown in Figure 5. And a tetrahedral inite elements mesh was adopted for the steel plates.
Absolute (100%) and partial (50% and 25%) vertical movement restraints were imposed to piles base supports. At piles-pile cap and column-pile cap contact surfaces a inite elements 3D inter-face was used based on Mohr-Coulomb criterion. Their properties are presented in Table 6.
3. Considerations on numerical
and experimental models
3.1 Divergences between numerical
and experimental models
One of the most discrepant structural behaviors observed between numerical and experimental models was in the stiffness pile caps, which was much higher in numerical models. This fact demon-strates the inherent complexity of laboratory experiments. Delalibera [1] points out three main reasons for this stiffness differ-ence, which are prototype accommodation at the beginning of the experiment, perfect bond assumption between steel bars and con-crete in numerical models and perfect connection between piles and pile cap.
In reference to the irst reason, [1] cites pile cap accommodation at the beginning of the experiment, which was veriied in load versus displacement curve. About the second reason, the author did not conirm this hypothesis after the preliminary tests. And in respect to the third reason, [1] afirms that this is probably what has mainly collaborated to the augment in pile cap’s stiffness, since a detach-ment between piles-pile cap interface occurred. Therefore, [1] sug -gests the use of interface inite elements on the contact surfaces of the structural elements.
Following the recommendation of [1], all numerical pile caps were modeled using a inite elements interface between column-pile cap contact and piles-pile cap contacts. Moreover, the supporting area of the piles was reduced in order to observe pile caps stiffness behavior.
The reduction of the supporting area of the piles enabled an in -crease in pile caps strains and displacements. This fact is in
accor-Table 4 – Reinforcement properties
Poisson’s ratio (n)
0,3
Modulus of Elasticity (E )
s
210 GPa
Yield Strength (f )
yk
545 MPa
Ultimate Tensile Strength (f )
tk
650 MPa
Yield Strain (e
yd
)
0,207%
Ultimate Strain (e
lim
)
1%
Table 5 – Steel plates properties
dance with Ramos [12] observations who demonstrated, through computational analysis, that “pile caps structural behavior is highly inluenced by piles type of support and by pile cap stiffness”.
3.2 A resume of Delalibera [1] experimental results
Delalibera’s [1] results demonstrated that pile caps resist until the beginning of concrete crushing, when a fracture plane along the struts is started due to shear forces action. Ruin occurred by con-crete crushing in nodal zones and by pile caps splitting along the compressive struts. In most cases, concrete collapse occurred be-fore reinforcement yielding.
The strains on the ties were not constant over the reinforcing bars. A signiicant stress reduction has taken place in the inferior nodal
zones. And the strains at the ends of the steel bars of the ties were close to zero, despite the existence of anchorage hooks.
In the model with splitting reinforcing bars (steel bars disposed perpendicularly in relation of struts and with the purpose to absorb tensile stresses and to resist to concrete splitting) proposed by [1], an increase in pile caps resistance was observed. This model pre-sented intensive strains in struts cross-section.
All experimental models presented a similar structural behavior, with initial cracking beginning in the inferior nodal zone, at the pile-pile cap interface, and propagating up to the superior nodal zone, at the column-pile cap interface. Cracks were propagated over the struts forming a clear rupture plane.
From principal compressive stress, [1] detected a greater concen-tration of stresses at the column-pile cap contact surface and in the piles region located at the beginning of inferior nodal zone.
4. Results and discussion
of the numerical models
4.1 Crack pattern
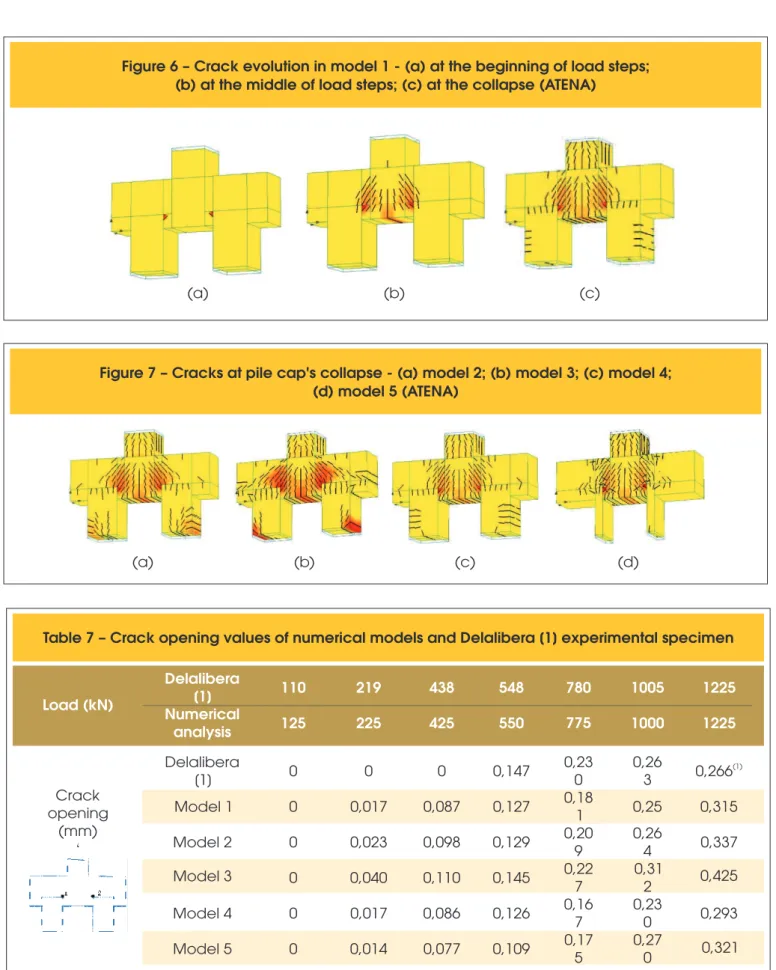
In all numerical models, irst cracks appeared in the inferior nodal zone at the piles-pile cap contact surface, and propagated along the compressive struts up to the superior nodal zone. During load increments a wide range of cracks parallel to the struts developed, as shown in Figures 6 and 7.
In models 2 and 3, with piles supports reduction, an augment of cracking intensity occurred during the loading. The formation of cracks was observed cracks in the base of the piles and in its adja-cencies due to geometric eccentricity. This eccentricity generated a rotation in the axis of the piles and consequently a region with stress concentration as it can be noted in Figures 7 (a) and 7 (b). In model 4, splitting reinforcing bars effectively contributed to pile cap’s cracking control. A reduction in crack opening intensity also occurred.
Figure 1 – Details of pile caps geometry and reinforcement bars (stirrups and ties)
In model 5, with reduction of pile’s cross-section area, the results were very similar to those observed in model 1.
In general, a good approximation between experimental and nu-merical results was observed, as it can be veriied in the results presented in Table 7.
4.2 Stress-low
In all numerical models prismatic compressive struts were formed. At the bottom surface of the column stress low was di -vided equally in two halves, proving [1] statement that it is cor-rect to consider that half pile cap-column interface receives half of the column’s forces. Besides, all compressive stresses have
Figure 3 – Details of piles reinforcement bars– (a) models 1, 2, 3 e 4; (b) model 5
(a)
(b)
Figure 4 – Details of column's
reinforcement bars
piles support restraints and load. (ATENA)
Figure 5 – Details of finite element mesh,
Table 6 – Contact elements properties
Normal Stiffness (K )
nn
5 3
2,0 . 10 kN/m
Tangential Stiffness (K )
tt
5 3
2,0 . 10 kN/m
Cohesion
0,0
Friction Coefficient
0,0
Ultimate Concrete
Tensile Strength (f )
tkFigure 6 – Crack evolution in model 1 - (a) at the beginning of load steps;
(b) at the middle of load steps; (c) at the collapse (ATENA)
(a)
(b)
(c)
Figure 7 – Cracks at pile cap's collapse - (a) model 2; (b) model 3; (c) model 4;
(d) model 5 (ATENA)
(a)
(b)
(c)
(d)
Table 7 – Crack opening values of numerical models and Delalibera [1] experimental specimen
Load (kN)
Delalibera
[1]
110
219
438
548
780
1005
1225
Numerical
analysis
125
225
425
550
775
1000
1225
Crack
opening
(mm)
‘
Delalibera
[1]
0
0
0
0,147
0,23
0
0,26
3
0,266
(1)Model 1
0
0,017
0,087
0,127
0,18
1
0,25
0,315
Model 2
0
0,023
0,098
0,129
0,20
9
0,26
4
0,337
Model 3
0
0,040
0,110
0,145
0,22
7
0,31
2
0,425
Model 4
0
0,017
0,086
0,126
0,16
7
0,23
0
0,293
Model 5
0
0,014
0,077
0,109
0,17
5
0,27
0
0,321
(1)
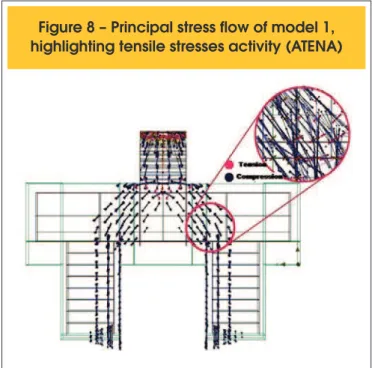
propagated up to piles surfaces, forming compressive struts and concentrating at the piles cross-section closest to the column, as shown in Figures 8 and 9.
Maximum compressive stresses, presented in Table 8, occurred in the intersection between column-pile cap and piles-pile cap. This indicates the collapse of pile caps in the nodal zones region, simi -larly to [1] specimen rupture.
In models 2 and 3, the eccentricity provoked by piles supports area reduction, which resulted in an augment in structure’s displacement, caused struts stress expansion towards the inferior nodal zone. This resulted in a redistribution of pile cap stresses at the piles surface. In model 3, struts stress low became to concentrate in the pile’s surface that is closer to the pile caps border, as shown in Figure 9 (b) In model 5, presented in Figure 9 (d), struts compressive stresses were distributed in all piles cross-section area. Notwithstanding, maximum stresses were similar in value to model 1, as shown in Table 8, proving that in model 1 piles cross-section surfaces were only partially solicited by struts compressive stresses.
Tensile stresses perpendicular to compressive struts were also formed, characterizing concrete splitting, which is indicated by ten -sile vectors perpendicular to compressive vectors shown in details in Figure 8. Splitting steel bars of model 4 absorbed partially these tensile stresses, contributing to pile caps resistance increase, as predicted by Delalibera [1]. A signiicant reduction in tensile stress was also observed on the pile cap’s inferior surface (between piles) as shown in Figure 12 (a). These results conirm splitting steel bars favorable action to pile caps tensile and shear resistance increase. In the other models, tensile stress in the pile cap inferior surface was similar, as shown in Figures 10, 11 and 12 (a and b).
4.3 Ultimate load and ruin
In all models a fragile collapse occurred with compressive struts formation and concrete splitting and crushing. Also intensive cracks were observed.
Ultimate load in model 1 was 1900 kN. Comparing to the experi-mental model the results were very similar, as demonstrated in Table 9.
In model 3, with supports in only 25% of the pile’s basis, the princi-pal reinforcing bars of the ties yielded. There was also a reduction in pile cap load carrying capacity. In the other models, yielding oc -curred only after the model’s ruin.
In model 4, with splitting reinforcing bars, an increase in pile cap ulti-mate load capacity was observed, as shown in Table 9. In addition, no signiicant variation was observed in pile cap’s ruin, stiffness and bearing capacity patterns. The numerical results are similar to those obtained by [1] in experimental tests with pile caps with splitting rein-forcement where an augment in pile cap’s ultimate load was obtained. In model 5, despite piles cross-section area reduction, no signii -cant difference was observed in pile cap bearing capacity. Ulti-mate load capacity of the numerical model was 1825 kN, which is close to the experimental model. The results restate that piles of numerical model 1 are only partially solicited, occurring compres-sive stress concentration in the pile’s cross-section area that are closer to the column (in the beginning of the inferior nodal zone).
4.4 Reinforcement strains and stresses
Steel bars, except in model 3, did not yield until the pile caps ruin. Moreover, the ties steel bar stresses were not uniform,
Figure 8 – Principal stress flow of model 1,
highlighting tensile stresses activity (ATENA)
Figure 9 – Principal stress flow - (a) model 2; (b) model 3; (c) model 4; (d) model 5 (ATENA)
occurring significant reduction in the inferior nodal zones due to struts compressive effect, as shown in Figure 13. The re -duction of the supporting area of the piles caused an increase on pile cap’s inferior surface strains due to the rotation of the piles axis. Consequently, the ties steel bar tensile stresses augmented.
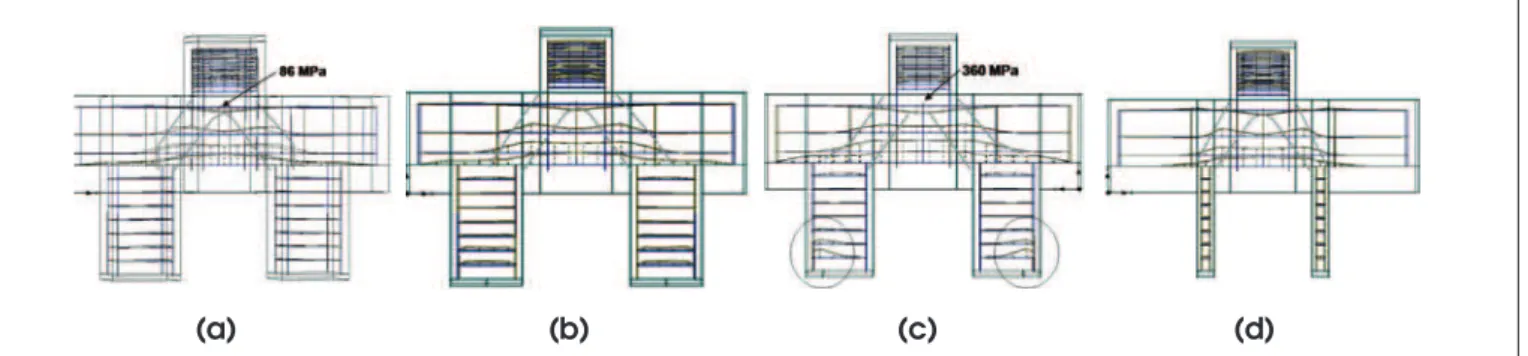
Horizontal stirrups have absorbed part of the tensile stresses in the struts region. In model 3 stresses in the superior longitudinal steel bars achieved 360 MPa, as shown in Figure 13 (c). Besides, in model 3, due to stress concentration near the piles supports, an increase in piles stirrups stresses located near the supports was observed, as shown in Figure 13 (c).
Splitting reinforcement of the model 4 absorbed part of pile cap’s stresses, proving to be effective against pile caps tensile stress, as shown in Figure 14.
In Table 10 maximum strain and stress values of both numerical analysis and experimental models are presented. The results dem-onstrated a good approximation between them. In Figures 15 to 19 the pile caps inferior nodal zones are shown in details, demonstrat-ing the ties anchorage region (lanc) and the ties stress graphic values. In all models (Figures 15 to 19) strains at the ties steel bar ends were very low. Notwithstanding, as the piles supporting area was being reduced, there was a progressive increase in the area of the nodal zones. An increase of the stresses in the ties steel bar at the end of the inferior nodal zone also occurred with repercus-sion in the steel bar ends as can be seen in Figures 15, 16 and 17. Despite that, the stress in the ends of the ties steel bar remained low. This conirms Clarke’s [5] statement that ties anchorage is positively inluenced by struts coninement action, which excludes the use of tie hooks.
In model 4, with splitting reinforcing bars, intensive stresses in the ties steel bars at the beginning of the inferior nodal zone were ob -served. However, a considerable reduction in steel bar stresses occurred along the nodal zone. Very low stress values rose at the steel bar ends, as shown in Figure 18.
In model 5, despite the reduction of the piles cross-section area, zero strain value occurred at the end of the ties steel bars, as shown in Figure 19.
4.5 Stiffness and bearing capacity
In relation to the experimental specimen, model 1 was more rigid, presenting lower displacements. This was a result of the vertical restraints imposed to the piles in the numerical models, which has produced a clamping effect, limitating the rotation of the piles and the displacements of the pile caps.
The reduction of the pile’s supporting area caused a decrease in the pile caps structural stiffness, leading to a growing convergence of the force versus displacement curve among the models 1, 2 and 3. In model 3, as shown in Figure 20, the force versus displace-ment curve overlapped with the experidisplace-mental model’s curve which is already adjusted to expunge displacements due to specimen accommodation in the irst load stages.
This proves that in numerical models the supports of the piles di-rectly affect the stiffness of structural elements. At the same time, load bearing capacity was not signiicantly changed. Both numeri-cal and experimental models achieved ultimate load capacity with very similar load intensity and crack pattern.
In addition, as the supporting area of the piles was reduced, there was a shift in the maximum plastic strain location. In Figure 21 it is possible to notice plastic strain shift from the inferior nodal zones to the superior nodal zones. If this reduction in the pile caps support-ing area, on one side, allowed increased structural displacements, on the other side, it generated a high compressive zone in the pile cap’s superior nodal zone. In general, there was a reduction up to 30% in stresses in the piles-pile cap contact surfaces with an increase up to 28% in the stresses in the column-pile cap’s contact surface, as shown in Table 8.
In model 4, splitting reinforcement contributed to load bearing ca -pacity and to the increase in the pile cap resistance.
Table 8 – Maximum stress values (MPa) on ultimate load of numerical models and Delalibera [1]
experimental specimen
Pile caps specifications
Delalibera
[1]
Model
1
Model
2
Model
3
Model
4
Model
5
Maximum
compressive
stress (MPa)
Sruts
-
35
35
32
35
35
Inferior
nodal zone
-
30
27
28
35
34
Superior
nodal zone
-
36
37
34
35
34
Column-pile
cap
interface
58,3
52
50
67
54
48
Piles-pile
cap
interface
58,3
52
50
37
54
62
In model 5, with the reduction in the cross-section area of the piles, stiffness and load bearing capacity were similar to model 1.
5. Conclusions
The results of the numerical models showed that the reduction in the piles supporting area has a direct inluence in the pile caps load bearing capacity and a non-negligible inluence in pile caps stiffness.
In model 1, vertical displacement restraints in all pile’s basis gen -erated a clamping effect that lead to structural stiffening. Despite piles conining effect due to soil reaction along the piles, this fact is not observed in pile caps. Pile caps are not tensile structures. Therefore small displacements of the piles could cause great inlu -ence in pile caps stiffness. Therefore, this could become a critical question and deserves considerable attention in laboratory tests and numerical analysis.
Figure 10 – Details of model 1 tensile stresses [MPA] at the bottom of pile cap (ATENA)
Figure 11 – Tensile stresses [MPa] at the bottom of pile cap: (a) model 2; (b) model 3 (ATENA)
Comparison between numerical and experimental models demonstrat -ed a good approximation. A fragile collapse by concrete crushing and pile cap concrete splitting occurred in all numerical models analyzed. Prismatic struts were developed in all models. Added to this, ten-sile stresses, which are responsible for concrete splitting, were ob -served across the struts.
Stress low within the pile caps was divided equally in two halves on the inferior column cross-section and was propagated up to the piles superior surfaces, where stress concentration occurred on the pile’s cross-section area, close to the column.
Figure 12 – Tensile stresses [MPa] at the bottom of pile cap: (a) model 4; (b) model 5 (ATENA)
(a)
(b)
Table 9 – Ultimate load of numerical models
and Delalibera [1] experimental specimen
Model
Load (kN)
Delalibera [1]
1820
Model 1
1900
Model 2
1980
Model 3
1775
Model 4
2075
Model 5
1825
Figure 13 – Reinforcement bars stresses - (a) model 1; (b) model 2; (c) model 3; (d) model 5 (ATENA)
(a)
(b)
(c)
(d)
First cracks appeared in the inferior nodal zones and propagated in direction to the superior nodal zone. Intensive cracks were devel-oped with a rupture plane formation along the struts.
Principal tie stresses were not constant along the reinforcing bars. An abrupt reduction in ties stresses was observed in the inferior nodal zones due to favorable compressive struts action.
At the border of the ties steel bars stresses were very low or null, which proves the non-necessity of hooks anchorage.
Splitting reinforcing bars contributed to pile cap’s ultimate load ca-pacity increase and to crack control and reduction.
Steel bars adherence was not a relevant factor and did not inlu-ence in the pile cap’s resistance. In all models ties steel bars did not slip until pile cap’s ruin.
6. Acknowledgements
To FEC-UNICAMP for the provision of the necessary tools to de-velop this work. And to CAPES for its support to the irst author’s participation in the 52º Brazilian Concrete Congress which resulted in an article publication and presentation which originated this paper.
7. References
Figure 14 – Splitting reinforcement stresses
in model 4 (ATENA)
Table 10 – Stress and strain values on ultimate load of numerical models and Delalibera [1]
experimental specimen
Pile caps specifications
Delalibera [1]
Model 1
Model 2
Model 3
Model 4
Model 5
Maximum strain in ties
steel bars
0,196%
0,195%
0,239%
0,390%
0,198
0,190
Maximum stress in ties
steel bars
392 MPa
414 MPa
501 MPa
547 MPa
415 MPa
399 MPa
Figure 15 – Anchorage length and ties stresses [MPa] in the inferior nodal zone of model 1
analysis of pile caps with two piles submitted to axial and eccentric forces. Thesis (Doctorate). School of Engineering of São Carlos, São Paulo University, São Carlos, 2006 (in Portuguese).
[02] CERVENKA, V.; JENDELE, L. e CERVENKA, J. ATENA Program Documentation—Part 1: Theory. Praha, Czech Republic, 2005.
[03] BLÉVOT, J. L.; FRÉMY, R. Semelles sur Pieux. Institut Technique du Bâtiment et des Travaux Publics, V. 20, No. 230, pp. 223-295, 1967.
[04] MAUTONI, M. Pile caps with two piles. São Paulo, Grêmio Politécnico, 1972 (in Portuguese).
[05] CLARKE, J. L. Behavior and design of pile caps with four piles. Cement and Concrete Association, London, Technical Report n.42.489, 1973.
[06] SABNIS, G. M.; GOGATE, A. B. Investigation of thick slab (pile cap) behavior. ACI Structural Journal, V. 81-5, No. 2, pp. 35-39, Jan-Feb 1984.
[07] ADEBAR, et al. Strut-and-tie models for design of pile caps: an experimental study. ACI Journal, v. 87, pp. 81-91, Jan-Febr, 1990.
Figure 17 – Anchorage length and ties stresses [MPa] in the inferior nodal zone of model 3
Figure 20 – Load vs. displacement curve
Figure 21 – Principal plastic strains - (a) model 1; (b) model 2; (c) model 3
applied to pile caps with two piles with embedded chalice for concrete precast column submitted to axial and eccentric loads. 50º Brazilian Concrete Congress, IBRACON, São Paulo, 2008
(in Portuguese).
[09] SOUZA, R. et al. Adaptable Strut-and-Tie Model for Design and Veriication of Four-Pile Caps. ACI Structural Journal, V. 106, No. 2, pp. 142-150, March-April 2009.
[10] SU R. K. L.; CHANDLER A. M. Design criteria for Uniied Strut and Tie Models. Progress in Structural Engineering and Materials, V.3, No. 3, pp 288-298, October 2001.
[11] BRAZILIAN ASSOCIATION STANDARDS. NBR 6118:2007 – Design of concrete structures. Rio de Janeiro (in Portuguese).
![Table 3 – Concrete constitutive laws (Cervenka [2])](https://thumb-eu.123doks.com/thumbv2/123dok_br/18860058.417771/4.892.66.834.761.1155/table-concrete-constitutive-laws-cervenka.webp)


![Table 8 – Maximum stress values (MPa) on ultimate load of numerical models and Delalibera [1]](https://thumb-eu.123doks.com/thumbv2/123dok_br/18860058.417771/10.892.64.829.246.540/table-maximum-stress-values-ultimate-numerical-models-delalibera.webp)
![Figure 10 – Details of model 1 tensile stresses [MPA] at the bottom of pile cap (ATENA)](https://thumb-eu.123doks.com/thumbv2/123dok_br/18860058.417771/11.892.70.829.330.1110/figure-details-model-tensile-stresses-mpa-bottom-atena.webp)