Pedro Miguel Quintas da Conceição
Mestrado Integrado em Engenharia de Micro e Nanotecnologias
Low cost rapid prototyping of a microfluidic bioreactor for
electrochemical sensing of 3D cancer cell cultures.
Dissertação para obtenção do Grau de Mestre em Engenharia de Micro e Nanotecnologias
Orientador: Doutora Lorena Dieguez
International Iberian Nanotechnology Laboratory
Co-orientador:
Professor Doutor Hugo Manuel Brito Águas Departamento de Ciências dos Materiais
Faculdade de Ciências e Tecnologia Universidade Nova Lisboa
Júri:
Presidente: Prof. Doutor(a) João Paulo Miranda Ribeiro Borges Arguente(s): Prof. Doutor(a) Abel González Oliva
Vogal(ais): Prof. Doutor(a) Lorena Diéguez
© Pedro Miguel Quintas da Conceição Faculdade de Ciências e Tecnologia Universidade Nova de Lisboa
A Faculdade de Ciências e Tecnologia e a Universidade Nova de Lisboa têm o direito, perpétuo e sem limites geográficos, de arquivar e publicar esta dissertação através de exemplares impressos reproduzidos em papel ou de forma digital, ou por qualquer outro meio conhecido ou que venha a ser inventado, e de a divulgar através de repositórios científicos e de admitir a sua cópia e distribuição com objetivos educacionais ou de investigação, não comerciais, desde que seja dado crédito ao autor e editor.
I
Acknowledgements
Going to University was always my main goal from the start. After this long travel I need to admit that I was totally right. This was the best days. I had learned so much and grow a lot as well. I meet some special friends that will be around me for the rest of my life. This is the collapse of my passion of technologies and science. This stage of my life is finishing, and I am starting a new one that I hope it will be rewarding from my degree.
Looking at this last year, I think I learned how to work, not only to handle myself in the field of research but as well to work on group. I need to thank all the group specially to Krishna Kant, Cláudia Lopes, Alexandra Teixeira, Paulina Piairo and Sara Abalde. These people helped a lot in the laboratory and outside of it and were never unavailable. Besides the help what they teach me will be with me for a lifetime.
I want to write so I never forget how hard was this last year with my thesis and a surgery and such hard recovery after that. I want to thank all the people who helped me recover and still are helping me on that. I never had so hard times in terms of time and streamlining physiotherapy with the time on the lab.
I cannot forget all the friends I have made and kept along those 5 years. But I need to mention 2 in particularly. First Filipe Marques, one of the best persons I have met, we can be always arguing but we kept a truly friendship that I will never forget, and I will keep on my mind. Lastly, Kevin Oliveira, I will never have words to describe the respect I have and how I am thankful to be there all the time in his on way. I hope he never forget how he supported my degree and when I had hard times he was one of the first to reach me out. I wish these two people the best and hopefully i will be there to see them achieving their own goals.
To someone who is more than a friend but is like a brother, André Azevedo. When I was a little kid, he was the only one who believed me in every moment. I know we followed different paths but he knows our friendship will be connected somehow.
I want to thank my girlfriend for the support in this end of Master Thesis and to give me the best words when I need it most as well as a smile. Such a genuine person like kindest, most caring person in the world. She has my eternal gratitude for giving me a smile even when things weren’t goings as I expected.
Next to my family. Father, sister, grandmother and grandfather for all the support and giving me your heart and soul when raising me. Without you this will never be possible. And who I am today is due to my mother my eternal example who I want to be even know that is impossible. I want to thank all the efforts they had to do for me.
II Lastly, I want to say a word of thanks to Dra. Lorena Diéguez for your invaluable guidance during my work and enduring all those endless reunions, as well for guidance on the writing of the thesis and Professor Hugo Águas, to the International Iberian Nanotechnology Laboratory (INL) and to my university (NOVA University of Lisbon), for providing all the resources I needed during these year.
IV
Abstract
Cancer is one of the major health issues worldwide and further understanding of the disease is needed. To achieve this goal, new tools need to be developed that enable early diagnosis and disease prevention. To study the different stage of cancer formation, progression and invasion, different in vitro models have been developed over the years. Mostly in vitro models use 2D cultures that do not mimic the real tissue. To overcome these limitations, novel 3D tumour models need to be developed.
Microfluidic devices present interesting features such as low cost, low sample and low reagent consumption, high throughput, and miniaturization, and can easily be coupled with biosensors for different applications.
In this master thesis a microfluidic bioreactor was developed to enable real time monitoring of cells in a 3D tissue engineered scaffold. The micro-reactor was fabricated in Poly-methyl methacrylate (PMMA) material, due to its high strength, excellent optical properties and low cost. An electrochemical biosensor was integrated in the bioreactor to monitor the pH in the cell model, as a representation of different cancer stages. Simultaneously, the system featured an optical window to allow for inspection and fluorescence microscopy.
Keywords: Microfluidics; 3D cell culture; electrochemical sensing; Single cancer cells, immunofluorescent.
VI
Resumo
O cancro é um dos maiores problemas de saúde no mundo e um maior conhecimento da doença é necessário. Para alcançar este objetivo novas ferramentas tem de ser desenvolvidas que permitam diagnósticos mais cedo e prevenção da doença. Para estudar as diferentes etapas do cancro, progressão e evasão, diferentes in vitro modelos tem de ser desenvolvidos. Maioritariamente, in vitro modelos usam culturas 2D que não se assemelham ao verdadeiro tecido.
Para ultrapassar estas limitações modelos de cultura 3D têm de ser desenvolvidos. Dispositivos microfluidicos apresentam interessantes características como baixo preço e baixo consumo de reagentes e soluções, grandes resultados, monitorização e fácil conjunção com biossensores para diferentes aplicações.
Nesta Tese de Mestrado um bio-reactor com base na microfluídica foi desenvolvido permitindo em tempo real monitorizar células em cultura 3D num esqueleto fabricado com técnicas de engenharia. O dispositivo foi em polimetil-metacrilato (PMMA) devido a uma alta robustez bem como ótimas propriedades óticas e baixo custo. Um biossensor eletroquímico foi incorporado no dispositivo para monitorizar o pH da cultura celular como representação das diferentes etapas do cancro. Simultaneamente o sistema destaca uma janela ótica que permite inspecionar e utilização do Microscópio fluorescente.
VIII
Content
ACKNOWLEDGEMENTS ... I ABSTRACT ... IV RESUMO ... VI CONTENT ... VIII LIST OF FIGURES ... XLIST OF TABLES ... XIII
LIST OF ABBREVIATIONS ... XV
LIST OF SYMBOLS ... XVI
MOTIVATION AND OBJECTIVES ... 1
1. INTRODUCTION ... 2
1.1. Cell culture systems (2D and 3D) and application in micro devices ... 2
1.1.1. 2D cell culture ... 3
1.1.2. 3D cell culture ... 3
1.1.3. Organ-on-a-chip... 5
1.2. Monitoring techniques for organ-on-chip ... 6
1.3. Electrochemical sensing and application in micro devices ... 6
2. MATERIALS AND METHODS ... 8
2.1. Designing and Fabrication of micro-reactor ... 8
2.2. Electrochemical sensing ... 8
2.3. Cell culturing/seeding on micro-reactor ... 10
2.4. Cell staining and Microscope Immunofluorescence ... 10
3. RESULTS AND DISCUSSION ... 11
3.1. Design and fabrication of Micro-reactor ... 11
3.2. Electrochemical sensing in the micro-reactor... 12
3.2.1. Stability tests ... 13
3.2.2. pH monitoring using CV... 15
3.2.3. pH monitoring using Chronopotentiometry and Chronoamperometry ... 17
3.2.5. Calibration Curve ... 22
3.3. Cell culture in the micro-reactor ... 24
3.4. Monitoring of cell culture pH in the micro-reactor ... 26
4. CONCLUSION AND FUTURE PERSPECTIVES ... 30
IX
ANNEX 1 – TYPES OF CELL CULTURE ... 36
ANNEX 2 - COMPONENTS OF MICRO-REACTOR ... 37
ANNEX 3 - ARTCAM PROGRAM FILE ... 38
ANNEX 4 - GG-HYDROGEL PROPERTIES ... 40
ANNEX 5 - CHRONOAMPEROMETRY STUDY ... 41
ANNEX 6 – CV ON MICRO-REACTOR ... 42
ANNEX 7 – CHRONOAMPEROMETRY FOR CALIBRATION CURVE ... 43
X
List of figures
Figure 1 –Types of 3D cell cultures: (A) Scaffolds. (B) Bioprinting of microfibrous scaffold encapsulating endothelial cells to show a bioprinting example [68]. (C) Organ-on-a-chip typical design. (D) Organoids formation from cancer cells or stem cells. Induced pluripotent stem cells and embryonic stem cells from humans, generating floating spheroids and posteriorly planted on ECM in culture medium that initiated organoids formation. (E) spheroids planted in the culture medium and seeded mixed with a ECM (Hydrogel). ... 4
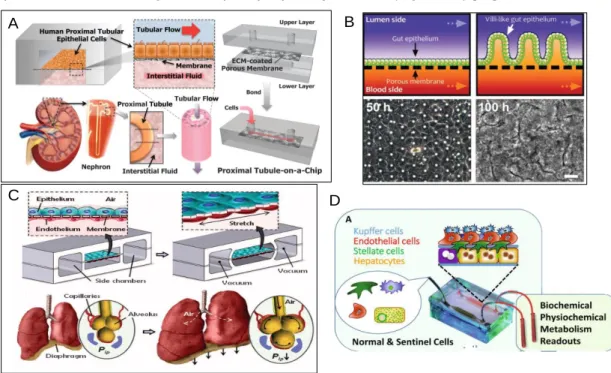
Figure 2 - Various types of cell cultures currently been used on latest organ-on-chips. (A) This device design mimics the natural architecture, tissue–tissue interface and dynamically active mechanical microenvironment of the living kidney proximal tubule [82]. (B) Schematic showing transformation of a planar intestinal epithelium into villus structure (top) and corresponding phase contrast images of Caco-2 cells that undergo similar villus morphogenesis recorded at 50 and 100 h (bottom) [84]. (C) The microfabricated lung mimic device uses compart- mentalized PDMS microchannels to form an alveolar-capillary barrier on a thin, porous, flexible PDMS membrane coated with ECM [83]. (D) The liver acinus module with a microchip, including a diagram of four liver cell types and sentinel biosensor cells layered in the device [85]. ... 6
Figure 3 - Example of electrochemical systems used in cell culture for monitoring cell activities. (A) Design of an MBA (full name) modified gold-plated polymeric substrate with a regular 3D surface array for the capture, detection and release of CTCs [97]. (B) FESEM image from MCF-7 cells attached to the silicon nanowires surface, followed by the CV of the experiment [98] (C) pH sensitive hydrogel nanofiber integrated light addressable potentiometric sensor (NF-LAPS) setup. The diagram on the right shows the sensor setup combing three different electrodes, a semiconductor working electrode (WE), a reference electrode (RE), and a counter electrode (CE) [99]. ... 7
Figure 4- Fabrication of the MR. (A) Design on SolidWorks; (B) ArtCAM simulation that generates G-code for the CNC machine; (C) High Speed Micro milling CNC machine. ... 11
Figure 5 - Photograph of the fabricated MRs: (A) First generation MR. (B) Second Generation MR with big O-ring and cover slip. ... 12
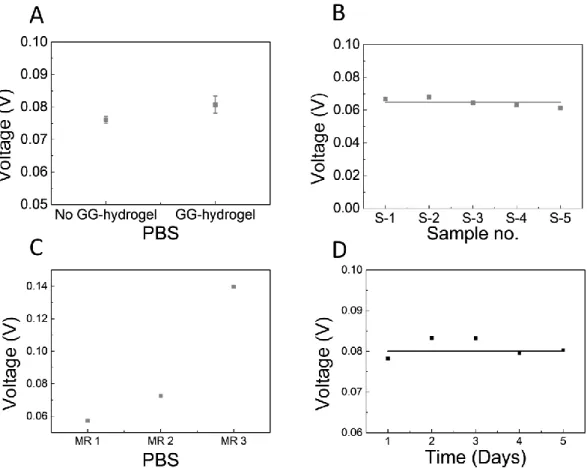
Figure 6 - Stability of CV measurements inside the MR: (A) CV measurements in the MR with and without GG-hydrogel in the PBS buffer. (B) CV measurements in the MR of the variability between 5 different GG-hydrogels. (C) CV measurements in the MR with between 3 different MR. (D) stability with time. ... 13
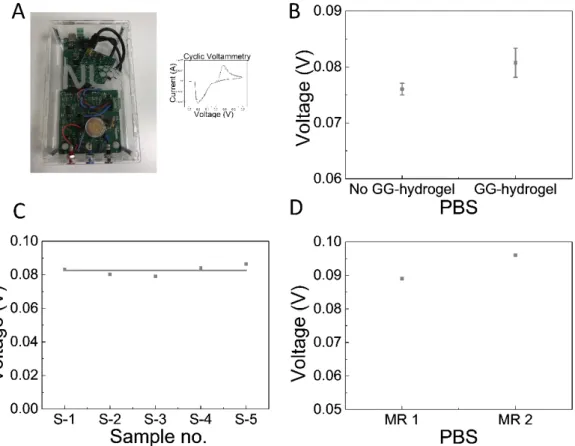
Figure 7 - Stability of CV measurements in the MR. (A) Device used in electrochemistry readings with a typical CV graph. (B) CV measurements in the MR with and without GG-hydrogel in the PBS solution. (C) CV measurements in the MR of the variability between 5 different GG-hydrogels. (D) Difference between two distinct MR. ... 14
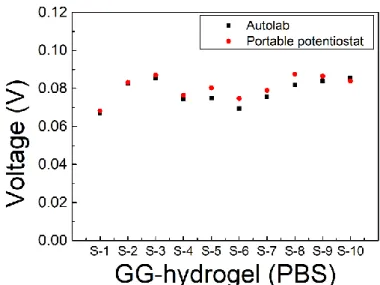
Figure 8 - Readings of 10 different GG-hydrogels inside MR using the Autolab (black) and the PP (red). ... 15
Figure 9 - Potential/Current versus pH value. Slope meaning the sensitivity ... 16
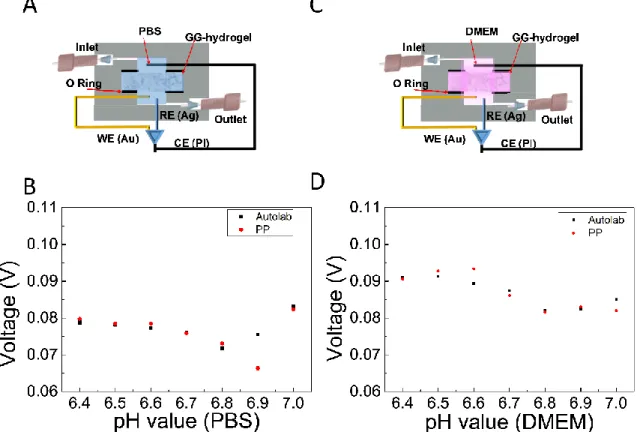
Figure 10 - pHe monitoring in the MR: The system was configured to measure in PBS (A) and in a DMEM solution (C). The voltage peak was plot against pH values (from 6.4 to 7.0) using the Autolab and the PP in PBS (B) and in media (D). ... 16
Figure 11 - pHe monitoring outside of the MR. (A) new configuration used in experiments, for PBS
solution. (B) Autolab system used followed by typical chronoamperometry and chronopotentiometry curves. (C) Chronopotentiometry electrochemistry method used with 1µA and 10µA in PBS solution
XI
versus pH value (from 3.0 to 10). (D) Chronoamperometry electrochemistry method used with 0.9V applied voltage in PBS solution versus pH value (from 3.0 to 10.0). ... 18
Figure 12 - pHe monitoring outside of the MR. (A) new configuration used in experiments, for DMEM
solution. (B)Autolab system used followed by typical chronopotentiometry curve. (C) Chronopotentiometry electrochemistry method used with 10 µA applied current in DMEM solution versus pH value (from 7.65 to 8.05). ... 19
Figure 13 - pHe monitoring outside of the MR. (A) new configuration used in experiments, for PBS. (B)
AUTOLAB system used followed by typical chronoamperometry and chronopotentiometry curves. (C) Chronopotentiometry electrochemistry method used with 1µA and 10µA in PBS solution. (D) Chronopotentiometry with 1 V of applied potential electrochemistry method used in PBS solution. .... 20
Figure 14 - pHe monitoring outside of the MR. (A) configuration used in experiments for PBS solution.
(B) AUTOLAB system used followed by typical chronoamperometry and chronopotentiometry curves. (C) Chronoamperometry with 0.9 V potential applied electrochemistry method in PBS pH values (from 3.0 to 7.0). (D) Chronopotentiometry electrochemistry method used with 1µA and 10µA current applied in PBS solution pH value (from 3.0 to 10.0). (E) Chronoamperometry with 0.9 V potential applied electrochemistry method in PBS pH values (from 7.0 to 7.4). (F) Chronopotentiometry electrochemistry method used with 1µA and 10µA current applied in PBS solution pH value (from 7.0 to 7.4). ... 21
Figure 15 - pHe monitoring outside of the MR. (A) Configuration used in experiments, for DMEM solution.
(B) AUTOLAB system used followed by typical chronopotentiometry curve. (D) Chronopotentiometry electrochemistry method used with 1 µA current applied in DMEM solution of pH values (from 7.65 to 8.05). (E) Chronopotentiometry electrochemistry method used with 10 µA current applied in DMEM solution of pH values (from 7.65 to 8.05). ... 22
Figure 16 - pHe monitoring outside of the MR. (A) Configuration used in experiments for calibration curve
inside the MR, for DMEM solutions in Autolab system with Chronopotentiometry method. (B) Chronopotentiometry with 10 µA applied current, readings in 2 combined MRs. (C) Chronopotentiometry method with 10 µA applied current, reading in 1 MR. (D) Chronopotentiometry method with 10 µA applied current, reading in 1 MR. ... 23
Figure 17 - Immunofluorescence assay: (A) configuration used for the assay. (B) Immunofluorescence images of bright filed image, DAPI, Anti-HER2, Anti-Pan Cytokeratin and overlay with 20x lens. Scale bars are 100µm. (C) Immunofluorescence images of bright filed image, DAPI, Anti-HER2, Anti-Pan Cytokeratin and overlay with 20x lens. Scale bars are 50µm. ... 25
Figure 18 - Immunofluorescence assay: (A) configuration used for the assay. (B) Immunofluorescence images of bright filed image, DAPI, Anti-HER2, Anti-Pan Cytokeratin and overlay with 20x lens. Scale bars are 200µm. ... 26
Figure 19 - Cell culture inside MR. (A) Configuration used in cell culture, SK-BR-3 cancer cells, measurements were done in Autolab system through chronopotentiometry method. (B) Photograph of actual cell culture inside micro-reactor. (C) Readings of Chronopotentiometry (10µA) method in third and Fourth day with the resultant potential. Static conditions in blue and cell medium replace in red(D) Time (hour) versus theoretical pH value ... 27
Figure 20 - Cell culture inside micro reactor. (A) Configuration used in cell culture, SK-BR-3 cancer cells, measurements were done in Autolab system through chronopotentiometry method. (B) Readings of Chronopotentiometry (10µA) method over 72 hours in 5 E 3 SK-BR-3 cells. Static conditions in blue and cell medium replace in red. (C) Readings of Chronopotentiometry (10µA) method over 72 hours in 1.5 E 4 SK-BR-3 cells. Static conditions in blue and cell medium replace in red. ... 28
Figure 21 - Cell Culture inside MR. (A) Theoretical pH value for 5 E 3 SK-BR-3 cells, in 72 hours. (B) Theoretical pH value for 1.5 E 4 SK-BR-3 cells, in 72 hours. (C) Immunofluorescence images of bright filed image, DAPI, Anti-HER2, Anti-Pan Cytokeratin and overlay with 20x lens. Scale bars are 200µm. 5 E 3 SK-BR-3 cells. (D Immunofluorescence images of bright filed image, DAPI, Anti-HER2, Anti-Pan Cytokeratin and overlay with 20x lens. Scale bars are 200µm. 5 E 3 SK-BR-3 cells. ... 29
XII
Figure A1 – Different components of MR. (A) 4mm screw. (B) Flangeless Fitting. (C) Big O-ring. (D) Inner o-ring. (E) Cover slip. (F) GG-hydrogel. (G) Bottom part. (H) top part ... 37 Figure A2 – ArtCAM file to fabricate micro-reactor first generation. (A) Inner parts of micro-reactor in: (i) Design in ArtCAM. (ii) paths of end-mill tip. (iii) simulation of paths. (B) Outer parts of micro-reactor in: (i) Design in ArtCAM. (ii) paths of end-mill tip. (iii) simulation of paths. ... 38
Figure A 3 - ArtCAM file to fabricate micro-reactor first generation. (A) Inner parts of micro-reactor in: (i) Design in ArtCAM. (ii) paths of end-mill tip. (iii) simulation of paths. (B) Outer parts of micro-reactor in: (i) Design in ArtCAM. (ii) paths of end-mill tip. (iii) simulation of paths. ... 39
Figure A 4 -GG-hydrogel. (A) Dimensions of GG-hydrogel of diameter, height, Pore Size, Pore wall and porosity obtained from (REF. END). (B) Photograph showing GG-hydrogel in: (i) dry conditions. (ii) soaked with PBS solution. (iii) soaked with DMEM solution. ... 40 Figure A 5 – Commercial set of electrodes in Chronoamperometry method. Different potentials used to get correspondent value of current ... 41
Figure A 6 - CV readings with different pH values on PBS. The reference electrode was coated with Cl ... 42
Figure A 7 – Chronoamperometry pH calibration curve in the range of pH from 6.4 to 7.4 in DMEM solution in AUTOLAB and P.P systems, in the MR. ... 43
XIII
List of tables
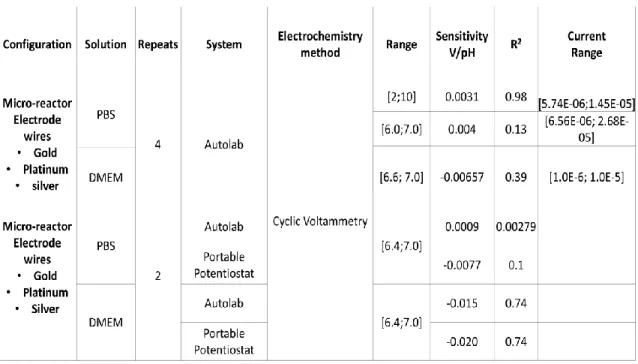
Table 1 – 2D culture versus 3D culture methods comparison [18]. ... 2 Table 2 - Sensitivity and Linear fit value for CV experiments in Autolab and Portable Potentiostat. .... 17
Table 3 - Sensitivity and Linear fit value for Chronopotentiometry and Chronoamperometry experiments in Autolab system ... 24
XV
List of Abbreviations
2D- two dimensions 3D- three-dimension Ag- Silver
AgCl- Silver/Silver Chloride
ASCs- organ-restricted adult stem cells Au- Gold
BSA- Bovine Serum Albumin C6H8O7- Citric Acid
CA- Chronoamperometry CH3CH2OH- ethanol
Cl- Chloride
CNC- Computer numerical control CO2- Carbon Dioxide
CP- Chronopotentiometry CV- cyclic voltammetry
DMEM- Dulbecco’s Modified Eagle’s Medium ECM- Extracellular Matrix
EC-MR- Electrochemical Micro-reactor FBS- Fetal bovine serum
HCl- Hydrochloric acid HCS- high content screening HTS-high throughput screening IC- Integrated Circuit
MQ- Milli-Q ultrapure water MR- Micro-reactor
MTF-Muscular thin film NaOH- Sodium Hydroxide OOC-organs on chip PP- Portable Potentiostat PBS- Phosphate Buffered Saline Pt- Platinum
PMMA- Poly-methyl methacrylate PSCs- pluripotent stem cells RT- Room Temperature UVs- Ultra-Violets
XVI
1
Motivation and Objectives
Animal testing has a crucial role in drug trials, being the only reasonable in vivo model for drug screening prior to testing in humans, but these models have still many limitations like biological differences, animal-human translatability, cost and ethical problems [1]. In this sense, a large number of drugs are rejected by the human body despite succeeding in the animal studies [1]. The ethical issues together with the need to predict drug rejection in humans, lead to the re-emergence of in vitro tests using human-derivate cells. Traditional 2D cell cultures grow in monolayers attached to a plastic surface and have many limitations that make them different from real tissues. In these 2D cultures, the cell-cell and cell-extracellular environment interaction are very different to in vivo, which influences differentiation, viability, expression of genes and proteins, proliferation, drug metabolism, responsiveness to stimuli, loss of phenotype, and other cellular functions. Hence, to mimic the real cell function, it is important to create a 3D matrix where cells can grow in every direction without limitations. The aim of this work is to create a micro reactor where cancer cells can grow in 3D under a continuous unidirectional flow using a Gellam-gum hydrogel, while monitoring cell growth non-invasively using integrated biosensors. For this purpose, the specific objectives of this work were:
• To design and develop a micro-reactor (MR) for 3D cell culture • To monitor and optimize cell growth in the micro-reactor
2
1. Introduction
Despite the large investment, time and effort put in the development of new drugs (normally 12 to 15 years), only 11 % of the drugs in clinical trials are finally approved by the authorities [2]–[4], while most fail in animal or human testing and never reach the market [5]. Besides the ethical issues, drug testing in animals is a crucial step in the drug development workflow, however animal organs have different biological and physiological complexity compared to humans, and often behave different than the human system, ultimately causing the failure of drug testing [1], [4], [6]– [9]. Recent studies show the poor correlation between animal data and human outcomes. [10]– [14]. To decrease the associated costs and to improve the efficiency of drug development and approval, it is important to create simulated microenvironments for drug testing which mimic as much as possible the human body [4], [15]. This simulated microenvironment can be achieved with the development of controlled microfluidic-based cell culture model systems.
1.1. Cell culture systems (2D and 3D) and application in
micro devices
Cell culture systems enable the studies of formation, function and pathology of tissues and organs [16]. Cell cultures enable the study of mechanisms of diseases, tissue morphology, development of tissue engineering and protein production [17]. In the context of cancer, cell cultures are used to observe differentiation and growth of cells outside human body, with the advantage of closely mimic the in vivo genetic features of tumours and thus make it possible to perform some functional experiments, outside the complex in vivo micro-environment [18]. For cells to grow in vitro it is necessary to have a specific substrate for cell attachment and a medium that supplies essential nutrients such as amino acids, carbohydrates, vitamins and minerals [19]. In vitro cultures facilitate the creation of several experiment replicates to achieve statistically significant results in a reasonable amount of time. Nowadays, the biotechnology industry use these cell culture systems for the production of proteins and vaccines, as well as for drug screening [19]. According to the type of cell anchorage are two types of cell culture systems: 2D or 3D. Traditional 2D cell cultures are grown in petri dishes, multi-well plates or flasks, while 3D cultures (and organ-on-chip systems) have flourished in recent years to mimic the real tissue model. A comparison of 2D versus 3D cell culture systems is provided in Table 1.
Table 1 – 2D culture versus 3D culture methods comparison [18].
Type of culture 2D 3D Refer
ences Time of culture
formation
Fast process (from minutes to hours)
Relatively slow (from hours to a few days)
[20]– [22]
Culture quality
Easy to interpret, simplicity of culture, high performance,
Difficult to interpret, cultures more difficult to carry out, worse performance and reproducibility.
3 term culture
In vivo imitation
Structure of the tissue or tumour mass is not mimicked
Tissues and organs are in 3D form like in the in vivo situation
[7], [24], [25] Cell interactions Poor cell and
cell-ECM interactions
Suitable cell-cell and cell-ECM interactions
[26]– [32] Characteristics of
cells
Loss of polarity and phenotype; changed morphology and the way cells divide
Polarity and phenotype
maintained; Morphology and ways of divisions preserved [16], [33]– [37] Access to essential compounds Unlimited access to nutrients, oxygen, signalling molecules and metabolites
Variant access to nutrients, oxygen, signalling molecules and metabolites
[38]– [40]
Molecular mechanisms
mRNA united, modified gene expression, biochemistry and topology dependent of cells
Same expression of genes, biochemistry and topology of cells like in vivo
[41]– [47]
Cost of maintaining a culture
Low cost, rapid and available in the market
Time consuming, expensive and few tests available on market
[48]– [51] Tumoral
heterogeneity Basic
Better on drug penetration, difference in mobility and
approximation via the proliferation gradient
[52]
Angiogenesis Observational Functional [52]
1.1.1. 2D cell culture
Cells growing as a monolayer in a flat petri dish, culture flask or multi-well plate attached to a surface that provides mechanical support for the cells are referred as the 2D cell cultures [38]. Still, other 2D cell cultures do not need a flat surface to grow, and can be made free floating in cell medium, known as suspension culture [40]. This type of monolayer culture has access to nutrients (carbohydrates, minerals, vitamins and amino acids), hormones, growth factors, gases (CO2 and O2) and regulates the physico-chemical environment (osmotic, temperature, pH and
pressure) through the medium [19], [53], [54]. Due to the limited amount of cell medium available in petri dishes, the medium needs to be changed every couple of days [18], [55]. The main drawback of 2D cultures is related to the limited cell movement and position, while almost all cells (non-circulating) in the human body are surrounded by the so-called extracellular matrix (ECM) or other cells. In this sense, 2D cell cultures do not take into account the 3D natural environment of cells [41], [54], [56], [57].
1.1.2. 3D cell culture
In 3D culture systems, the cells grow supported by diverse artificial ECM or scaffolds mimicking the specific 3D microarchitecture of tissues and organs [18]. In this 3D systems, an artificial environment is created where cells can grow or interact with their surrounding in all three dimensions [18], [58], [59]. The field of 3D culture is further subdivided in scaffold-based or non-scaffold based [60], [61]. A non-scaffold is a support where cells can proliferate, migrate and aggregate, and can be made from synthetic or natural materials (including 3D bioprinting) [54],
4 [31], [52], [56], [62]. Scaffold-based systems are also called ‘’top-down’’, since cells follow a certain shape and size due to the scaffold structure [32], [63]. Non-scaffold based systems or spheroids, consist in the formation of multi-cellular aggregates that create their own ECM [64]. They are also called ‘’bottom-up’’, as the complex tissue structures are built from individual cells. Scaffolds: Scaffolds are support materials that allow cells to grow, proliferate and differentiate on them to form functional tissues [65]. They can be made of different materials with different porosity, permeability, surface, chemistry and mechanical properties. Adhesion surface and mechanical strength is delivered by scaffolds to establish interaction with the surrounding tissue to respond to biological and physiological changes [31], [32], [63]. Scaffolds can be made of natural biomaterials like: collagen, chitosan, matrigel, agarose, hyaluronic acid, fibronectin, gelatin, cellulose, starch, silk, fibrillated laminin, vitronectin, plants or microorganisms; but also of synthetic polymers Polyethylene glycol (PEG), Polyvinyl alcohol(PVA) and polyhydroxythylmethacrylate (PHEMA) [56]. Hydrogels, which contain high amount of water are a commonly used material in scaffolds (agarose, collagen, hyaluronic and fibrin) [60], [66]. Solid-scaffolds have the ability of allowing cells to create similar structures to those of the natural
tissues, with good structure control and reproducibility [61].
3D bioprinting: 3D bioprinting is a technique where live cells, biomaterial and supporting components are printed simultaneous in a bottom-up approach [32], [67], [68]. Biomaterial Figure 1 –Types of 3D cell cultures: (A) Scaffolds. (B) Bioprinting of microfibrous scaffold encapsulating endothelial cells to show a bioprinting example [68]. (C) Organ-on-a-chip typical design. (D) Organoids formation from cancer cells or stem cells. Induced pluripotent stem cells and embryonic stem cells from humans, generating floating spheroids and posteriorly planted on ECM in culture medium that initiated organoids formation. (E) spheroids planted in the culture medium and seeded mixed with a ECM (Hydrogel).
5 decellularized-matrix with the following characteristics: biocompatibility, biodegradability, biomechanical, printability and biomimicry properties [69]. One example of bioprinting is the self-assembly and fusion of multicellular spheroids that make their own ECM [70]. This bioprinting make possible to print breast cancer neotissues without the aid of a supportive ECM [71]. Spheroids: Spheroids are aggregates of single cells or co-cultures with 400-500 µm in size, spherical form and heterogeneous, grown in scaffolds in a 3D environment [31], [72], [73]. This irregular cell aggregates do not need a supportive matrix to grow and do not show the organization of tissues [31], [74]. One of the main advantages is the spherical form, mimicking the biochemical and cellular conditions found in solid tumours [74]. Organoids: 3D cultures derived directly from the patient’s cells and either embedded in a specific matrix or forming its own matrix [75]. Organoids well recapitulate large number of biological parameters like cell interactions, cell-ECM interactions, and spatial organization of heterogeneous tissue-specific cells. Micro-devices: Microfabrication techniques, including micro-milling, can be used to fabricate low cost organ-on-chip (OOC) devices [7], [76], [77]. Deriving from lab-on-a-chip systems, this field requires a mix between microfluidic and cell biology techniques [7], [56]. In this case, cells are cultured in 2D or 3D inside the micrometre-sized chambers of the microdevices [78], [79]. Microfluidics enables the regulation of factors such as fluid shear stress, tension and compression torque that influence mechanical cues induced by physiological flow [1], [4], [10], and facilitate the continuous flow of nutrients and growth factors through the medium [80]. OOCs also present advantages over current animal models, as they help to reduce significantly the amount of experiments needed for drug testing. Along with different microscopy techniques, OOCs can also be integrated with other sensing elements for monitorization [4].
The several advantages of 3D cell culture systems are summarized in the Annex 1.
1.1.3. Organ-on-a-chip
Recently, researchers have successfully developed various types of OOC systems, including heart on chip, kidney on chip, liver on chip, lung on chip and gut on chip. Jang et al. presented for the first time a culture of primary human kidney proximal tubular epithelial cells using a microfluidic device that sandwiched a porous ECM coated polyester membrane (Figure 2A) [81]. Dongeun et al. developed a device with two microchannels closely separated by a flexible, porous and thin membrane made of stretchable silicone- Polydimethylsiloxane (PDMS). This membrane separated an alveolar epithelial cells culture on the upper channel from a vascular endothelial cell culture on the lower. In the upper was introduced air and in the bottom part culture medium, to replicate the lung function (Figure 2C) [82]. Kim and Ingber worked on a gut-on-a-chip that solved a major problem of conventional culture models, by incorporating fluid flow and peristaltic movements [83]. The cells in this device underwent spontaneous 3D villus morphogenesis as well as four types of differentiated epithelial cells of the small intestine (absorptive, mucus-secretory, enteroendocrine and Paneth) (Figure BC) [83]. Brushan and co-workers proposed a microfluidic device to mimic functional liver tissue of the acinus. The culture in this device contained four
6 different types of cells such as hepatocytes, endothelial, stellate and Kupffer cells. These four types of cells were arranged in a layer-by-layer organization (Figure 2D) [84].
1.2. Monitoring techniques for organ-on-chip
Along with the advances in tissue-on-chip and OOC systems, researchers have also been devoted to the development of tools to monitor cell viability and metabolic activity. The most used technique is optical microscopy, together with fluorescence and confocal microscopy [85]. Another commonly used technique is electrochemical sensing, since miniaturization of the electrodes is possible, and can be easily integrated in the OOC device. Compared with optical sensors, electrochemical sensors are attractive due to their detectability, experimental simplicity, easy to be integrated and low-cost. Furthermore, electrochemical sensors do not need sophisticated instrumentation and are not affected by matrix interferences as is the case of fluorophores [40], [86].
1.3. Electrochemical sensing and application in micro
devices
To efficiently extract useful information from 3D culture devices, continuous monitoring is necessary. And electrochemical sensing can be integrated in OOC systems to achieve this goal. Electrochemical sensors do not depending of the reaction volume, and only need low power supply [87]–[89]. The most typical configuration of an electrochemical biosensor is a 3-electrode
A B
C D
Figure 2 - Various types of cell cultures currently been used on latest organ-on-chips. (A) This device design mimics the natural architecture, tissue–tissue interface and dynamically active mechanical microenvironment of the living kidney proximal tubule [82]. (B) Schematic showing transformation of a planar intestinal epithelium into villus structure (top) and corresponding phase contrast images of Caco-2 cells that undergo similar villus morphogenesis recorded at 50 and 100 h (bottom) [84]. (C) The microfabricated lung mimic device uses compart- mentalized PDMS microchannels to form an alveolar-capillary barrier on a thin, porous, flexible PDMS membrane coated with ECM [83]. (D) The liver acinus module with a microchip, including a diagram of four liver cell types and sentinel biosensor cells layered in the device [85].
7 arranged to measure a current (Amperometry), a potential (Potentiometry) or a charge transfer resistance (Impedimetric) with time [88], [94]. Another typical measurement is the Cyclic Voltammetry, which monitors the changes in current at different potentials. The potentiometric method is good to detect analytes such as proteins, metabolites and certain electroactive species [94]. Impedimetric method is often chosen to monitor cancer biomarkers that do not have an specific charge, as miRNAs, proteins and cells [95].
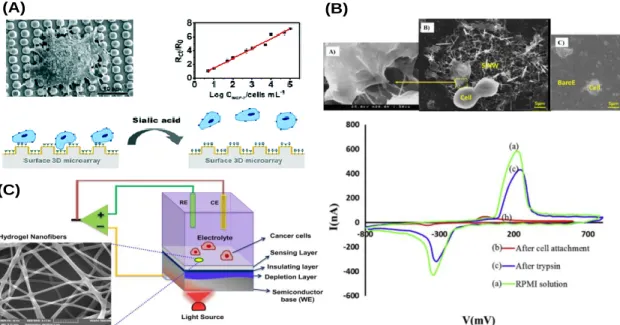
Wang et al. developed a substrate based on gold-plated polymeric material with a 3D surface. The substrate compromises a three-electrode configuration for electrochemical detection of cancer cells through electrochemical impedance spectroscopy (EIS) technique, making possible the direct detection of cancer cells in blood solution. It was achieved a sensibility of 5 cells per mL (Figure 3A) [96]. Shashaani et al. developed a silicon nanowire biosensor with a three-electrode architecture. CV and DPV electrochemical methods were used for direct detection of drugs on breast cancer cells with the electrodes surface. The system achieved changes in DPV peak of 250 nA of the sample (Figure 3B) [97]. Shaibani et al. reported on a system that monitored the change in pH of media as cancer cells consumed glucose and released lactate. This system was fast, cost-effective and simple with the ability to measure in real time cancer cell metabolism and their response to anticancer drugs in a non-invasive way over a period of 2 hours (Figure 3C) [98]. In this thesis we integrated an electrochemical sensor in a microfluidic bioreactor to continuously monitor the pH in the 3D tissue culture model.
(A) (B)
(C)
Figure 3 - Example of electrochemical systems used in cell culture for monitoring cell activities. (A) Design of an MBA (full name) modified gold-plated polymeric substrate with a regular 3D surface array for the capture, detection and release of CTCs [97]. (B) FESEM image from MCF-7 cells attached to the silicon nanowires surface, followed by the CV of the experiment [98] (C) pH sensitive hydrogel nanofiber integrated light addressable potentiometric sensor (NF-LAPS) setup. The diagram on the right shows the sensor setup combing three different electrodes, a semiconductor working electrode (WE), a reference electrode (RE), and a counter electrode (CE) [99].
8
2. Materials and Methods
2.1. Designing and Fabrication of micro-reactor
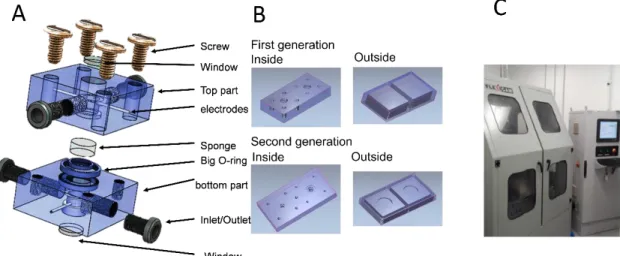
The micro-reactor (MR) was designed using a 3D CAD software (SolidWorks, Dassault Systèmes Corp., Waltham, MA) and then transferred to Art-Cam software to generate the G-Code for high speed milling. A computer numerical control (CNC) machine (FlexiCAM, Germany) performed the milling process using 1 mm and 3 mm End-mill tips (DIXI, Switzerland).
Two generations of MRs were fabricated the second-generation device compromises a big O-ring and a window in both sides.
The first-generation MR is composed of two parts, made of Poly-methyl methacrylate (PMMA), the bottom part used as base and the other top part used as lid. Both parts have the same dimensions (25 mm × 25 mm × 10 mm) and are assembled with 4 screws of 3 mm at each corner. There are 2 different chambers, one chamber to support the gellam-gum hydrogel (GG-hydrogel), obtained by a collaborator at 3B’s Portugal, and a chamber for electrodes and fluids (liquid chamber). The internal diameter of the bottom part was 7 mm with 5 mm depth for the GG-hydrogel chamber and 5 mm with 3 mm depth for the liquid chamber. The top part had an internal diameter of the liquid chamber of 5 mm with 4 mm of depth and 7 mm with 1 mm depth for GG-hydrogel. Once the devices were ready, the connections for the electrodes and microfluidic channels were made through manual drilling (BOSCH PBD 40, Portugal) using a 0.5 mm drill bit (DIXI, Switzerland). Threading tools are used to make rings for the screws and microfluidic fittings in the top and bottom of the system two in each part that can be used either as inlet or outlet. Flangeless fittings (IDEX H&S, USA) are used to connect the micro-tubing for fluidics. The electrode wires of 0.5 mm diameter are used for electrochemical analysis. The gold (Au), platinum (Pt) and silver (Ag) (99.99% Goodfellow, UK) electrodes are used as working, counter and reference respectively.
The second-generation micro reactor is made of two parts denominated bottom and top part, similarly to the first generation. Each part having dimensions of (40 mm x 40 mm x 10 mm). The dimensions were adjusted for new modifications. The internal diameter of the GG-hydrogel support was 7 mm with a depth of 2 mm in each part. The liquid chamber was produced with an internal diameter of 5 mm with 6 mm depth. An extra cavity with 1mm depth and 2 mm thickness was made around a circle of 10 mm to incorporate an O-ring. On the other face of each part a cavity was milled with 20 mm diameter and 2 mm depth to accommodate the cover slip that worked as an optical window for optical inspection.
2.2. Electrochemical sensing
To calibrate the system, the pH of Phosphate buffered saline (PBS) (Sigma, Portugal) and Dulbecco’s Modified Eagle’s Medium (DMEM) (Gibco, USA) were adjusted using solutions of citric acid (C6H8O7) and sodium hydroxide (NaOH) and measured using a compact pH meter
9 (RT). Between experiments the device was cleaned with Milli-Q ultrapure water (MQ, Millipore, USA) and 70% ethanol (CH3CH2OH) (aga, Portugal)
Cyclic voltammetry (CV) experiments were performed both, using a commercial Potentiostat (Autolab, Metroohm, Switzerland) and with a custom-made portable Potentiostat, (PP) developed in-house (INL, Portugal). This portable system contained an integrated circuit (IC) AD5933 (Analog Devices, Georgia) for high precision impedance measurements, a 32-bit ARM processor and a USB/I2C bridge microcontroller. The platform was powered with an AC-DC dual output power supply (Input: 230 V AC, Output: ± 6V DC with 250 mA maximum current capability per output). It has a DC potential range of ± 2.048 V with a resolution of 250 µV and supports six current ranges from ± 1pA to ± 3mA with 0.05 % of full-scale current resolution. The acquisition of system data was made using also a custom-made software, based on LabView.
For the electrochemical measurements in the MR, a three-electrode configuration was selected, where the platinum, gold and silver wires acted as counter, working and reference electrode, respectively. The measurements were made either in a 10 mM solution of PBS and DMEM cell medium. Prior to each measurement, the GG scaffold was submerged in solution overnight to allow for water uptake, which permits the hydrogel to reach maximum hydration showed in Annex 3. Bubbles were removed using a desiccator to avoid interferences in the CV readings [99]. On the day of the experiment, the scaffold was placed in the MR and the solution was injected using a syringe pump (New Era Pump Systems, USA) at a flow rate of 200 µL/min. A total amount of 1.5 mL of solution was flown through the MR to make sure it was fully filled, first 0.5 mL through the top chamber, then 1 mL across. Measurements were made only when the chamber was full of solution (buffer or media) and without bubbles. CV measurements were recorded from -0.3V to 0.3V at a scan rate of 0.1 V/s at RT.
Chronopotentiometry and chronoamperometry measurements were performed using commercial electrodes ( Gold, Platinum and Silver/silver chloride) and wires electrodes with a different silver/silver chloride (AgCl) reference electrode due to enhanced stability properties [100]. Measurements were first done in a beaker with 5 mL of PBS and DMEM solution at different pH values. The coating of the silver electrode was made using a 0.1M solution of Hydrochloric acid (HCl) to deposit the chloride (Cl) on the silver electrode. The silver wire was cleaned with distilled water. The part to be coated was then inserted into 0.1 M HCl and a potential of 1 V was applied during 1 min using an external power supply, this was coupled by a platinum wire as a cathode. During the electrolysis, a black deposit is formed on the silver. The electrode was then rinsed with MQ and dried with compressed air (N2) before use.
Chronopotentiometry measurements were performed only using the Autolab system, applying currents of 1 µA and 10 µA, for 180 seconds (first 100 seconds to let the system stabilize) and recording the potential response in 1 ms intervals. The chronopotentiometry curves were analysed in the stabilized period and the correspondent voltage was taken as data points.
10 The chronoamperometry measurements were performed in voltages values from 0.1 V to 1 V The voltage load was applied on the system, 0.1 V to 0.5 V, 0.8 V,0.9V and 1V, and the current response was recorded in 1ms intervals. The duration of the measurements was kept constant at 180 seconds.
2.3. Cell culturing/seeding on micro-reactor
The human breast cancer cell line SK-BR-3 (ATCC, USA) was used for the cell culture inside the Micro reactor. and cultured in DMEM (Lonza, Switzerland), supplemented with 10% fetal bovine serum (FBS) (Invitrogen, USA) and 1% Penicillin/Streptomycin (Invitrogen, USA). Cells were cultured as a monolayer in a flask at 37ºC in a 5% CO2 humidified atmosphere and were routinely
subculture when reaching confluence, being washed with PBS followed by incubation in 0.25% Trypsin-EDTA (Invitrogen, USA).
Before cells were seeded, the MR was sterilized with ethanol 70% (Sigma-Aldrich, Portugal). Ethanol was passed through the inlet and outlet tubing and sprayed directed in every component of the MR. Also, 15 minutes of Ultra-Violet (UVs) light exposure was done to make sure all the MR is free from contamination.
Cell seeding was made with a suspension of SK-BR-3 cells in 0.5 mL of DMEM. The cells were injected through the MR using a syringe pump (Harvard apparatus, Biogen Cientifica Sl, Spain) at a flow rate of 100uL/min.
Briefly cells were seeded on MR with density of 5 E 3, 1.5 E 4, 2.5 E 5 and 5.0 E 5 cells per 0.5mL and grown in the incubator for up to 4 days. Dynamic conditions were reached connecting the MR to the syringe pump at the flow rate of 2 µL/min, allowing cells a continuous fresh cell medium over time.
2.4. Cell staining and Microscope Immunofluorescence
The staining of cells was done inside the MR. First it was washed with 1mL of 0.2% TritonX (Sigma, Portugal) and incubated for 10 minutes in dark condition at 37ºC, followed by washing with 1mL of PBS. Then, the surface was blocked with 1mL of 2% Bovine Serum Albumin (BSA) (Sigma, Portugal) and incubated for 30 minutes. For immunofluorescence staining SK-BR-3 cells were incubated with antibodies: anti-ErbB2 Dylight 550 (Immunostep, Spain), Dylight 550 is excited at 562 nm and emission maximum is 676 nm, Anti-Cytokeratin-FITC (Sigma, Portugal), FITC is excited at 495 and emission maximum is 519, and 4’, 6-diamidino-2-phenylindole (DAPI) (Sigma, Portugal), is excited at 359 nm and emission maximum is 461 nm, that stains the cell nuclei. Cells were incubated for 90 minutes with the antibody and then washed with 1mL of 0.5% BSA in PBS.
The cells inside the MR were examined with inverted fluorescence microscope (Nikon-Ti) (Scientifica, UK). The filter used was Brightline Sedat filter (Semrock, USA). It was used 20x and 60x lens (Nikon-Ti).
11
3. Results and Discussion
3.1. Design and fabrication of Micro-reactor
The micro-reactor (MR) must be a fully enclosed fluidic microdevice that holds a GG-hydrogel scaffold for long term dynamic 3D cell culture. The material for the fabrication of the MR must be robust, and low cost, while displaying good chemical compatibility. Polymers, like PMMA, are cheap, compatible with micrometric milling, and offer good chemical properties, compatible with serial sterilization.
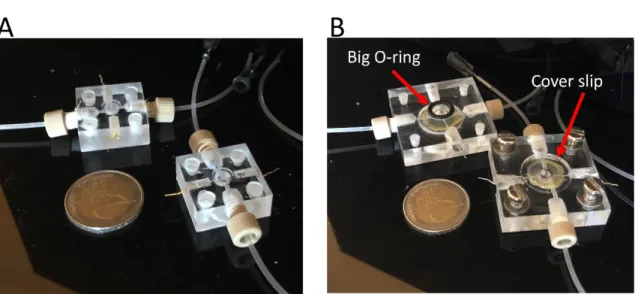
Figure 4 shows the design of the MR made in SolidWorks, displaying 4 inlets/outlets. (Annex 2 includes details on all the relevant parts needed to assemble the microreactor and Annex 4 the details of GG-hydrogel). The design file was imported in ArtCAM and G-code was generated towards automated fabrication using CNC micro-milling (additional information relative to the program can be found in Annex 3). The electrodes and fluidic ports were drilled manually in a workbench, since our CNC machine can only work on one 2D face. The first-generation MR contained 2 fluidic ports above the chamber and 2 below, accommodated a diameter of 6.6 mm height and 4.9 mm height scaffold and 3 electrodes (Figure 5A).
A second-generation MR was designed to accommodate a glass optical window to enable in situ fluorescence microscopy. Also, optical window facilitates the vision to see acidification in cell culture due to acidification in cell medium (Annex 8). This second MR also displays space for a large O-ring to improve the fluidic sealing of the chamber (Figure 5B).
Figure 4- Fabrication of the MR. (A) Design on SolidWorks; (B) ArtCAM simulation that generates G-code for the CNC machine; (C) High Speed Micro milling CNC machine.
12
3.2. Electrochemical sensing in the micro-reactor
The objective of this section was to develop an electrochemical sensing strategy to measure the pH in the 3D culture, as a way to monitor cancer cell proliferation. Otto Warburg discovered that production of energy in cancer cells relies abnormally on aerobic glycolysis even when the amount of oxygen is sufficient which leads to a more acidic microenvironment than in normal tissues [98], [101], [102]. When the intracellular environment acidifies, cells start apoptosis [103], still cancer cells can maintain intracellular pH (pHi ) rather neutral (7.2 pH) using mechanisms to remove
acids from the glycolysis such as lactate and H+ efflux by monocarboxylate transporters and
Na-driven proton extrusion [104]. In this way, the extracellular microenvironment pH (pHe) of cancer
cells is rather acidic [101], [105], reaching pHe values of 6.5, in contrast with the average 7.3 in
normal cells [105], [106].
For this purpose, an electrochemical micro-reactor (EC-MR) was developed containing a GG-hydrogel for 3D cell culture. The electrochemical flow cell followed a 3-electrode configuration, using Ag, Pt and Au wires, as reference, counter and working electrodes, respectively. The developed sensing strategy should provide a reliable calibration curve to monitor the pHe value in
the culture (from 6.4 to 7.4), as a measure of the cancer cells metabolism.
Through the Nernst equation it is possible to see an increase in the potential when the pH is decreased. Nernst equation is showed next:
𝐸
𝑓,𝑒𝑓𝑓0= 𝐸
𝑓0(
𝐴𝐵
) − 2.303
𝑚𝑅𝑇𝑛𝐹
𝑝𝐻
(equation 3.1),where 𝐸𝑓,𝑒𝑓𝑓0 is an effective formal potential. Provided DA = DB the potential midway between the
peaks for the oxidation B and the reduction A corresponding to 𝐸𝑓,𝑒𝑓𝑓0 with the shape of the
voltammogram. 𝐸𝑓0( 𝐴
𝐵) representing the standard potential. R is the ideal gas constant. F faraday
constant. T is the temperature. F for Faraday constant. n for the ionic charge.
Figure 5 - Photograph of the fabricated MRs: (A) First generation MR. (B) Second Generation MR with big O-ring and cover slip.
13 So for every 1 unit change in pH, the mV reading on the electrochemical sensor should have a change of 59.16 mV [107].
3.2.1. Stability tests
The stability of the system was tested using Cyclic Voltammetry (CV) measurements in PBS (7.4 pH at RT), which is a known electrochemical technique, already used to monitor pH [108]–[110]. In this experiment, the CV was recorded from -0.3 V to 0.3 V at a scan rate of 0.1 V/s and with current ranges from ±1 nA to ± 1 mA. The results were taken out from average oxidation peak of 5 cycles.
First, the influence of the scaffold in the MR was evaluated, running CVs in the system with and without GG-hydrogel experiments were done in triplicate and results are shown in Figure 6A. The average oxidation potential response of the MR without GG-hydrogel was 76 mV while the potential with GG-hydrogel was 81 mV. The small difference can be explained due to the resistance of GG-hydrogel which made the potential increase.
Next, to evaluate the variability of the signal using different scaffolds, CV measurements were run in the same MR, but with 5 different GG-hydrogels. As it can be seen in Figure 6B, the behaviour was very homogeneous, with a small standard deviation of 3 mV, probably due to the differences
Figure 6 - Stability of CV measurements inside the MR: (A) CV measurements in the MR with and without hydrogel in the PBS buffer. (B) CV measurements in the MR of the variability between 5 different GG-hydrogels. (C) CV measurements in the MR with between 3 different MR. (D) stability with time.
14 in the GG-hydrogel dimension (Annex.4). This value will be taken into account as noise in the calibration curves.
To understand the differences across different MRs, CV measurements were run in PBS in 3 different MRs. The potential response varies greatly, from 0.057 V to 0.139 V (Figure 6C). Hence calibration curves will be done independently for the different MRs.
Finally, the stability of the system with time was evaluated during 5 days. A maximum variability of 0.005 V was observed (Figure 6D), which will also be taken into account as noise for the calibration experiments. Altogether to have a decent signal-to-noise ratio, we expect changes in the potential to be at least 3 times bigger than the overall noise of 8 mV.
Since the final aim is to run electrochemical measurements during long term cell culture, a portable potentiostat (PP) was developed in house at INL (Figure 7A). Stability tests were also conducted in the MR using the PP. Similar to the Autolab experiments, the stability of the electrochemical measurements in the MR when using the PP was tested in the presence and absence of a scaffold, and signal variability was studied with different scaffolds and different MRs. The potential of the MR without hydrogel was 0.079 V and with GG-hydrogel it was 0.082 V (Figure 7B), the experiment was repeated 3 times. The difference of 3 mV is lower, but in the same order of magnitude as with the Autolab. The standard deviation of the signal obtained with
Figure 7 - Stability of CV measurements in the MR. (A) Device used in electrochemistry readings with a typical CV graph. (B) CV measurements in the MR with and without GG-hydrogel in the PBS solution. (C) CV measurements in the MR of the variability between 5 different GG-hydrogels. (D) Difference between two distinct MR.
15 variability of signal in 2 different MRs was only 7mV (Figure 7D).
Once the stability of the electrochemical MR (EC-MR) has been studied with the Autolab and the PP separately, a final experiment was conducted using the 2 systems at the same time. For this purpose, the EC-MR was filled with PBS and CV recorded over a potential window from -0.3 V to 0.3 V at a scan rate of 0.1 V/s and with current ranges from ±1 nA to ± 1 mA with both the PP and the Autolab system, and the signal was compared using 10 different hydrogels. The average voltage value was 0.078 V and 0.081 V for the Autolab and the PP, respectively (Figure 8C), hence only showing a variability of 3 mV. With these results, we can conclude that the behaviour of our PP is very similar to that of the Autolab, so it can be used for the subsequent experiments with confidence.
3.2.2. pH monitoring using CV
Once the stability of the EC-MR was demonstrated, it was time to evaluate the sensitivity of the system against changes in the pH of the solution. To calculate the value of sensitivity potential/current was plotted versus pH value. It was made a linear regression as showed in Figure 9. The slope of the linear regression was used as sensitivity.
16 Experiments were run using the Autolab and the PP simultaneously, both in the presence of PBS (Figure 10A) and DMEM (Figure 10C). The CV was recorded over a potential window from -0.3
Figure 9 - Potential/Current versus pH value. Slope meaning the sensitivity
Figure 10 - pHe monitoring in the MR: The system was configured to measure in PBS (A) and in a DMEM solution (C). The voltage peak was plot against pH values (from 6.4 to 7.0) using the Autolab and the PP in PBS (B) and in media (D).
17 prepared at different pH in the range from 6.4 to 7, and all experiments were repeated twice. The influence of the pH in the signal was evaluated plotting the voltage peak against the pH values and fitting using a linear regression (Figure 10 B,C).
The sensitivity of the EC-MR in PBS was 0.00085 V/pH with R2 of 0.0028 and -0.0077 V/pH with
R2 of 0.1 in the Autolab and PP respectively. The sensitivity in DMEM was 0.015 V/pH and
-0.020 V/pH for the Autolab and the PP system respectively. R2 was a constant value of 0.74 in
both systems.
Despite the sensitivity to the solution pH was better in DMEM, the higher value (20 mV/pH) is only 2.5 times bigger than the value of the noise, meaning than the signal-to-noise ratio of this configuration is really poor. As a conclusion, the CV configuration cannot be used to monitor the pHe of the 3D culture.
The results of all the CV experiments done are summarised in Table 2.
3.2.3. pH monitoring using Chronopotentiometry and Chronoamperometry
After assessing that the CV strategy was not sensitive enough to monitor pH changes in the range needed, the sensing strategy was changed to Chronoamperometry and Chronopotentiometry. In a chronopotentiometry (CP) experiment, a constant current is applied, and the potential is measured against time. Similarly, in a chronoamperometry experiment (CA) a constant potential is applied, and the current is measured along time. For both, CP and CA, the current and potential
18 values to apply should be extracted from the preliminary CV experiments, according to the position of the oxidation and/or reduction peaks [111]. Accordingly, CP experiments were run at 1µA and 10µA. For the CA experiments, since the current values obtained from the experiments were too low, a study was performed to find the best potential to be applied (Annex 5). It was concluded to use 0.9 V and 1 V to obtain higher values of current.
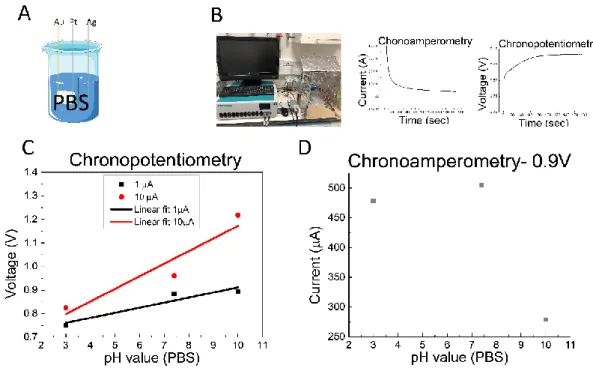
Initial tests to choose the optimal EC configuration were performed in a beaker (Figure 11A) containing 5 ml of PBS solution with pH values from 3 to 10. CP experiments were run at 1µA and
10µA over a period of 180 s, while CA experiments were run at 0.9 V during 180 s (Figure 11B). When the current applied between the working and the counter electrodes was 1 µA the sensitivity was 0.022 V/pH with a R2 of 0.9. On the other hand, with a fixed current of 10 µA the sensitivity
was 0.054 V/pH with a R2 0.94. (Figure 11C). For the CA experiment, sensitivity was -2.4E-05
A/pH with a R2 of 0.5, not following a trend line (Figure 11D). In this initial test, the method that
delivered better sensitivity with a better linear fit was the CP with an applied current of 10µA.
The configuration with better performance was then used to evaluate the sensitivity of pH monitoring in DMEM. For this purpose, a beaker with 5 mL of media was used at pH values 7.6 to 8.1 (Figure 12A) and a CP at 10 µA was recorded using the Autolab system (Figure 12B). The sensitivity was -0.036 V/pH with a R2 of 0.31 (Figure 12C), which shows that the potential does
not follow a linear trend in the pH range of our interest and, hence this configuration cannot be used to monitor the pH in our EC-MR.
Figure 11 - pHe monitoring outside of the MR. (A) new configuration used in experiments, for PBS solution. (B) Autolab system used followed by typical chronoamperometry and chronopotentiometry curves. (C) Chronopotentiometry electrochemistry method used with 1µA and 10µA in PBS solution versus pH value (from 3.0 to 10). (D) Chronoamperometry electrochemistry method used with 0.9V applied voltage in PBS solution versus pH value (from 3.0 to 10.0).
19 Since the literature reports on the poor stability of silver electrodes, and the improvement when using a protective chloride layer [100], the configuration of the system was changed using commercial Au, Pt and Ag/AgCl electrodes, as working, counter and reference respectively (Figure 13A).
CP experiments were run at 1 µA and 10 µA using the Autolab system, while CP experiments were run at an increased 1 V (Figure 13B). The CP method fitted to a linear regression with R2 =
0.97 and a sensitivity of 0.012 V/pH at 1µA, and R2 = 0.9 and sensitivity of 0.0065 V/pH at 10µA
(Figure 13C). The CA method showed a sensitivity of 7.5 µA/pH and a R2 of 0.98 (Figure 13D).
As a conclusion, commercial electrodes delivered positive results using both CP and CA methods, which can be explained by the improved stability of the Ag/AgCl reference electrode.
Figure 12 - pHe monitoring outside of the MR. (A) new configuration used in experiments, for DMEM solution. (B)Autolab system used followed by typical chronopotentiometry curve. (C) Chronopotentiometry electrochemistry method used with 10 µA applied current in DMEM solution versus pH value (from 7.65 to 8.05).
20 To replicate the new results with the wire electrodes, a new set of wires were prepared, including a freshly coated Ag/AgCl reference electrode, and immersed in a beaker containing 5ml of PBS (Figure 14A). CP (1 µA, 10 µA) and CA (0.9 V) experiments were performed in the Autolab (Figure 14B). The sensitivity of the system was evaluated in pH ranges 3 to 10 (Figures 14 C,D) and in Figure 13 - pHe monitoring outside of the MR. (A) new configuration used in experiments, for PBS. (B) AUTOLAB system used followed by typical chronoamperometry and chronopotentiometry curves. (C) Chronopotentiometry electrochemistry method used with 1µA and 10µA in PBS solution. (D) Chronopotentiometry with 1 V of applied potential electrochemistry method used in PBS solution.
21 and -3.7 E-04 A/pH (R2 = 0.81) in the large and small pH range, respectively. CP at 1µA showed
sensitivities of 0.043 V/pH (R2 = 0.96, pH range 3-10) and 0.0029 V/pH (R2 = 0.83, pH range 7.0-
7.4). CP at 10µA showed sensitivities of 0.11 V/pH (R2 = 0.94, pH range 3-10) and 0.011 V/pH
(R2 = 0.80, pH range 7.0-7.4). In all cases, the linear fit was worse in the pH range of interest, but
the sensitivity was higher. Still, CP experiments showed better performance over CA.
Figure 14 - pHe monitoring outside of the MR. (A) configuration used in experiments for PBS solution. (B) AUTOLAB system used followed by typical chronoamperometry and chronopotentiometry curves. (C) Chronoamperometry with 0.9 V potential applied electrochemistry method in PBS pH values (from 3.0 to 7.0). (D) Chronopotentiometry electrochemistry method used with 1µA and 10µA current applied in PBS solution pH value (from 3.0 to 10.0). (E) Chronoamperometry with 0.9 V potential applied electrochemistry method in PBS pH values (from 7.0 to 7.4). (F) Chronopotentiometry electrochemistry method used with 1µA and 10µA current applied in PBS solution pH value (from 7.0 to 7.4).
22 CP measurements were repeated in DMEM in pH values from 7.65-8.05 using the Autolab system (Figure 15A,B).
The sensitivity was 0.032 V/pH (R2 = 0.075) at 1 µA (Figure 15C) and -0.053 V/pH (R2 = 0.95) at
10µA (Figure 15D). Hence, it can be concluded that the best performance is obtained at 10 µA with better sensitivity and regression coefficient above 0.9.
It is important to notice that, in the case of CP at 10 µA in PBS, the voltage increases with the increase in pH, but decreases in cell media, which can be explained due to the different composition of the solutions.
To test if the chloride coating was able to resolve stability in CV readings, new CV experiments were run in the MR with the new electrode configuration. Results are included in Annex 6.
3.2.5. Calibration Curve
CP at 10 µA was chosen as the best method to measure the pH in the EC-MR. To obtain a final calibration curve, the MR was filled with DMEM and the voltage was monitored at pH values from 6.4 to 7.4 in the Autolab (Figure 16A). Experiments were repeated 3 times in two different MRs (Figure 16B). Each MR was able to resolve changes of 0.2 in the pH value, with a sensitivity of -Figure 15 - pHe monitoring outside of the MR. (A) Configuration used in experiments, for DMEM solution. (B) AUTOLAB system used followed by typical chronopotentiometry curve. (D) Chronopotentiometry electrochemistry method used with 1 µA current applied in DMEM solution of pH values (from 7.65 to 8.05). (E) Chronopotentiometry electrochemistry method used with 10 µA current applied in DMEM solution of pH values (from 7.65 to 8.05).
23 equation 3.2 was created:
𝑦 =
1.69−𝑥0.053 (equation 3.2),
where y represents pH value and x represents the potential response in volts.
Also, the chronoamperometry method was tested in the Autolab and PP systems inside the same MR. The method was tested in DMEM to achieve a calibration curve in pH values (from 6.4 to 7.4) (Annex 7). This method was tested because Chronopotentiometry method is not possible to be done in the P.P since it works in Potentiostat way. Further experiments are needed to test if it is reproducible because experiments were done only 1 time.
Figure 16 - pHe monitoring outside of the MR. (A) Configuration used in experiments for calibration curve inside the MR, for DMEM solutions in Autolab system with Chronopotentiometry method. (B) Chronopotentiometry with 10 µA applied current, readings in 2 combined MRs. (C) Chronopotentiometry method with 10 µA applied current, reading in 1 MR. (D) Chronopotentiometry method with 10 µA applied current, reading in 1 MR.
24 A summary with all the CP and CA experiments performed is included in Table 3. Also, the table compromises the sensitivity and R2.
3.3. Cell culture in the micro-reactor
Scaffolds are frequently used to culture cells, due to their ability to allow cell growth, proliferation, and adhesion in a special 3D distribution, providing researchers with a more physiological context for their experiments [73]. MRs containing these 3D scaffolds and matrices show major advantages to traditional cell cultures, but limitations such as oxygen and nutrient diffusion often occurs, influencing cell growth and differentiation [112]. Dynamic cell culture systems can overcome the limitations of oxygen and nutrients supply, also contributing to increased culturing times [112]. The MR designed and fabricated in this thesis was aimed to contain a 3D scaffold under a continuous flow to supply cells with fresh medium.
To demonstrate the ability of the system to culture cells in dynamic conditions, SK-BR-3 breast cancer cells were seeded in the MR at a concentration of 5 E 5 cells/0.5 ml and cultured overnight maintaining a constant media supply at 2 µl/min. 24 h after seeding, the cells were fixed, stained with CK, HER2 and DAPI, and observed under a fluorescence microscope.
Table 3 - Sensitivity and Linear fit value for Chronopotentiometry and Chronoamperometry experiments in Autolab system