A Work Project, presented as part of the requirements for the Award of a Masters Degree in Economics from the Nova – School of Business and Economics.
Determinants of Venture Capital and Private Equity Investments in Renewable Energy Technology
A Cross-Country Study
NADJA MUMELTER, # 518
A project carried out under the supervision of:
Prof. Maria Antonieta Cunha e Sá and
Prof. Paulo M. M. Rodrigues
1
A
BSTRACTThis paper conducts the first econometric analysis of determinants of greentech venture capital (VC) and private equity (PE) investments into renewable energy technology. Renewables are an industry which is still in development. The underlying technologies need to mature to eventually benefit from cost savings due to scale and learning effects. The required funding for energy technology is mainly provided by VC and PE investors. The results suggest that the investment volume can be further increased, if governments ensure a stable investment process from the entrance (eased by a solid R&D base which is funded by governments) to the exit (facilitated by ensuring a stable demand, for example through a CO2 tax or cap). The study further found, that investors are more concerned about the economic situation at the time of disinvestment, rather than the current state. Empirical evidence shows that the growth rate of the real interest rate, the oil price growth and population growth are significant indicators for investment volumes and stable across different setups, while the absolute value is not always.
I) I
NTRODUCTIONScarcity, security and climate change are the three biggest issues of fossil fuel use and all of them are challenged. New editions of political conflicts in Middle East arise on a regular basis and the increase of the Earth’s mean surface temperature is also of global concern. Various projects, also on a supranational basis, such as the Kyoto Protocol, Climate Conferences and the European Emissions Trading System1, just to mention a few, were put in place to reduce the emission of greenhouse gases. Those joint efforts resulted in a push for renewables: in 2011, total global investments increased by 17% to $257 billion.
1
The ETS is an attempt to correct the market failure of the fossil fuel energy market by internalizing the externality which is generated by carbon emissions.
2 This level is 93% above the value of 2007, the year before the global financial crisis (Global Trends in Renewable Energy Investment, 2012). However, renewable energy contributes only 6% to electricity production (see Figure 7 in the appendix) since their production costs are considerably higher2, even if the carbon externality is included. A main source of the costs disparity is the different maturity stages of fossil fuels and renewables. Fossil fuels are at a mature stage of the product life cycle (Duncan, et al., 1998). They have reached acceptance of the market and little investment is needed for further development. Renewables, on the other side, need to develop further their underlying technologies to eventually reach the same maturity level as fossil fuels. At that point, renewables would be produced at the lower bound of the learn cost curve and would also benefit from scale economies (European Commission, 2005), (Rennings, 2000).
The main financing source of technological development in energy is VC and PE, as shown by Figure 3 in the appendix. It follows immediately after the basic research stage, which is usually associated with negative cash flows. In addition to the appropriation issue3 of R&D4 outcomes, this would lead to an under provision of research in the absence of government funding. VC and PE projects pick up the results of the fundamental research, funded by governments and develop those technologies further to the point where they are ready for deployment. At that point, projects are mainly financed by bank loans and public markets which correspond better to the increased financial needs of the project. Without VC and PE funding, most projects would not reach the commercialization stage, leading to
2
See http://www.energyquest.ca.gov/story/chapter17.html for an example of cost comparison.
3
The issue whether the benefits of R&D can be absorbed entirely by the institution financing and/or
conducting the research, or also by other market actors. If free-riding is possible, for example due to a lack of patent protection, there will be a severe dampening of the incentives to conduct R&D.
4
3 tremendous consequences for the development of renewable energies. Figure 1 in the appendix illustrates the above described process. (Randjelovic, et al., 2003), (Teppo, et al., 2006), (Bürer, 2008), (Gompers, et al., 1999).
This funding mechanism has become so important that energy has increased from only 2.5% of total VC investments in 2006 to 25% in 2012. Those levels are expected to triple by 2020 (Lundin). According to an Ernst&Young report (2011), green energy technology will become the dominant VC sector in China, India and Israel5.
Capital is a scarce resource though, especially since the global financial crisis (2008) and the European Sovereign debt crisis which weakened policy support and public funding. Hence, the different financing sources should be allocated to those lifecycle stages where they add most value: VC and PE provide initial funding to high risk technological research but available capital is limited and associated by a high risk premium. As the underlying technologies mature and become ready for deployment, public markets and asset finance become more appropriate.
The purpose of this research work is to contribute to a better understanding of the impact of different financing sources. Looking at determinants of greentech VC and PE across countries allows disentangling the main drivers of those investments. To my knowledge, no other study on this topic has been conducted before.
The paper is organized as follows: Section II provides a definition of green VC and PE, outlines the main research work in this sector and gives an overview of its historical development. Section III presents the estimated model and its results and section IV concludes. Appendix I contains relevant information regarding data collection, variables
5
4 and output tables. Appendix II illustrates the state-of-art of greentech VC and PE graphically and compares investment characteristics of this sample with other studies.
II) T
HEORETICAL BACKGROUND1) Definition of VC and PE
PE provides equity capital to enterprises not quoted on a stock market (EVCA, 2006). In its general meaning, it includes all forms of private investment, from early stage VC to late stage pre-IPO6 investments (Bürer, 2008). VC provides operational funding to different stages of the project development through the acquisition of equity stock. Those investments are traditionally settled in the early and expansion stage of a project (see Figure 1). The indicated average time horizon is around 6 to 8 years (Ghosh, et al., 2010), (Moore, et al., 2004). As Smith et al. (2000) precise, this is, however, strongly dependent on the investment stage. Disinvestment at an appropriate time is crucial for VC and PE funds, but also for the industry overall, as it allows the funds to be reinvested in new projects at a stage where most value can be added (Gilson, et al., 1998). There are five ways to exit the investment (Cumming, et al., 2003): (1) IPO, (2) trade sale (or acquisition), where a larger company acquires the shares of the venture, (3) secondary sale, where the VC sells its share in the company to a third party like a strategic investor or another VC, (4) buyout, where the VC sells its share to the entrepreneurial firm or its management, (5) write-off in case of the venture’s failure.
As compared to other sources of financing, VC investors are characterized by a high degree of involvement in the operational management, namely providing managerial
6
5 how of start-ups and leveraging industry-specific network expertise to ensure a profitable exit (Teppo, et al., 2006).
The combination of VC and PE with renewable energy is commonly known as green VC and PE, including all services and technologies appropriate for reducing the use of natural resources and/or decreasing pollution7 (Balbach, et al., 2009), (Moore, et al., 2004) . Recently, this term has been further differentiated in greentech VC (with focus on green energy technologies (Bürer, 2008)) and cleantech VC (which focuses on clean energy technologies). The latter term includes all low or no pollutants and therefore also nuclear power, while greentech is restricted to renewables. For this reason, greentech VC and PE are the focus of this thesis.
2) Literature Review
Opportunities related to the deregulation of the power market, environmental issues and security concerns have opened the door for VC and PE funds to conquer the energy sector (Moore, et al., 2004). Enkvist et al. (2007) found that 70% of greenhouse gases could be abated with existing technologies. The remaining percentage, however, is dependent on the development of new technologies or improvements of existing technologies. Kortum et
al. (1998) aimed at identifying which financing source could best foster innovation,
measured as applications for patents. The analysis, based on a sample of 20 industries, suggested that VC is the most effective for this purpose, yielding more patent applications than corporate R&D.
7
It includes all investments for increased energy efficiency or reduction of the use of fossil fuels from renewables to distributed generation, energy storage and demand-side management up to transportation.
6 Teppo et al. (2006) conducted a survey among European greentech funds to gain insights on the main factors hindering greentech investment: (1) Risk factors of energy technology investments (related to market adoption, exit opportunities, technology, people, and regulation), (2) perceived returns and (3) the maturity stage of renewable energy. The renewables sector is particularly critical since besides the technological risk, shared by all technology start-ups, it also entails the risk of whether the technology can be deployed at large scale. The lack of pre-established exit-mechanisms to hand over the project, increases the costs and risk of the project significantly (Ghosh, et al., 2010), (Teppo, et al., 2006).
Ghosh et al. (2010) mention the risk-mitigating power of governments in support of the development of exit opportunities. Governments need to ensure long-term, predictable policies which stimulate the demand for green energy, for example through FIT8, reduction of fossil fuel subsidies and export credit insurance for fossil power plants, energy-efficiency standards and an EU9 carbon tax. There are also some other measures, specifically designed for VC: tax incentives for energy efficiency and renewable energy investment, or state guarantees for realized losses in young energy technology companies.
Bürer et al. (2009) assessed the effectiveness of various policies on a sample of 60 European and North-American green VC and PE funds (the results are summarized in Table 3 of the appendix). They found a strong investors’ preference towards FIT, especially in Europe and among funds with high shares of investments in clean energy. They also point out that governments needs to stimulate M&A10 through either regulatory measures
8 Feed-in-tariffs 9 European Union 10
7 or corporate incentives11, for example providing first-mover advantages to incumbent firms. And, finally, the promotion of private-public partnerships helps to either provide support to first commercial testing or to establish competitive pressure on the incumbent.
3) Historical Development
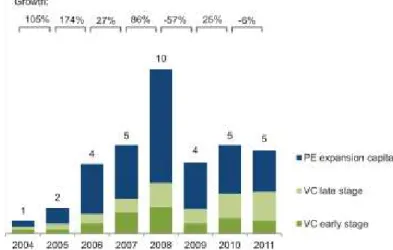
OVERALL INVESTMENTS. VC and PE experienced two- to three- digit growth rates in the years between 2004 and 2008 (see Figure 2 in the appendix). But the global financial crisis has seriously affected investments. Between 2008 and 2009, new investment slumped by 57%. In 2011, the investment level decreased by 6% to $5 billion, but remained above the 2009 level. This decrease is, however, modest, considering that the average share prices decreased by 40%12. The severe dampening of the stock prices affected the most important exit mechanism of VC and PE in the US (and the second most frequent in Europe) severely which contributes to the decreased investment levels. Uncertainty about European energy policy and historically low natural gas prices in the US aggravate the situation further.
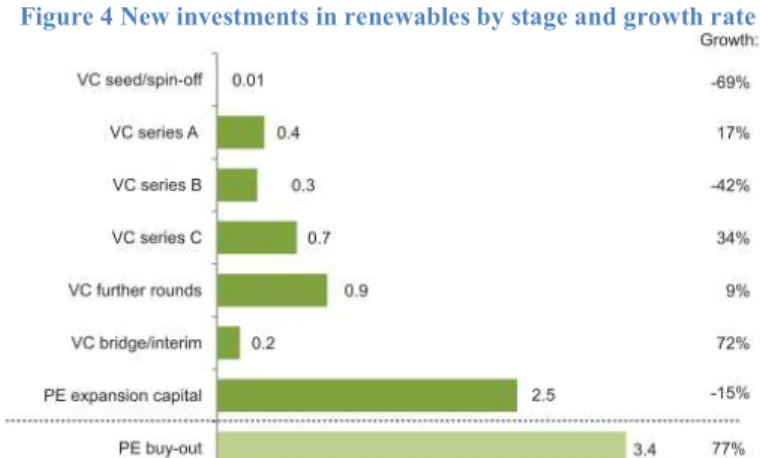
VC VS. PE. Taking a closer look at the investment figures reveals that VC actually
rose by around 5%. Yet, this increase was offset by the decrease in PE investments by around 15%. The two sources have reached the same absolute level of $2.5 billion for the first time. Within VC, a switch towards later stage investments was observed. In fact, it increased by 22% to $1.8 billion, while early-stage investment fell by 21% to $520 billion. The average deal size decreased in both stages (see table 4 in the appendix). Increased risk-aversion by investors due to market volatility, as well as the movement towards higher
11
RPS tend to favor the adoption of more mature (and hence cheaper) technologies, since they push for an immediate change.
12
The WilderHill New Energy Global Innovation Index underperformed severely, while both the S&P500 and Nasdaq ended the year 2011 at similar level of 2010.
8 maturity levels of the largest renewable energy sectors and a subsequent decrease of early-stage projects in those industries may explain the apparent preference for later-early-stage VC investments. Another possibility could be that early-stage investors have been as active as always, but their bargaining power has increased due to the crisis, which has limited available funds. In fact, looking at the number of VC and PE deals undermines the argument: the total number of deals was 241 in 2011, just slightly below the record years of 2008 and 2010, both with 246 registered deals. Figure 2 in the appendix gives a deeper insight into those dynamics. (Global Trends in Renewable Energy Investment, 2012).
SECTORS. The investment levels in solar increased by 13% to $2.4 billion in 2011, the highest level of the post-financial crisis years. Almost half of this value was covered by two large deals: LDK Silicon & Chemical Technology (China, $240 million in PE – expansion capital raised by three Chinese development banks) and Suniva, producer of monocrystalline silicon cells (US, $94 million, VC – series D, fourth round). Although PV13 prices decreased sharply, crystalline PV accounted for 30% of total greentech VC and PE investment. The greatest growth rates were experienced by biomass and waste-to-energy, peaking at 186% ($1 billion). This number is, however, strongly influenced by two large deals: Alinda Capital Partners (Germany, biogas, $445 million, PE – expansion capital) and Plasco Energy (Canada, waste-to-energy, $143 million, PE – expansion capital). Biofuels are the second largest sector, attracting $0.9 billion of new investment (9% more than in the previous year). Wind, which is the largest and most mature renewable sector overall, has negative growth rates in VC and PE new investment (66%), reflecting the natural VC and PE divestment procedures after a given maturity stage has been reached.
13
9 In addition, industry overcapacity induced low equipment prices, reducing the industry attractiveness for technology developers and investors. With $0.5 billion of investment, wind is only at the fourth place for VC and PE. Although the number of deals remained steady, their size decreased drastically14. High growth rates of 73% were also reported by geothermal power, with an absolute value of $0.2 billion, with the total number of deals increasing from 2 to 8. The two smallest sectors, both with negative growth rates, are small hydro and marine power (Global Trends in Renewable Energy Investment, 2012).
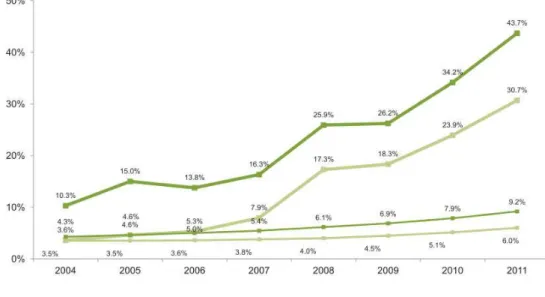
LOCATIONS. The US has consistently been the origin but also destination country with the highest amounts of VC and PE investments. In 2011, however, a decrease of 11% to $2.8 billion was experienced. Europe, the second largest investor, has increased its share by 16% to $924 million. The highest growth rates were experienced by India, jumping by 334% to $332 million (see Figure 5 in the appendix 1 for a historical development chart) (Global Trends in Renewable Energy Investment, 2012).This puts India at the same stage as China (although China had only 6 deals, while India registered 19) and Canada, ahead of most of the European countries (except for Germany, Norway and Italy), (BNEF).
III) D
RIVERS OF GREENTECHVC
ANDPE
1) Theoretical Determinants
The following list provides a summary of relevant variables, as suggested by the literature review. A complete list of variables, sources and units, is reported in table 1 in the appendix. Note that, in addition to absolute values, some of the variables are included as growth rates. The reason is, that at the time of investment, VC and PE investors need to predict future demand and the economic situation at the time of deployment.
14
10
VC AND PE. It includes “all money invested by VC and PE funds in the equity of
companies developing renewable energy technology”15 (Global Trends in Renewable Energy Investment, 2012), thereby following the definition of the BNEF database.
INDICATORS OF ECONOMIC ACTIVITY. Economic activity is expected to have a positive impact on the demand for energy and also on investments in general (Jeng, et al., 2000). The “Environmental Kuznets Curve” (EKC) relates economic development to environmental quality. According to that hypothesis, the two variables have initially a negative relationship but once a certain threshold is overcome, further economic improvement results in increasing environmental quality (Shaf'ik, 1994). This is explained by the switch towards the lower-polluting tertiary sector, international production, outsourcing and increasing means (financial and regulatory) for environmental protection16. There are, however, many authors who criticize those findings. According to Stern (2004)17, the myth of existence of the EKC is based on the fact that middle income countries with high growth rates do actually show evidence of environmental deterioration, whereas in developed countries with moderate growth rates actions undertaken to reduce pollution do show a positive effect. To capture all hypotheses, GDP is included in absolute terms and in growth rates.
15
Similar investments in companies setting up generating capacity through special purpose vehicles are listed under asset financing. Also, VC and PE, as used in this study, refer to VC and PE funds which do not encompass individual private, corporate or government investors.
16
As a confirmation of this statement, the list of IEA member countries does not include emerging countries. A possible reason could be found in the severe access requirements of the entity which include, among others, the necessity for reducing domestic oil consumption by 10% (http://www.iea.org/countries/membercountries/)
17
Stern argues further that econometric inaccuracies led to the assumption of existence of the EKC.
Environmental degradation is not only influenced by economic activity, although it is negatively related to it. Since the environment is mainly damaged by stock pollutants, a representative result requires controlling for time-fixed effects which results in a reduction of environmental degradation at all levels of income.
11
POPULATION. As population increases, increased energy needs have to be satisfied
which requires, given scarcity of fossil fuels, to develop and deploy renewable energies. Another motivation might be that given increased consumption of energy, an increase in the share of renewables in the energy mix is required to maintain emissions relatively constant (Eyraud, et al., 2011). This variable is included in absolute terms as well as a growth rate to measure current demand-side effects (absolute value) and its expected development (growth rate). Population is expected to have a positive influence on the dependent variable.
INNOVATION AND TECHNOLOGY. VC and PE cover mainly the sector of applied
research, which requires a well-established fundamental research sector in first place. R&D expenditure gives a good approximation for that figure which in turn is dependent on the availability of skilled workers (Messins, et al., 2008) (Teppo, et al., 2006). Investments in tertiary education, enrollment in tertiary education, total and government spending in R&D all are expected to push VC and PE investments in renewables.
INTEREST RATES. This variable represents a cost to the company. It is owed to the investors and is interpreted as the opportunity cost of investing, reflecting the scarcity of capital (Alkan, et al., 2006). Two elements compose the interest rate: the interest rate on a low- or no- risk investment (approximated by the rate of return on government bills) and a risk premium. No figures for the latter data are available, as it changes according to fund, investment stage, country and year. The current and the expected growth rate of the interest rate will, however, be a good approximation to how the cost of capital will develop in future, which is crucial for deployment. Renewable energy has proven to be very sensitive to interest rate movements because of its capital-intensive nature and high acquisition costs
12 (Eyraud, et al., 2011). Since investors are remunerated for the whole investment horizon, which usually varies from 2 to 8 years, depending on the project, the nominal and real18 interest rates for 1, 2 and 10 years, as well as their growth rate, are included. The expected relationship is negative.
THE COST OF ALTERNATIVE ENERGY SOURCES. An increase in the price of fossil fuels is
expected to favor a switch to renewable alternatives as the price gap between the two decreases and therefore makes renewables attractive, especially when carbon emissions are either taxed or capped (Eyraud, et al., 2011). To capture all those relationships, variables on fossil fuel prices, such as international oil, relative oil19, coal, and gasoline (as a substitution for biofuel), use of fossil fuel, energy dependency (measured by energy imports), carbon emissions and carbon price are included (Sadorsky, 2012). The current and the expected growth rate of the oil price is also part of some of the estimation setups. All variables are expected to have a positive effect on renewable investments.
FACTORS OF PRODUCTION. If doing business is rendered more difficult (measured by
start-up time, investor protection index, the amount of domestic credit to GDP and the domestic credit designated for the private sector) or more costly (approximated by start-up cost, corporate tax rate and average wage rate), investments in renewables are expected to be dampened.
POLICY VARIABLES. Three variables capturing public support mechanisms to
renewable energy diffusion and correction of market failure have been included:
18
The real interest rate has been constructed following the Minetti et al. approach. Expected inflation is subtracted from government security bills. The expected inflation is calculated as the average inflation (denoted by the GDP deflator) of the current and the three preceding periods.
19
Calculated as the difference between the international oil price and domestic inflation (measured by the GDP Deflator)
13 tariffs (dummy), renewable portfolio standards (dummy) and carbon pricing instruments (categorical variable), following the approach suggested by (Enkvist, et al., 2007).
DETERMINANTS OF VC AND PE. In addition to the classical drivers of investments,
already included previously in this list, the number of IPOs, capturing disinvestment opportunities, accounting standards and labor market rigidities may influence VC and PE investments. While there is no data available on the latter two figures, the first is approximated by the total volume of stock traded and the proportion of it with respect to GDP.
OTHER VARIABLES. Profitability of firms in the industry (attracts investors) and geographical conditions (availability of natural resources) are also expected to have an influence on investment in renewables but have not been included due to data availability constraints.
2) Estimation and Results
The determinants of venture capital and private equity are analyzed on a panel of 21 countries from 2000 to 2011 in annual intervals. All data series, except of interest rates, are expressed in logarithmic terms as well as in real terms taking 2005 as the base year20. The estimated model is as follows:
ݕ௧= ߙ+ ߚ∗ ݔ௧ + ߝ௧
ୀଵ
(1)
In (1), the dependent variable, ݕ௧, represents either the number of deals undertaken, or the total level of investments in renewable energy technologies by venture capitalists and private equity funds. The latter data series suffers from significant data gaps in the early
20
14 years of 2000, which decreases the number of observations. This is not the case when the number of deals is considered since this is public information while the associated value is not. The explanatory variables presented in the previous section are denoted by ݔ௧. The following variables are significant in at least one of the estimation setups: GDP, GDP growth, population growth, fossil fuel prices (relative oil, oil price growth, natural gas), fossil fuel use, real interest rates (2 years growth rate and 10 years), R&D spending (total and public), policy variables (FIT, CO2 pricing instruments, green parties in politics), the share of wind in the energy mix and total wind generation.
The interpretation of ߙ changes according to the estimation method used: The fixed-effect (FE) model considers ߙ to be a regression parameter, whereas the random-effect (RE) model treats it as part of the decomposed error term: ߝ௧ = ܽ+ ߥ௧. The former indicates a country-specific, invariant effect, while the latter accounts for time-dependent variations within a single country. The Hausman test is applied to each regression to identify whether RE or FE methodology is more appropriate. Whenever ߙ and ݔ are correlated, the RE is suspected to yield inconsistent estimators. If this is the case, the FE model is used.
The benchmark equation was required to be both parsimonious and robust to different specifications given the small sample size of the panel. Hence, it only includes four independent variables: GDP, the oil price growth rate, the growth rates of the two year real interest rate and a categorical variable measuring carbon pricing instruments. Some of the variables are lagged once or twice to allow for an appropriate response time of VC and PE investments to changes in exogenous factors. The benchmark model includes 102 observations and has an overall goodness-of-fit of around 64%. This model was subject to
15 several robustness checks in which variables have been substituted or added, time frames have been changed and emerging countries excluded. The output tables in the appendix show that the model generates robust results under the different scenarios considered with respect to sign, magnitude and significance level.
All explanatory variables21 have been tested on their significance in each estimation set-up. Moreover, before running the regressions, all dependent variables were subject to a unit root test. The result is reported in the output table in the appendix. Although not all of the variables are stationary, the panel still yields consistent estimators following Kao (1999) and Philips and Moon (1999). Tests for time-fixed effects (whenever FE estimation was used) and for random effects (whenever RE estimation was used) were also undertaken. The latter test suggested that RE is the appropriate estimator as compared to OLS. According to Baltagi (2008), cross-sectional dependence and serial correlation are not an issue for micro-panels with less than 20 to 30 years of observation. Thus, those tests have not been conducted. Finally, all regressions have been corrected for heteroskedasticity using robust standard errors whenever the p-value seemed to be affected. Following Eyraud
et al. (2011), endogeneity of GDP is not considered to be an issue, since the influence of
VC and PE investments into renewable energy on economic output is considered to be weak, given the small size of this sector.
The output tables are listed in the appendix, the main results are summarized below.
INDICATORS OF ECONOMIC ACTIVITY. The expectation of a positive impact of economic activity on investments has been confirmed. The estimation suggests that a one percent increase in GDP would increase the number of VC and PE deals by around 0.5%
21
16 and has a one-to-one relation to investment volume. If GDP per capita is used, which has to be lagged once to become significant, deals increase by only 0.19%. GDP growth is not significant.
POPULATION. The absolute value of population is not significant, but the population
growth rate has a positive effect on VC and PE deals and investment levels. The reason for this is probably the fact that the future population size (for which the growth rate is an approximation) is more relevant since the capital is invested now but the value of the project depends on future demand. A one percent increase in population growth rate results in a 0.83% increase in the VC and PE deals.
INNOVATION AND TECHNOLOGY. Both, government and total R&D, have a positive
impact on renewable investment, which is consistent with priors. Table 2 in the appendix shows that, following a one percent increase in total R&D investment, VC deals will increase by around 0.3%. This figure is stable, independently of the dependent variable (investment size or deals) considered. The expenditure on tertiary education per capita is not significant. Student’s enrollment to tertiary education, on the contrary, is significant but has only a small effect on investments: a one percent increase would cause the dependent variable to increase by 0.32%. In addition, GDP becomes not significant in this specification while all other coefficients remain stable.
INTEREST RATES. The 2 years real interest growth rate (with one lag) is the most stable measure of interest rates and is therefore used in the benchmark. Its impact on investments in renewables is negative: if the growth rate increases by one percent, the number of deals decreases by around 5% to 6% (20% percent if total investment size is taken as the dependent). The 10 year real interest rate is significant and has a negative
17 impact on GDP. The nominal interest rates and the 10 years real interest growth rate are not significant; the 3 months and 1 year real interest rate are significant only in certain specifications, but unstable. This is consistent with other authors findings, i.e. that the average investment horizon is between 2 and 8 years.22
THE COST OF ALTERNATIVE ENERGY SOURCES. Coal and natural gas (with one lag) are
both significant and have a positive impact on investment levels. Gasoline is found not to be significant and the relative oil price has a negative impact on the dependent variable. The reason is that whenever the oil price increases, the economy needs to switch immediately to alternative energy sources. VC and PE funds invest, mostly, at the technological development stage, but a more mature alternative energy source is needed for immediate production, for example wind. In fact, if a controlling variable for the total energy production by wind or the share of wind in the energy mix is introduced, the relative oil price (with one lag) turns to have a positive impact on the dependent variable. The growth of the oil price is an indicator of future price developments which is crucial for investments in technology. As expected, a one percent increase in this variable causes a 3% to 4% increase in the number of deals financed by VC and PE (and around 6% if the dependent variable is total investment size). Carbon emissions, emissions price and energy dependency are not significant, whereas fossil fuel use is significant with a lag, but has a negative impact on investment levels, unless the share covered by wind in total energy mix is added as a variable (for the same reason as previously explained for oil). Then a positive impact is found.
22
18
FACTORS OF PRODUCTION. Investor protection, start-up time, start-up cost, wage rate
and tax rate are not significant since they are still in development and not yet ready to be deployment. Only few but high-skilled researchers are employed, therefore the average wage rate is less relevant. Greentech projects are usually less capital-intensive then projects involving mature technologies, therefore the two variables measuring the ease of accessing bank credits have no significant impact on investments.
POLICY VARIABLES. Both carbon pricing instruments (with two lags) and
feed-in-tariffs (current and lagged) are significant, but the former proved to be more stable in robustness checks. The reason lies probably in the fact that feed-in-tariffs are designed to be applied at deployment stage, a maturity level not yet reached by the technology on which VC and PE are focused. Therefore, FITs have only a limited impact, (although they secure future demand, reducing the investment risk at all stages) while a tax on emissions or a carbon cap have more immediate consequences on the dependent variables considered. In countries where a cap or tax are in place, greentech VC and PE investments are about 20% larger (and have about 40% more deals). The investment levels are twice this amount in countries practicing both. RPS23 are, however, not significant. They concern more the mature renewable industries.
DETERMINANTS OF VC AND PE. Both the absolute value of stock traded and the share
of stock traded with respect to GDP are highly significant since IPOs are one of the most important exit mechanisms for VC and PE projects. This allows the funds to withdraw their money at the end of the initial high growth phase to invest in new promising projects. If the
23
19 total value of stock traded increases by 1%, the number of deals rises by 0.24% and the value of investments by 0.63%, approximately.
SUMMING-UP. The study found evidence that GDP, population growth, R&D, oil
price (but also coal and natural gas) all have a positive impact on VC and PE. So do caps and carbon taxes and, to a less robust extent, FIT. The interest rate has a dampening effect on investment levels. Some variables enter the equation as growth rates, instead of absolute values, since VC and PE must take expectations of the economic state at the time of commercialization of the technologies currently under development into account. This fact highlights an important difference with other studies, for example Eyraud et al. (2011) who found the interest rate and the oil price to be significant in absolute terms only, although the same set of variables, time frame and countries (which are more than the countries analyzed in this study) were analyzed. The difference is that the latter study analyzed the determinants of overall investment levels24 in renewables and not only VC and PE.
IV) C
ONCLUSIONThis paper contributes to the literature by conducting the first empirical analysis of the main drivers of greentech VC and PE. Those investments are responsible for developing renewable energy technology and are therefore crucial for bringing renewable energy to a competitive level with respect to fossil fuels. It is crucial that policy makers are aware of how to channel and attract those investments. Regulation must ensure a well-functioning investment environment with appropriate entry and exit opportunities for investors since an interruption in the innovation pipeline would prevent the majority of projects from reaching the commercialization stage.
24
This is, according to BNEF, asset finance, small-scale projects, public markets, VC and PE, R&D and M&A.
20 The results suggest that greentech VC and PE are very sensitive to public policy. Although macroeconomic factors such as GDP, GDP growth, real interest (growth) rates and population growth have an undeniable influence, they are hardly influenced in the short or medium term. Public policy can, however, actively influence investment levels through public spending on R&D which provides the basis for further technological development as well as through the application of FIT, to guarantee stable future demand. Greentech VC and PE investment are also pushed by price increases in fossil fuels. The more the negative externality is internalized, the more renewable energy becomes competitive. In fact, carbon pricing mechanisms, such as taxes and tradable permits address exactly this issue and are highly significant in this analysis.
As opposed to other works, studying the determinants of overall investments in renewables25, this study found evidence that VC and PE investments are a special kind. They are more responsive to indicators of the future development of the economic situation and demand, which is captured by growth rates. The current level of those indicators, measured in absolute terms, is often not significant or less stable, for example looking at population, the real interest rate or the oil price.
Given the different regulatory setup and entrepreneurial culture in the US, European countries and emerging markets, it would be interesting to analyze those regions using different panels. However, this is not yet possible due to lack of data. Therefore, this will be left for future research.
25
21
V) R
EFERENCESAlkan Senem and Bonini Stefano, The Macro and Political Determinants of Venture
Capital Investments around the World (2006), Università Commerciale Luigi Bocconi.
Balbach John K. et al., Leading VCs on analyzing greentech market opportunities,
evaluating investment potential and risks, and predicting the future for green investment,
article in Green Venture Capital (2009), Thompson/Aspatore.
Baltagi Badi H., Econometric Analysis of Panel Data (2008),John Wiley & Sons. Bürer Mary Jean, Public Policy and Clean Energy Private Equity Investment (2008), Dissertation no. 3421, Graduate School of Business Administration, Law and Social Sciences ; University of St. Gallen.
Bürer Mary Jean and Wüstenhagen Rolf, Which renewable energy policy is a venture
capitalist’s best friend? Empirical evidence from a survey of international cleantech investors (2009), Environmental Policy, Elsevier, pp. 4997–5006.
Cumming Douglas and MacIntosh Jeffrey G, A cross-country comparison of full and
partial venture capital exits (2003), Journal of Banking and Finance, pp. 511-548.
Deloitte, Global trends in venture capital (2009).
Duncan Richard C. and Youngquist Walter, The world petroleum life-cycle (1998), Series of Studies on the World Oil Forecasting Program, Petroleum Technology Transfer Council, Petroleum Engineering Program, Los Angeles, University of Southern California.
Enkvist Per-Anders, Nauclér Tomas and Rosander Jerker, A cost curve for greenhouse gas
reductions (2007), McKinsey Quarterly 5, No. 1.
Ernst&Young, Globalizing Venture Capital, global venture capital insights and trends (2011).
European Commission, The support of electricity from renewable energy sources:
Communication from the Commission (2005), Brussels, No. 627 (final).
EVCA, Annual Survey of Pan-European Private Equity & Venture (2006), Yearbook. Eyraud Luc et al., Who's going green and why? Trends and Determinants of Green
Investment (2011), Working Paper 11/269 / Fiscal Affairs Department; IMF.
Ghosh Shikhar and Nanda Ramana, Venture Capital Investment in the Clean Energy Sector (2010), Working Paper 11-020 / Harvard Business School.
Gilson Ronald J. and Black Bernard S., Venture capital and the structure of capital
markets: banks versus stock markets (1998), Journal of Financial Economics (47), pp. 243–
277.
Global Trends in Renewable Energy Investment (2012), Frankfurt School of Finance and
Management, UNEP Collaborating Centre for Climate Change & Sustainable Energy Finance, Bloomberg New Energy Finance.
22 Jeng Leslie A. and Wells Philippe C., The Determinants of Venture Capital Funding:
Evidence Accross Countries (2000), Journal of Corporate Finance 6(3), pp. 241–289.
Kao Chihwa, Spurious regression and residual-based tests for cointegration in panel data (1999), Journal of Econometrics 90, pp. 1-44.
Kasemir Bernd, Toth Ferenc and Masing Vanessa, Climate policy, venture capital and
European integration (2000), Journal of Common Market Studies, 38(5), pp. 891-903.
Kortum Samuel S. and Lerner Josh, Does Venture Capital Spur Innovation? (1998), Working Paper 6846, National Bureau of Economic Research.
Lundin Barbara Vergetis, VC funding heats up in renewable energy market.
Messins George and Abdullahi Ahmed, Valuable skills, human capital and technology
diffusion (2008), Working Paper No. 38, Centre for Strategic Economic Studies ; Victoria
University, Melbourne .
Minetti Raoul and Peng Tao, Lending constraints, real estate prices and business cycles in
emerging economies, Journal of Economic Dynamics and Control.
Moore Bill and Wüstenhagen Rolf, Innovative and Sustainable Energy Technologies: The
Role of Venture Capital (2004), Business Strategy and Environment 13, pp.235–245,
Published online in Wiley InterScience (www.interscience.wiley.com).
Philips Peter C.B. and Moon Hyungsik R., Nonstationary Panel Sata Analysis: An
Overview of Some Recent Developments (1999), Cowles Foundation for Research in
Economics, Yale University, Discussion Paper Nr. 1221.
Randjelovic Jelena, O’Rourke Anastasia A. and Orsato Renato J., The Emergence of Green
Venture Capital (2003), Business Strategy and the Environment 12, pp. 240-253.
Rennings Klaus, Redefining innovation: eco-innovation research and the contribution from
ecological economics (2000), Ecological Economics 32, pp. 319-332.
Rudolph Bernd, Venture Capital und Private Equity als Finanzierungs- und
Anlageinstrumente (2001), Handbuch Europäischer Kapitalmarkt, Buchverf. Hummel
Detlev and Breuer Rolf E., Wiesbaden.
Sadorsky Perry, Modeling renewable energy company risk (2012), Energy Policy, Elsevier, 40, pp. 39-48.
Shaf'ik Nemat, Economic Development and Environmental Quality (1994), Oxford Journal, Oxford University Press, Special Issue on Environmental Economics 46, pp. 757-773. Smith Richard L. and Kiholm Smith Janet, Entrepreneurial Finance (2000), New York Wiley.
Stern David I., The Rise and Fall of the Environmental Kuznet Curve (2004), World Development 8, Elsevier, pp. 1419-1439.
Teppo Tarja and Wüstenhagen Rolf, Do venture capitalists really invest in good
instustries? Risk-return perceptions and path dependence in the emergent European energy market (2006), J. Technology Management 34, pp. 63-87.
23 Timmons Jeffrey and Spinelli Stephen, New venture creation (1999), New York, Irwin– McGraw-Hill.
Tykova Tereza, Venture capital in Germany and its impact on innovation (2000), Athens, Paper presented at the 2000 EFMA Conference.
Zider Bob, How Venture Capital works (1998), Harvard Business Review 76(6), pp. 131-140.
VI) A
PPENDIXI
1) Data
The 21 countries considered in the work project were chosen on the basis of data availability and include the following: US, China, Germany, Norway, Canada, India, Italy, Sweden, Australia, Brazil, France, Denmark, Japan, Taiwan, Spain, Belgium, Israel, Singapore, UK, Netherlands, Switzerland, Finland. The renewable sectors included are biofuels, biomass and waste-to-energy, geothermal, marine, small hydro, solar, wind. All those projects with a generation capacity of more than 1 MW have been considered, for hydropower all those, between 1 MW and 50 MW, for biofuel, all projects above one million liters per year. The investment stages taken into consideration are VC – seed/angel, VC – Series A (first round) to VC – Series D (fourth round), VC – tech or early spin-off, VC – bridge/interim, VC – further/pre-IPO round, PE – expansion capital, PE – buy-out/corporate spinoff.
24
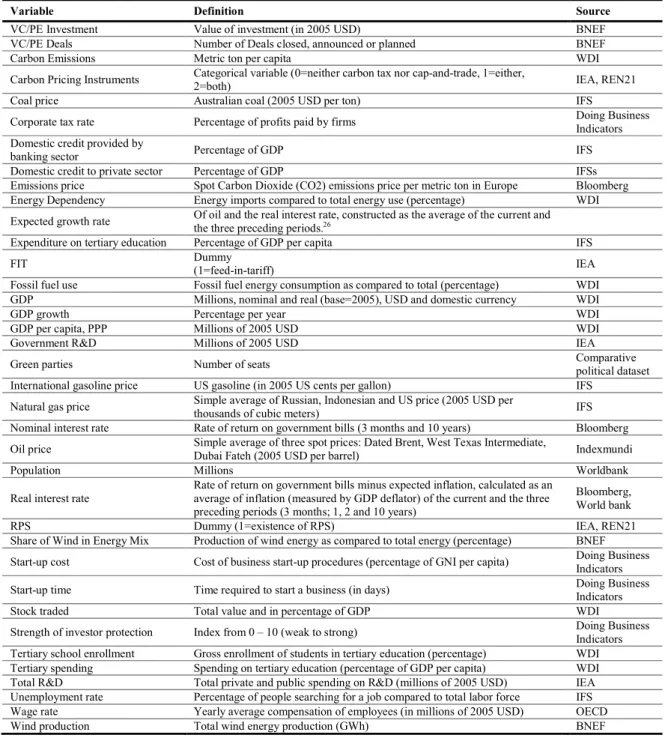
Table 1 Variable List
Variable Definition Source
VC/PE Investment Value of investment (in 2005 USD) BNEF VC/PE Deals Number of Deals closed, announced or planned BNEF
Carbon Emissions Metric ton per capita WDI
Carbon Pricing Instruments Categorical variable (0=neither carbon tax nor cap-and-trade, 1=either, 2=both) IEA, REN21
Coal price Australian coal (2005 USD per ton) IFS
Corporate tax rate Percentage of profits paid by firms Doing Business Indicators Domestic credit provided by
banking sector Percentage of GDP IFS
Domestic credit to private sector Percentage of GDP IFSs Emissions price Spot Carbon Dioxide (CO2) emissions price per metric ton in Europe Bloomberg Energy Dependency Energy imports compared to total energy use (percentage) WDI Expected growth rate Of oil and the real interest rate, constructed as the average of the current and the three preceding periods.26 Expenditure on tertiary education Percentage of GDP per capita IFS
FIT Dummy
(1=feed-in-tariff) IEA
Fossil fuel use Fossil fuel energy consumption as compared to total (percentage) WDI GDP Millions, nominal and real (base=2005), USD and domestic currency WDI
GDP growth Percentage per year WDI
GDP per capita, PPP Millions of 2005 USD WDI
Government R&D Millions of 2005 USD IEA
Green parties Number of seats Comparative political dataset International gasoline price US gasoline (in 2005 US cents per gallon) IFS
Natural gas price Simple average of Russian, Indonesian and US price (2005 USD per
thousands of cubic meters) IFS
Nominal interest rate Rate of return on government bills (3 months and 10 years) Bloomberg Oil price Simple average of three spot prices: Dated Brent, West Texas Intermediate, Dubai Fateh (2005 USD per barrel) Indexmundi
Population Millions Worldbank
Real interest rate
Rate of return on government bills minus expected inflation, calculated as an average of inflation (measured by GDP deflator) of the current and the three preceding periods (3 months; 1, 2 and 10 years)
Bloomberg, World bank
RPS Dummy (1=existence of RPS) IEA, REN21
Share of Wind in Energy Mix Production of wind energy as compared to total energy (percentage) BNEF Start-up cost Cost of business start-up procedures (percentage of GNI per capita) Doing Business
Indicators Start-up time Time required to start a business (in days) Doing Business Indicators Stock traded Total value and in percentage of GDP WDI
Strength of investor protection Index from 0 – 10 (weak to strong) Doing Business Indicators Tertiary school enrollment Gross enrollment of students in tertiary education (percentage) WDI Tertiary spending Spending on tertiary education (percentage of GDP per capita) WDI Total R&D Total private and public spending on R&D (millions of 2005 USD) IEA Unemployment rate Percentage of people searching for a job compared to total labor force IFS Wage rate Yearly average compensation of employees (in millions of 2005 USD) OECD Wind production Total wind energy production (GWh) BNEF
26
25
2) Output tables
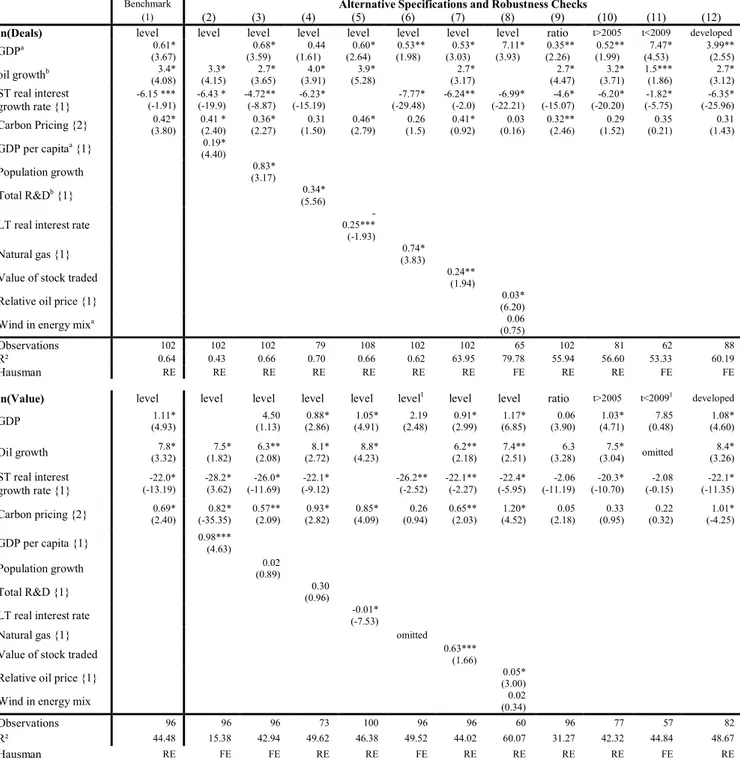
Table 2 Estimation Results
Benchmark Alternative Specifications and Robustness Checks
(1) (2) (3) (4) (5) (6) (7) (8) (9) (10) (11) (12)
ln(Deals) level level level level level level level level ratio t>2005 t<2009 developed
GDPa 0.61* (3.67) 0.68* (3.59) 0.44 (1.61) 0.60* (2.64) 0.53** (1.98) 0.53* (3.03) 7.11* (3.93) 0.35** (2.26) 0.52** (1.99) 7.47* (4.53) 3.99** (2.55) oil growthb 3.4* (4.08) 3.3* (4.15) 2.7* (3.65) 4.0* (3.91) 3.9* (5.28) 2.7* (3.17) 2.7* (4.47) 3.2* (3.71) 1.5*** (1.86) 2.7* (3.12) ST real interest growth rate {1} -6.15 *** (-1.91) -6.43 * (-19.9) -4.72** (-8.87) -6.23* (-15.19) -7.77* (-29.48) -6.24** (-2.0) -6.99* (-22.21) -4.6* (-15.07) -6.20* (-20.20) -1.82* (-5.75) -6.35* (-25.96) Carbon Pricing {2} (3.80) 0.42* 0.41 * (2.40) (2.27) 0.36* (1.50) 0.31 (2.79) 0.46* (1.5) 0.26 (0.92) 0.41* (0.16) 0.03 0.32** (2.46) (1.52) 0.29 (0.21) 0.35 (1.43) 0.31 GDP per capitaa {1} 0.19* (4.40) Population growth (3.17) 0.83* Total R&Db {1} 0.34* (5.56)
LT real interest rate
-0.25***
(-1.93)
Natural gas {1} (3.83) 0.74*
Value of stock traded 0.24** (1.94)
Relative oil price {1} (6.20) 0.03*
Wind in energy mixa 0.06
(0.75)
Observations 102 102 102 79 108 102 102 65 102 81 62 88 R² 0.64 0.43 0.66 0.70 0.66 0.62 63.95 79.78 55.94 56.60 53.33 60.19
Hausman RE RE RE RE RE RE RE FE RE RE FE FE
ln(Value) level level level level level level1 level level ratio t>2005 t<20091 developed
GDP (4.93) 1.11* (1.13) 4.50 (2.86) 0.88* (4.91) 1.05* (2.48) 2.19 (2.99) 0.91* (6.85) 1.17* (3.90) 0.06 (4.71) 1.03* (0.48) 7.85 (4.60) 1.08*
Oil growth (3.32) 7.8* (1.82) 7.5* (2.08) 6.3** (2.72) 8.1* (4.23) 8.8* (2.18) 6.2** (2.51) 7.4** (3.28) 6.3 (3.04) 7.5* omitted 8.4* (3.26) ST real interest growth rate {1} -22.0* (-13.19) -28.2* (3.62) -26.0* (-11.69) -22.1* (-9.12) -26.2** (-2.52) -22.1** (-2.27) -22.4* (-5.95) -2.06 (-11.19) -20.3* (-10.70) -2.08 (-0.15) -22.1* (-11.35) Carbon pricing {2} (2.40) 0.69* (-35.35) 0.82* 0.57** (2.09) (2.82) 0.93* (4.09) 0.85* (0.94) 0.26 0.65** (2.03) (4.52) 1.20* (2.18) 0.05 (0.95) 0.33 (0.32) 0.22 (-4.25) 1.01* GDP per capita {1} 0.98*** (4.63) Population growth (0.89) 0.02 Total R&D {1} (0.96) 0.30 LT real interest rate (-7.53) -0.01*
Natural gas {1} omitted
Value of stock traded 0.63*** (1.66)
Relative oil price {1} (3.00) 0.05*
Wind in energy mix (0.34) 0.02
Observations 96 96 96 73 100 96 96 60 96 77 57 82
R² 44.48 15.38 42.94 49.62 46.38 49.52 44.02 60.07 31.27 42.32 44.84 48.67
Hausman RE FE FE RE RE FE RE RE RE RE FE RE
Note: All coefficients converted to percent. T-statistics in parenthesis, *(**,***) = significant at 1% (5%,10%) level, 1 = a
time dummy has been included to correct for time-fixed effects, a = non-stationary, b = trend stationary. Number of lags in
curly brackets. The Westerlund error-correction-based panel cointegration test could establish a cointegrating relationship between GDP, oil growth and wind in energy mix. The test could not be applied to R&D expenses, since this data series is discontinuous.
A Work Project, presented as part of the requirements for the Award of a Masters Degree in Economics from the Nova – School of Business and Economics.
Determinants of Venture Capital and Private Equity Investments in Renewable Energy Technology
A Cross-Country Study
APPENDIX
NADJA MUMELTER, # 518
A project carried out under the supervision of:
Prof. Maria Antonieta Cunha e Sá and
Prof. Paulo M. M. Rodrigues
i
VII)
A
PPENDIXII
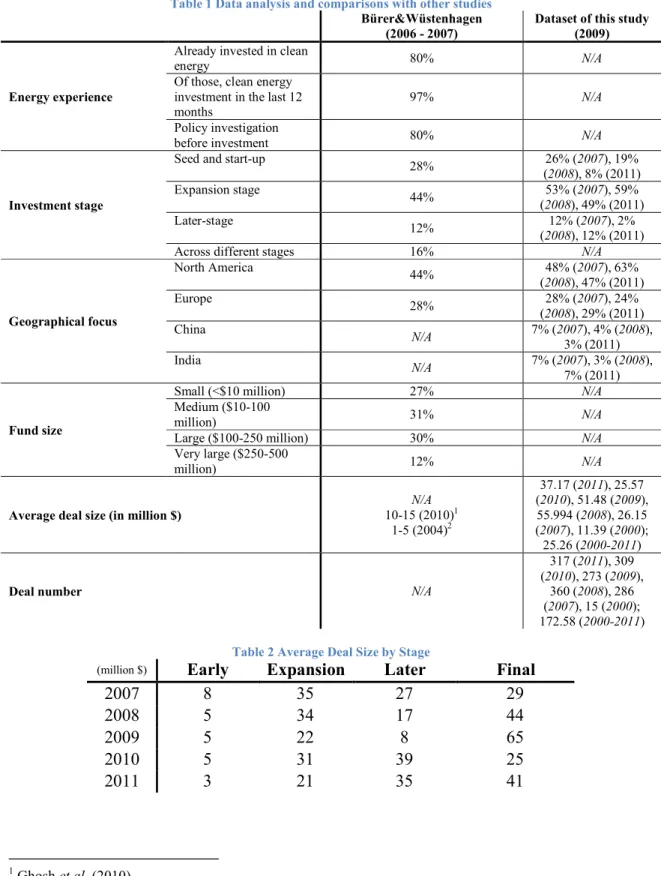
Table 1 Data analysis and comparisons with other studies
Bürer&Wüstenhagen (2006 - 2007)
Dataset of this study (2009)
Energy experience
Already invested in clean
energy 80% N/A
Of those, clean energy investment in the last 12 months
97% N/A
Policy investigation
before investment 80% N/A
Investment stage
Seed and start-up
28% 26% (2007), 19% (2008), 8% (2011) Expansion stage 44% 53% (2007), 59% (2008), 49% (2011) Later-stage 12% 12% (2007), 2% (2008), 12% (2011)
Across different stages 16% N/A
Geographical focus North America 44% 48% (2007), 63% (2008), 47% (2011) Europe 28% 28% (2007), 24% (2008), 29% (2011) China N/A 7% (2007), 4% (2008), 3% (2011) India N/A 7% (2007), 3% (2008), 7% (2011) Fund size
Small (<$10 million) 27% N/A
Medium ($10-100
million) 31% N/A
Large ($100-250 million) 30% N/A
Very large ($250-500
million) 12% N/A
Average deal size (in million $)
N/A 10-15 (2010)1 1-5 (2004)2 37.17 (2011), 25.57 (2010), 51.48 (2009), 55.994 (2008), 26.15 (2007), 11.39 (2000); 25.26 (2000-2011)
Deal number N/A
317 (2011), 309 (2010), 273 (2009),
360 (2008), 286 (2007), 15 (2000); 172.58 (2000-2011) Table 2 Average Deal Size by Stage
(million $) Early Expansion Later Final
2007 8 35 27 29 2008 5 34 17 44 2009 5 22 8 65 2010 5 31 39 25 2011 3 21 35 41 1 Ghosh et al. (2010) 2 Moore et al. (2004)
ii
1) Graphs
Figure 1 The investment chain and various stages
Source: Rudolph (2001)
Figure 2 VC and PE new investments in renewable energy (in $bn)
Source: BNEF, buy-outs not included, estimated value for undisclosed deals.
Figure 3 Most common finance sources by project stage
iii
Figure 4 New investments in renewables by stage and growth rate
Source: Global Trends in Renewable Energy Investment (2012)
Figure 5 New investments by region
Source: Global Trends in Renewable Energy Investment (2012)
Figure 6 Renewable energy by sector
iv
Figure 7 Power generation and capacity of renewable energy as compared to total energy