Immunophenotypic Aberrations, DNA Content, and Cell Cycle
Analysis of Plasma Cells in Patients with Myeloma
and Monoclonal Gammopathies
Submitted 10/28/00
(Communicated by M. Lichtman, M.D., 11/07/00)
Margarida Lima,
1Maria dos Anjos Teixeira,
1So´nia Fonseca,
1Cristina Gonc¸alves,
1Marisol Guerra,
1Maria Luı´s Queiro´s,
1Ana Helena Santos,
1Anto´nio Coutinho,
1Luciana Pinho,
1Lucı´lia Marques,
1Manuel Cunha,
1Pinto Ribeiro,
1Luciana Xavier,
2Hermı´nia Vieira,
2Pureza Pinto,
2and Benvindo Justic¸a
1ABSTRACT: We describe the immunophenotypic and gross DNA defects in 55 patients with myeloma and 50 patients with monoclonal gammopathy and review the literature on this subject (MedLine, 1994 –2000). Our data confirmed previous reports indicating that in myeloma nearly all marrow plasma cells are abnormal (98.7⫾ 8.1%). In monoclonal gammopathy the fraction of abnormal plasma cells was 35.0 ⫾ 32.8%. In both myeloma and monoclonal gammopathy, the most frequent aberrant phenotypic features consisted of absence of expression of CD19, strong expression of CD56, and decreased intensity of expression of CD38; aberrant expression of CD10, CD20, CD22, or CD28 was observed in less than one-third of myeloma cases. The vast majority of cases had two or more phenotypic aberrations. In the DNA studies, 7% of myeloma cases were biclonal and 93% of cases were monoclonal. In those studies with only one plasma cell mitotic cycle, 37% had normal DNA content and 63% were aneuploid (hyperploid, 61%; hypoploid, 2%). The mean percentages of plasma cells in S- and G2M phases were 4.9⫾ 8.5 and 4.4 ⫾ 6.9%, respectively. Thirty-eight percent of cases had more than 3% of plasma cells in S phase. In monoclonal gammopathy, the DNA index of abnormal plasma cells ranged from 0.89 to 1.30 and the percentage of diploid (31%) and aneuploid (69%) cases was not different from the results found in myeloma. The differences in percentage of abnormal plasma cells in S- (7.4 ⫾ 8.6%) and G2M-phases (2.4 ⫾ 1.7%) in patients with monoclonal gammopathy were not statistically significant. © 2000 Academic Press
Key Words: plasma cells; DNA; immunophenotype; myeloma, monoclonal gammopathy.
INTRODUCTION
Plasma cell dyscrasias comprise a number of
diseases including myeloma and essential
mono-clonal gamopathy (1–5). Essential monomono-clonal
gammopathy or monoclonal gammopathy of
un-known significance, here designated “MG,” is a
term used to designate patients with a monoclonal
protein without other criteria for myeloma,
mac-roglobulinemia, amyloidosis or other
lymphopro-liferative disorder and without other conditions
that may be associated with a secondary
mono-clonal gammopathy (6 –17). Follow-up studies
re-vealed that a large fraction of patients with MG
evolve into myeloma or another
lymphoplasma-cytic disorder. The actuarial probability of
malig-nant transformation is estimated to be around
5–10, 15–20, 25–35, and 30 – 40% at 5, 10 and 20,
and 25 years (11–17). There is no a reliable single
variable to predict this transformation.
Prognostic factors in myeloma are related to
the tumor mass (
2-microglobulin, reactive C
protein and lactic dehydrogenase) and to the
char-acteristics of the myelomatous plasma cells
(plas-Correspondence and reprint requests to Margarida Lima, Servic¸o de Hematologia, Unidade de Citometria, Hospital Geral de Santo Anto´nio, Rua D Manuel II, s/n, 4050 Porto, Portugal. Fax: 351-22-6004808. E-mail: [email protected] or [email protected].
1Service of Clinical Hematology, Unit of Flow Cytometry, Hospital Geral de Santo Anto´nio, Porto, Portugal. 2Service of Clinical Hematology, Centro Hospitalar de Vila Nova de Gaia, Vila Nova de Gaia, Portugal.
1079-9796/00 $35.00 Copyright©2000 by Academic Press All rights of reproduction in any form reserved
mablastic morphology), effects on normal
hema-topoiesis (cytopenias), renal function (creatinine),
the performance status, and response the to
treat-ment (18 –32). Some of these factors were
iden-tified more than two decades ago and were used in
classical staging schemas (18 –24). Other
vari-ables, including
2-microglobulin, reactive C
protein, interleukin 6 (IL 6), IL 6 receptor and
aminopterine were described more recently (25–
32). Plasma cell labeling-index (LI) and Ki-67
proliferation index were also described as
vari-ables useful in discriminating between myeloma
and MG and to distinguish myeloma cases with
poor prognosis from stable myeloma patients
re-quiring no immediate therapy (33– 41).
Difficul-ties in implementing these assays for the clinical
laboratory have limited their usefulness. DNA
analysis and immunophenotypic studies are now
more available. Phenotypic and DNA
abnormali-ties proved to be useful in predicting the clinical
aggressiveness and response to therapy (42, 43) as
well as in distinguishing between MG and
my-eloma (44, 45). Other variables that may improve
accuracy in predicting both progression of MG
and prognosis of myeloma patients are
cytoge-netic abnormalities (46 –52), activation of
onco-genes or inactivation of tumor suppressor onco-genes
(53–57), imbalance between apoptosis-suppressor
and -inducer proteins (58, 59) and multidrug
re-sistance gene expression (41, 60, 61).
We describe the major phenotypic and DNA
aberrations found in a series of 55 patients with
untreated myeloma and 50 patients with MG and
evaluate the value of plasma cell phenotyping in
establishing the differential diagnosis between these
entities. We also review the literature on this subject
and discuss the biology of plasma cell disorders.
MATERIALS AND METHODS
Patients and Samples
Data presented are derived from 55 patients
with untreated myeloma and 50 patients with MG
studied at the Hospital Geral de Santo Anto´nio,
Porto, Portugal (57 males, 48 females; median age
of 61 years, range 29 –95 years). Marrow samples
were collected into EDTA-K3 and cell
concentra-tion was determined and adjusted with phosphate
buffered saline to give 5–15
⫻ 10
6cells/ml. The
mean percentage of plasma cells was 2.2
⫾ 1.9%
(0.2– 6.0) and 27
⫾ 29% (2–77%) of all nucleated
marrow cells for MG and myeloma, respectively
(mean
⫾ standard deviation,
minimum–maxi-mum). Patients with myeloma had
⬍10, 10–20,
and
⬎20% plasma cells, in 12, 12, and 31 cases,
respectively.
Immunophenotypic Studies
Immunophenotyping was performed in all 55
myeloma patients and in a subset of 40 MG
pa-tients, using a direct immunofluorescence
tech-nique. Briefly, 100
l of whole blood containing
between 0.5 and 2
⫻ 10
6nucleated cells was
incubated for 15 min at room temperature in the
darkness with saturating amounts of the
monoclo-nal antibodies indicated below. Lysis of red blood
cells and fixation of the leukocytes was then
per-formed, processing samples in the Q-Prep
work-station using Immunoprep (Beckmann Coulter,
Miami, FL).
The following three-color panel (FITC/PE/
PE-Cy5) was used in both MG and myeloma:
CD138/CD56/CD38 and CD10/CD19/CD38. In
myeloma two additional staining were performed
in order to better characterize plasma cells: CD20/
CD22/CD38 and CD45/CD28/CD38. The source
of antibodies were as follows: CD19, CD20,
CD22, and CD38 (Beckman Coulter); CD28 and
CD56 (Becton–Dickinson, San Jose´, CA); CD138
(ImmunoQuality Products); and CD45 (Dako
A/S, Glostrup, Denmark).
DNA Studies
DNA studies were performed in 55 patients
with myeloma and in a subset of 27 patients with
MG using a two step- washing method developed
in our laboratory. This method is based on the
use of both FITC-conjugated primary
(antigen-specific) and secondary (anti-immunoglobulin)
antibodies, a strategy that increases the
FITC-signal of CD38-positive cells without an
appre-ciable increase in nonspecific staining. This
pro-cedure obviated difficulties usually imposed by
the decrease of expression of cell surface antigens
when cells are simultaneously stained for DNA
(data not shown). As a first step cells were
incu-bated with 10
l of FITC-conjugated mouse
anti-human CD38 (Cytognos, Salamanca, Spain) for
15 min at room temperature, protected from light,
and washed twice in phosphate-buffered saline.
As a second step 20
l of FITC-conjugated rabbit
anti-mouse immunoglobulins (Dako) was added
and cells were incubated under the same
condi-tions. Once this incubation period was completed,
cells were washed once in buffered saline and
then processed with DNA-Prep either
automati-cally (DNA-Prep workstation) or manually,
ac-cording to the manufacturer’s instructions
(Beck-man Coulter). Briefly, 100
l of DNA Prep LPR
(reagent to lyse red cells and permeabilize cell
membranes) was added and vortexed for 8 s; after
that, 2 ml of DNA-Prep stain (propidium
io-dide–PI solution with RNAse) were added and
vortexed for 10 s. Finally, the samples were
in-cubated at 4°C in the darkness for 15 min before
acquisition.
Data Acquisition and Analysis
Data acquisition was carried out in a
EPICS-XL-MCL flow cytometer (Beckman Coulter)
equipped with a 15-mW air-cooled 488-nm argon
laser, using the XL2 software program (Beckman
Coulter). Instrument alignment and
standardiza-tion were performed daily and electronic
compen-sation was used to remove spectral overlap. A
normal blood sample was processed in parallel
every day and the red fluorescence high voltage
was adjusted to place the mean channel of the
G0/G1 peak of normal blood lymphocytes at the
channel 200
⫾ 10. Information on a minimum of
1.5
⫻ 10
3plasma cells was acquired and stored as
list mode data for each staining.
Immunophenotypic analysis was performed
using the XL2 software (Beckman Coulter).
Briefly, plasma cells were first identified based on
the expression of CD138 antigen and high levels
of expression of CD38; then, normal and
abnor-mal plasma cells were identified and characterized
for the expression of each antigen and the fraction
of each plasma cell population was calculated.
Criteria used for distinguished normal and
abnor-mal plasma cell populations were based on the
expression of CD38, CD19, and CD56 and were
previously described in detail elsewhere (44, 45).
For DNA analysis, cell doublets were
ex-cluded and CD38-brightly positive plasma cells
and CD38-dim normal residual marrow cells were
gated separately in the SSC/CD38 histogram; the
DNA content and cell cycle distribution of each
cell population were analyzed individually using
the Multicycle software (Phoenix Flow Systems,
San Diego, CA). The DNA index was calculated
as the ratio of the modal channel of G0/G1 peak
of the CD38 brightly positive plasma cells and
that of the CD38-dim residual normal marrow cells.
Plasma cells were considered aneuploid when the
DNA index was out of the range 0.95–1.05.
RESULTS
Immunophenotype
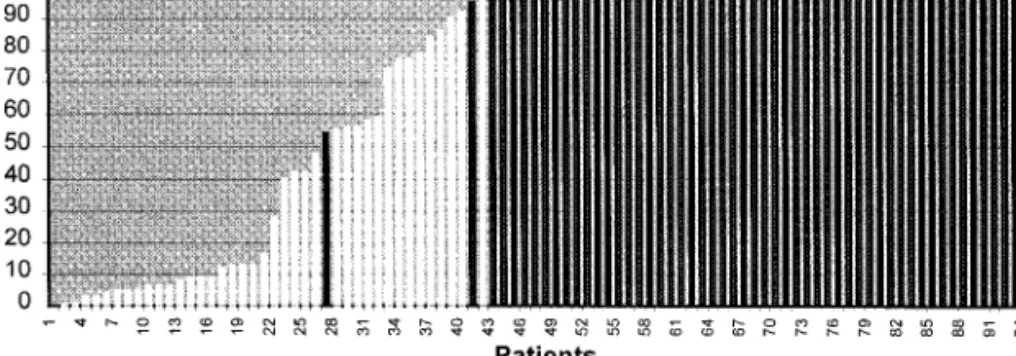
As illustrated in Fig. 1, when all patients with
plasma cell dyscrasias were considered together,
the fraction of BM plasma cells that had an
ab-normal immunophenotype was highly variable
ranging from 0 to 100%.
In patients with MG, a large fraction of
mar-row plasma cells had a normal
immunopheno-type. Indeed, the fraction of abnormal plasma
cells was only 35.0
⫾ 32.8 (0.0–96.0) and was
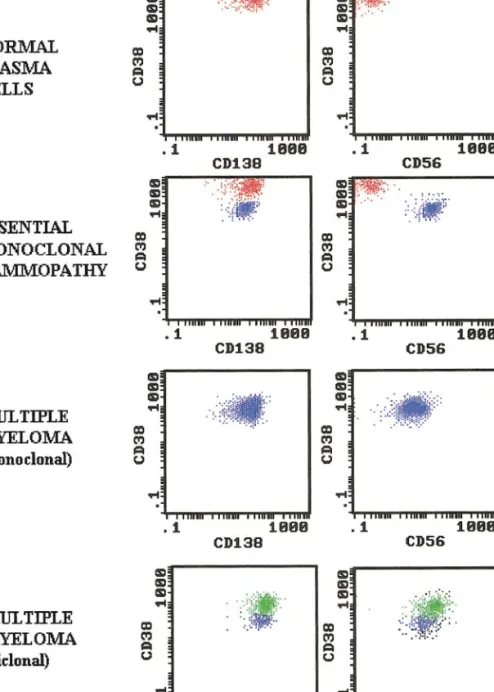
greater than 95% in only 1 case. The typical
phenotypic features observed in MG are shown in
Fig. 2. Absence of expression of CD19 (100%)
and strong expression of CD56 (90%) together
with a decreased expression of CD38, were the
most important phenotypic features in
distin-guishing the abnormal plasma cell population.
Abnormal plasma cells usually had a slightly
higher size and granularity, as evaluated by
for-ward-scatter and side-scatter, respectively (data
not shown). In the only case in which abnormal
plasma cells were not detected in the BM, B-cells
were monoclonal, although there were neither
clinical nor other laboratory criteria for the
diag-nosis of a B-cell lymphoproliferative disorder.
FIG. 2. Illustrative dot plots showing normal plasma cells (red dots) and abnormal plasma cells (blue dots) in marrow
In contrast to that observed in MG, abnormal
plasma cells comprised 98.7
⫾ 8.1% (40–100%)
of total marrow plasma cell in myeloma patients,
only one case having less than 95% of abnormal
plasma cells. Illustrative examples of monoclonal
and biclonal myeloma cases are shown in Fig. 2.
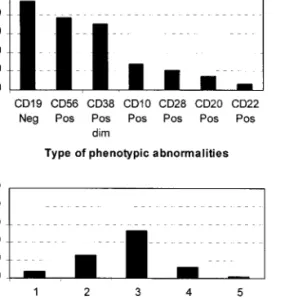
As in MG, the most frequent phenotypic
aberra-tions were the absence of expression of CD19
(94%), the expression of CD56 (77%) and
de-creased expression of CD38 (70%) (Fig. 3A).
Other phenotypic abnormalities occurred less
fre-quently and included: expression of CD10 (28%);
expression of CD28 (21%); expression of CD20
(15%) and expression of CD22 (6%). As shown in
Fig. 3B, the vast majority of cases (93%) had two
or more aberrant immunophenotypic features. In
two cases two different abnormal plasma cell
pop-ulations were identified.
DNA Content and Cell Cycle Distribution
From a total of 27 cases of MG in which DNA
analysis was performed, 18 cases had
immuno-phenotypic studies whereas the remaining nine
cases did not. Information on DNA content and
cell cycle distribution of abnormal plasma cells
was conclusive in only 16 of 27 cases analyzed. In
the remaining 11 cases it was not possible to
distinguish an abnormal plasma cell cycle from
the normal one. These cases were: seven cases in
which the fraction of phenotypically abnormal
plasma cells was very low (less than 10% of
plasma cells), in which only a diploid cell cycle
was observed, and four cases in which
immuno-phenotypic studies were not available and only
one diploid cell cycle was observed. In 27 MG
cases studied the DNA index ranged from 0.89 –
1.30 (1.07
⫾ 0.10) and the cell cycle distribution
was as follows: G0/G1 phases 91.2
⫾ 8.4%
(68.2–100.0), S phase 6.1
⫾ 7.0% (0.0–25.2) and
G2/M phases 2.7
⫾ 2.8 (0.0–13.2). If only the
cell cycles that corresponded were considered,
abnormal plasma cells the following values
were obtained: G0/G1 phases 90.2
⫾ 9.6%
(68.3–97.8%), S phase 7.4
⫾ 8.6 (0.0–25.2) and
G2/M phases 2.4
⫾ 1.7 (0.0–6.5). In this case
DNA index ranged from 0.89 to 1.30 (1.09
⫾
0.13) five cases had a normal DNA content and 11
were aneuploid (10 hyperploid and 1 hypoploid).
In cases classified as aneuploid, two plasma cells
cycles were simultaneously identified: one,
aneu-ploid, corresponding to the abnormal plasma cells
and the other, diploid, corresponding to residual
normal plasma cells.
Normal residual marrow cells had the
follow-ing cell cycle distribution: G0/G1 phases 88.3
⫾
5.0% (77.7–98.8%), S phase 9.4
⫾ 4.2% (1.1–
18.4%) and G2/M phases 1.7
⫾ 0.9% (0.0–3.9%).
In patients with myeloma, the DNA index of
the abnormal plasma cell population ranged from
0.78 to 1.54%. Four cases (7%) were biclonal
(two of them corresponding to those being also
classified as biclonal based on
immunophenotyp-ing) and 51 cases (93%) monoclonal. Of those
cases having only one plasma cell cycle, 19 (37%)
had an normal DNA content, whereas the
remain-ing were aneuploid (hyperploid, 31 cases (61%);
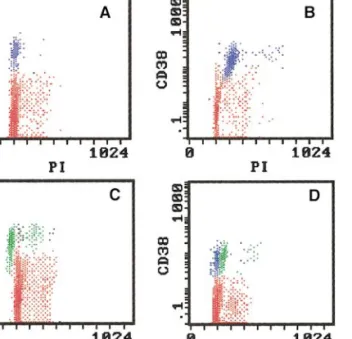
hypoploid, 1 case (2%). Illustrative PI/CD38 dot
plots of normal marrow plasma cells and diploid,
hyperploid, hypoploid and biclonal myelomatous
plasma cells are show in Fig. 4. Cell cycle
distri-bution was as follows: G0/G1 phases 90.2
⫾
13.9% (12.1–98.8%), S phase 4.9
⫾ 8.5%
(0.0 – 46.5%) and G2/M phases 4.4
⫾ 6.9% (0.0–
50.0%). Thirty eight percent of cases had a
per-centage of plasma cells in S phase higher than 3%.
Normal residual marrow cells had cell cycle
distribution similar to that found in MG: G0/G1
FIG. 3. Type (A) and number (B) of phenotypic
phases 90.4
⫾ 5.3% (77.4–99.2%), S phase 7.4 ⫾
4.7% (0.1–19.9%) and G2/M phases 1.9
⫾ 1.3%
(0.0 –5.5%).
DISCUSSION AND REVIEW
OF THE LITERATURE
Immunophenotypic and DNA Abnormalities
of Malignant Plasma Cells
Many studies have focused on the
immuno-phenotypic aberrations of myeloma although
comparative studies with normal marrow plasma
cells are less frequent (62– 67). Expression of
CD138 and very strong reactivity for CD38 are
the best markers for identifying myelomatous as
well as normal plasma cells (68 –71). Aberrant
immunophenotypic features are frequent in
my-elomatous plasma cells and the frequency of each
abnormality has been similar to that found in this
series. Normal and myelomatous plasma cells
usually do not express CD45 although some
cases, especially those with a more immature
morphology, may be CD45-positive (63, 67, 69,
72–74). Myelomatous plasma cells usually do not
express CD19, whereas normal plasma cells do
(66, 75, 76). Malignant plasma cells may express
other B-cell associated markers that are usually
negative in normal plasma cells, such as CD20,
CD21 and CD22 (63, 67, 69, 72–75). In contrast
to normal, myelomatous plasma cells are usually
strongly positive for CD56, although they may
not express other natural killer associated
mark-ers, including CD16 and/or CD57 (75, 77).
My-elomatous plasma cells do not express CD34 (78,
79), whereas CD117 is expressed on cells in
nearly one third of myeloma cases (80). A
con-siderable fraction of myelomatous plasma cells
express CD10 (81, 82), CD28 (83, 84), and CD40
(83, 85), and in a minor fraction of patients
my-elomatous plasma cells also express markers that
have been associated to the myelomonocytic,
ery-throid, and megakaryocytic lineages, such as
CD13, CD14, CD15, and CD33 (72, 86 – 88).
Until recently, flow cytometric DNA
quanti-fication and cell cycle analysis were limited by the
fact that most studies were based on single DNA
staining, limiting its application to samples with a
high proportion of plasma cells. Multiparametric
DNA analysis using double staining with
pro-pidium iodide and anti-CD38 overcame this
prob-lem by allowing DNA analysis of plasma cells,
specifically (102, 103). Using a different technical
approach for DNA studies in plasma cells, we
obtained results similar to those reported
previ-ously; the majority of myeloma cases have an
abnormal DNA content and hyperploid cases
pre-dominate over hypoploid (104 –111). The
per-centage of abnormal plasma cells in S phase is not
higher in myeloma than in MG and in both cases
the percent of cells in S phase is lower in plasma
cells than in normal hematopoietic cells (45, 102).
Immunophenotypic and DNA Abnormalities,
Disease Expression, and Prognosis
Adhesion molecules may have an important
role in determining the localization of malignant
plasma cells in the marrow extracellular matrix
and in extramedullary spread (89 –96). Imbalance
of molecules implicated in plasma cell
prolifera-tion—such as CD40 and CD117 (85, 97, 98)—
and of proteins that regulate apoptosis—including
FIG. 4. Illustrative CD38/PI dot plots showing the
DNA content and cell cycle distribution of plasma cells (blue or green dots) and normal residual marrow cells (red dots) in diploid (A), hyperploid (B), hypoploid (C), and biclonal (D) plasma cell disorders.
p26/bcl2 and CD95/Fas (56, 57, 59)—may also be
crucial for plasma cell survival and may be
im-plicated in the pathogenesis of malignant
gam-mopathy by prolonging the survival of plasma
cells and increasing the chance of acquiring
addi-tional gene defects. Some of the antigens
aber-rantly expressed on myelomatous plasma cells
may have prognostic implications and expression
of CD10, CD20, CD28, CD45, myelomonocytic
markers, and surface immunoglobulins correlates
with aggressive biological and clinical
character-istics, as did the absence of expression of CD56
and VLA-5/CD49e (72–74, 77, 81, 83, 84, 89,
99 –101). Disease progression may be
accompa-nied by immunophenotypic changes, such as an
increase of expression of CD28 and CD86 (84).
Expression of proteins associated with multidrug
resistance phenotype may determine
nonrespon-siveness to therapy (41, 61).
Abnormalities in plasma cell DNA content
and cell cycle distribution may also have
impor-tant prognostic implications in myeloma (104 –
112). Survival is significantly longer in
hyper-ploid compared with dihyper-ploid myeloma (45, 109 –
111). Hypoploid or biclonal myeloma apparently
have a worst prognosis and higher resistance to
chemotherapy, when compared to those having a
diploid or a hyperploid DNA content in plasma
cells (107, 108, 111), although some recent data
questioned this finding (112). The percentage of S
phase plasma cells is an independent prognostic
factor in myeloma cases; a high number of S
phase plasma cells (higher than 2 or 3%,
depend-ing on the study) predicts a poor prognosis (113,
114).
Progression of MG to Myeloma
Studies of the phenotypic differences between
MG and myeloma plasma cells (44, 45, 76)
es-tablished that virtually all marrow plasma cells
from patients with myeloma have an abnormal
phenotype, characterized by a slightly lower
re-activity for CD38, strong expression of CD56 and
absence of expression of CD19, in contrast to
normal plasma cells, which are CD38-strongly
positive/CD56-negative/CD19-positive. Patients
with MG have two clearly defined plasma cells
populations, one identical to normal plasma cells
and the other having an immunophenotype similar
to myelomatous plasma cells (44, 45). Our results
support these observations indicating that the
fraction of residual normal plasma cells is a
pow-erful variable to use for the discrimination of MG
and myeloma patients. The fact that MG and
myeloma form a spectrum of plasma cells
disor-ders in which the monoclonal plasma cell
popu-lation progressively occupy the entire plasma cell
pool in marrow might suggest that MG patients
having a higher proportion of abnormal plasma
cells are those with a higher probability of
devel-oping myeloma in a shorter period of time. This
surmise is consistent with transformation to
my-eloma as a multi-step process (115–118). The
state of the B-cell differentiation in which the first
oncogenic event lead to a monoclonal expansion
occurs probably in a mature B-cell that has been
in contact with antigen (119). However, as in the
case of MG, monoclonal plasma cell expansion
occurs without clinical manifestations and
addi-tional mutaaddi-tional events are required in order to
develop clinical features of malignancy. The fact
that MG patients acquire chromosomal changes
gradually within several related plasma cell
sub-clones (120) and that some chromosomal
abnor-malities, such as monosomy 13, are associated
with transition of MG to myeloma also supports
this hypothesis (46, 47). Oncogenes also play a
role in the conversion of MG into myeloma as
well in the proliferation and survival of malignant
plasma cells (53–57). For instance, loss or
inacti-vation of Rb1 and p53 tumor suppressor (54) and
mutational activation of N- and K-ras oncogenes
(55, 57) are frequent findings in myeloma but not
in MG, suggesting that these molecular events
occur late during the process of oncogenesis. Cell
adhesion molecules that mediate interactions
be-tween plasma cells and marrow stroma cells and
stimulate production of cytokines (121–123) may
also be important in this process. IL 6 has a
crucial role in maintaining plasma cell
prolifera-tion (124) whereas IL1
 leads to osteoclast
acti-vation and osteolysis and can increase the
expres-sion of adheexpres-sion molecules and induce IL 6
se-cretion by either autocrine (plasma cells) or
paracrine (stromal cells) mechanisms (125).
An-giogenic cytokines such as vascular endothelial
growth factor and basic fibroblast growth factor
expressed by myeloma cells may also be involved
(126). Recent data also suggest that a virus
(Ka-posi-associated virus–HHV-8) may be associated
with development of myeloma (127). Long-term
follow-up of MG patients will determine if a high
fraction of abnormal plasma cells should be
con-sidered as an index of an imminent transformation
into myeloma.
ACKNOWLEDGMENT
This work was partially supported by a grant from the Comissa˜o de Fomento da Investigac¸a˜o em Cuidados de Sau´de, Ministe´rio da Sau´de, Portugal (PI 52/99).
REFERENCES
1. Seiden, M. V., and Anderson, K. C. (1994) Multiple myeloma. Curr. Opin. Oncol. 6, 41– 49.
2. Kyle, R. A., Durie, B. G., Boccadoro, M., et al. (1994) Myeloma and related disorders. Rev. Invest.
Clin. Suppl., 46 –51.
3. Kyle, R. A. (1990) Multiple myeloma. An update on diagnosis and management. Acta Oncol. 29, 1– 8. 4. Kyle, R. A. (1992) Diagnostic criteria of multiple
myeloma. Hematol. Oncol. Clin. North Am. 6, 347– 358.
5. Kyle, R. A. (1994) The monoclonal gammopathies.
Clin. Chem. 40, 2154 –2161.
6. Blade, J. (1988) Multiple myeloma and idiopathic monoclonal gammapathy. Diagnosis, prognosis and treatment. Med. Clin. 90, 704 –714.
7. Kyle, R. A. (1982) Monoclonal gammopathy of un-determined significance (MGUS): A review. Clin.
Haematol. 11, 123–150.
8. Kyle, R. A. (1987) Monoclonal gammopathy and multiple myeloma in the elderly. Bailliere’s Clin.
Haematol. 1, 533–557.
9. Kyle, R. A., and Lust, J. A. (1989) Monoclonal gammopathies of undetermined significance. Semin.
Hematol. 26, 176 –200.
10. Kyle, R. A. (1989) Monoclonal gammopathy of un-determined significance and smoldering multiple myeloma. Eur. J. Haematol. Suppl. 51, 70 –75. 11. Kyle, R. A. (1990) Benign monoclonal
gammopa-thy—After 20 or 35 years of follow-up. Mayo Clin.
Proc. 68, 26 –36.
12. Kyle, R. A. (1994) Monoclonal gammopathy of un-determined significance. Blood Rev. 8, 135–141. 13. Giraldo, P., Rubio-Felix, D., Cortes, T., et al. (1994)
Incidence, clinico-biological characteristics, and
clinical course of 1,203 monoclonal gammopathies (1971–1992). Sangre 39, 343–350.
14. Kyle, R. A. (1995) Monoclonal gammopathy of un-determined significance (MGUS). Bailliere’s Clin.
Haematol. 8, 761–781.
15. Kyle, R. A. (1996) Monoclonal gammopathy of un-determined significance. Curr. Top. Microbiol.
Im-munol. 210, 375–383.
16. Kyle, R. A. (1997) Monoclonal gammopathy of un-determined significance and solitary plasmacytoma. Implications for progression to overt multiple my-eloma. Hematol. Oncol. Clin. North Am. 11, 71– 87. 17. Kyle, R. A., and Rajkumar, S. V. (1999) Monoclonal gammopathies of undetermined significance.
Hema-tol. Oncol. Clin. North Am. 13, 1181–1202.
18. Alexanian, R., Balcerzak, S., Bonne, J., et al. (1979) Prognostic factors in multiple myeloma. Cancer
36(45), :2344 –2347.
19. Kyle, R. A. (1988) Prognostic factors in multiple myeloma. Hematol. Oncol. 6, 125–130.
20. Rajkumar, S. V., and Greipp, P. R. (1999) Prognostic factors in multiple myeloma. Hematol. Oncol. Clin.
North Am. 13, 1295–1314.
21. Fonseca, R., and Greipp, P. R. (1999) Prognosis in multiple myeloma. Cancer Treat. Res. 99, 155–170. 22. Greipp, P. R., Raymond, N. R., Kyle, R. A., et al. (1985) Multiple myeloma: Significance of plasma-blastic subtype in morphological classification.
Blood 65, 305–310.
23. Greipp, P. R., Leong, T., Bennett, J. M., et al. (1998) Plasmablastic morphology—An independent prog-nostic factor with clinical and laboratory correlates: Eastern Cooperative Oncology Group (ECOG) my-eloma trial E9486 report by the ECOG Mymy-eloma Laboratory Group. Blood 91, 2501–2507.
24. Durie, B. G. M., and Salmon, S. E. (1975) A clinical staging system for multiple myeloma. Correlation of measured myeloma cell mass with presenting clinical features, response to treatment and survival. Cancer
38, 842– 854.
25. Alexanian, R., Barlogie, B., and Frische, H. (1985) Beta-2-microglobulin in multiple myeloma. Am. J.
Haematol. 20, 345.
26. Bataille, R., Grenier, J., and Sany, J. (1984) Beta-2-microglobulin in myeloma: Optimal use for staging, prognosis and treatment. A prospective study of 160 patients. Blood 63, 468 – 476.
27. Garewal, H., Durie, B. G., Kyle, R. A., et al. (1984) Serum beta 2-microglobulin in the initial staging and subsequent monitoring of monoclonal plasma cell disorders. J. Clin. Oncol. 2, 51–57.
28. Greipp, P. R., Katzman, J. A., O’Fallon, M., et al. (1988) Value of B2-microglobulin level and plasma cell labeling indices as prognostic factors in patients with newly diagnosed myeloma. Blood 72, 219 –223.
29. Bataille, R., Jourdan, M., Zhang, X. G., et al. (1989) Serum levels of interleukin 6, a potent myeloma cell growth factor, as a reflex of disease severity in plasma cell dyscrasias. J. Clin. Invest. 84, 2008 – 2011.
30. Reibneggar, G., Krainer, M., Herold, M., et al. (1991) Predictive value of interleukin 6 and neopterin in patients with multiple myeloma. Cancer
Res. 51, 6250 – 6253.
31. Gaillard, J. P., Bataille, R., Brailly, H., et al. (1993) Increased and highly stable levels of functional sol-uble interleukin-6 receptor in sera of patients with monoclonal gammopathy. Eur. J. Immunol. 23, 820 – 824.
32. Boccadoro, M., Battaglio, S., Omede, P., et al. (1991) Increased serum neopterin concentration as indicator of disease severity and poor survival in multiple myeloma. Eur. J. Haematol. 47, 305–309. 33. Durie, B. G., Salmon, S. E., and Moon, T. E. (1980)
Pretreatment tumor mass, cell kinetics, and prognosis in multiple myeloma. Blood 55, 364 –372.
34. Hoffman, W., Salmon, S., and Durie, G. M. (1981) Drug resistance in multiple myeloma associated with high in vitro incorporation of3H-thymidine. Blood
58, 471– 476.
35. Blade, J., Lopez-Guillermo, A., Rozman, C., et al. (1992) Malignant transformation and life expectancy in monoclonal gammopathy of undetermined signif-icance. Br. J. Haematol. 81, 391–394.
36. Greipp, P. R., and Kyle, R. A. (1983) Clinical, mor-phological, and cell kinetic differences among mul-tiple myeloma, monoclonal gammopathy of undeter-mined significance, and smoldering multiple my-eloma. Blood 62, 166 –171.
37. Boccadoro, M., Gavarotti, P., Fossati, G., et al. (1984) Low plasma cell 3(H) thymidine incorpora-tion in monoclonal gammopathy of undetermined significance (MGUS), smouldering myeloma and re-mission phase myeloma: a reliable indicator of pa-tients not requiring therapy. Br. J. Haematol. 58, 689 – 696.
38. Boccadoro, M., Massaia, Dianziani, U., et al. (1987) Multiple myeloma: Biological and clinical signifi-cance of marrow plasma cell labeling index.
Haema-tologica 72, 171–178.
39. Greipp, P. R., Witzig, T. E., Gonchorroff, N., et al. (1987) Immunofluorescence labeling indices in my-eloma and related monoclonal gammapathies. Mayo
Clin. Proc. 62, 969.
40. Greipp, P. R., Lust, J. A., O’Fallon, W. M., et al. (1993) Plasma cell labeling index and 2-micro-globulin predict survival independent of thymidine kinase and C-reactive protein in multiple myeloma.
Blood 81, 3382–3387.
41. Sonneveld, P., Durie, B. G., Lokhorst, H. M., et al.
(1993) Analysis of multidrug-resistance (MDR-1) glycoprotein and CD56 expression to separate mono-clonal gammopathy from multiple myeloma. Br. J.
Haematol. 83, 63– 67.
42. San Miguel, J. F., Garcia-Sanz, R., Gonzalez, M., et
al. (1995) Immunophenotype and DNA cell content
in multiple myeloma. Bailliere’s Clin. Haematol. 8, 735–739.
43. San Miguel, J. F., Garcia-Sanz, R., Gonzalez, M., et
al. (1996) DNA cell content studies in multiple
my-eloma. Leuk. Lymphoma 23, 33– 41.
44. Ocqueteau, M., Orfao, A., Almeida, J., et al. (1998) Immunophenotypic characterization of plasma cell from monoclonal gammopathy of undetermined sig-nificance patients. Implications for the differential diagnosis between MG and multiple myeloma.
Am. J. Pathol. 152, 1655–1665.
45. Almeida, J., Orfa˜o, A., Mateo, G., et al. (1999) Immunophenotypic and DNA content characteristics of plasma cell in multiple myeloma and monoclonal gammapathy of undetermined significance. Pathol.
Biol. 47, 119 –127.
46. Avet-Loiseau, H., Facon, T., Daviet, A., et al. (1999) 14q32 translocations and monosomy 13 observed in monoclonal gammopathy of undetermined signifi-cance delineate a multistep process for the oncogen-esis of multiple myeloma. Intergroupe Francophone du Myelome. Cancer Res. 59, 4546 – 4550.
47. Avet-Loiseau, H., Li, J. Y., Morineau, N., et al. (1999) Monosomy 13 is associated with the transi-tion of monoclonal gammopathy of undetermined significance to multiple myeloma. Intergroupe Fran-cophone du Myelome. Blood 94, 2583–2589. 48. Gould, J., Alexanian, R., Goodacre, A., et al. (1988)
Plasma cell karyotype in multiple myeloma. Blood
71, 453.
49. Dewald, G. W., Kyle, R. A., Hicks, G. A., et al. (1985) The clinical significance of cytogenetic stud-ies in 100 patients with multiple myeloma, plasma cell leukemia, or amyloidosis. Blood 66, 380 –390. 50. Fonseca, R., Hoyer, J. D., Aguayo, P., et al. (1999)
Clinical significance of the translocation (11; 14) (q13; q32) in multiple myeloma. Leuk. Lymphoma
35, 599 – 605.
51. Fonseca, R., Witzig, T. E., Gertz, M. A., et al. (1998) Multiple myeloma and the translocation t(11; 14) (q13; q32): A report on 13 cases. Br. J. Haematol.
101, 296 –301.
52. Hoyer, J. D., Hanson, C. A., Fonseca, R., et al. (2000) The (11; 14) (q13; q32) translocation in mul-tiple myeloma. A morphologic and immunohisto-chemical study. Am. J. Clin. Pathol. 113, 831– 837. 53. Brown, R. D., Pope, B., Luo, X. F., et al. (1994) The oncoprotein phenotype of plasma cell from patients
with multiple myeloma. Leuk. Lymphoma 16, 147– 156.
54. Corradini, P., Inghirami, G., Astolfi, M., et al. (1994) Inactivation of tumor suppressor genes, p53 and Rb1, in plasma cell dyscrasias. Leukemia 8, 758 –767. 55. Corradini, P., Ladetto, M., Voena, C., et al. (1993)
Mutational activation of N- and K-ras oncogenes in plasma cell dyscrasias. Blood 81, 2708 –2713. 56. Pope, B., Brown, R., Luo, X. F., et al. (1997) Disease
progression in patients with multiple myeloma is associated with a concurrent alteration in the expres-sion of both oncogenes and tumour suppressor genes and can be monitored by the oncoprotein phenotype.
Leuk. Lymphoma 25, 545–554.
57. Corradini, P., Ladetto, M., Inghirami, G., et al. (1994) N- and K-ras oncogenes in plasma cell dys-crasias. Leuk. Lymphoma 15, 17–20.
58. Westendorf, J. J., Lammert, J. M., and Jelinek, D. F. (1995) Expression and function of Fas (APO-1/ CD95) in patient myeloma cells and myeloma cell lines. Blood 85, 3566 –3576.
59. Miguel-Garcia, A., Orero, T., Matutes, E., et al. (1998) bcl-2 expression in plasma cell from neoplas-tic gammopathies and reactive plasmacytosis: A comparative study. Haematologica 83, 298 –304. 60. Mongkonsritragoon, W., Kimlinger, T., Ahmann, G.,
et al. (1998) Is multidrug resistance (P-glycoprotein)
an intrinsic characteristic of plasma cell in patients with monoclonal gammopathy of undetermined sig-nificance, plasmacytoma, multiple myeloma and amyloidosis? Leuk. Lymphoma 29, 577–584 61. Rimsza, L. M., Campbell, K., Dalton, W. S., et al.
(1999) The major vault protein (MVP), a new mul-tidrug resistance associated protein, is frequently ex-pressed in multiple myeloma. Leuk. Lymphoma 34, 315–324.
62. Rui Arguelles, G. J., and San Miguel, J. F. (1994) Cell surface markers in multiple myeloma. Mayo
Clin. Proc. 69, 684 – 690.
63. Tazzari, P. L., Gobbi, M., Dinota, A., et al. (1987) Normal and neoplastic plasma cell membrane immu-nophenotype. Studies with new membrane antibod-ies. Clin. Exp. Immunol. 70, 192–200.
64. Tominaga, N., Katagiri, S., Ohnishi, M., et al. (1989) Analysis of surface antigen expression of human immunoglobulin secreting cells. Phenotypic hetero-geneity in normal counterparts of myeloma cells.
Br. J. Haematol. 73, 302–308.
65. Terstappen, L. W. M. M., Johnsen, S., Segers-Nol-ten, I., et al. (1990) Identification and characteriza-tion of normal human plasma cell in human marrow by flow cytometry. Blood 76, 1739 –1747.
66. Harada, H., Kawano, M. M., Huang, N., et al. (1993) Phenotypic difference of normal plasma cell from mature myeloma cells. Blood 81, 2658 –2563.
67. San Miguel, J. F., Caballero, M. D., Gonzallez, M., et
al. (1986) Immunological phenotype of neoplasms
involving the B-cell in the last step of differentiation.
Br. J. Haematol. 62, 75– 83.
68. Andersson, K. C., Park, E. K., Bates, M. P., et al. (1983) Antigens on human plasma cell identified by monoclonal antibodies. J. Immunol. 130, 1132–1138. 69. Katagiri, S., Yonezawa, T., Tamaki, T., et al. (1984) Surface expression of human myeloma cells: An analysis using a panel of monoclonal antibodies.
Acta Haematol. 72, 372–378.
70. Jackson, N., Ling, N. R., Ball, J., et al. (1988) An analysis of myeloma plasma cell phenotype using antibodies defined at the IIrd International Workshop on human leukocyte differentiation antigens. Clin.
Exp. Immunol. 72, 351–356.
71. Wijdenes, J., Vooijs, W. C., Clement, C., et al. (1996) A plasmocyte selective monoclonal antibody (B-B4) recognizes syndecan-1. Br. J. Haematol. 94, 318 –323.
72. San Miguel, I. F., Gonzalez, M., Gasco´n, A., et al. (1991) Immunophenotype heterogeneity of multiple myeloma: Influence on the biology and clinical course of the disease. Br. J. Haematol. 77, 185–190. 73. Hata, H., Xiao, H., Petrucci, M. T., et al. (1993) Interleukin gene expression in multiple myeloma: A characteristic of immature tumor cells. Blood 81, 3357–3364.
74. Omede, P., Boccadoro, M., Fusaro, A., et al. (1993) Multiple myeloma: ‘Early’ plasma cell phenotype identifies patients with aggressive biological and clinical characteristics. Br. J. Haematol. 85, 504 – 513.
75. Leo, R., Boecker, M., Peest, D., et al. (1992) Mul-tiparameter analyses of normal and malignant human plasma cell: CD38⫹⫹, CD56⫹, CD54⫹, cIg⫹ is the common phenotype of myeloma cells. Ann.
He-matol. 64, 132–139.
76. Zandecki, M., Facon, T., Bernardi, F., et al. (1995) CD19 and immunophenotype of marrow plasma cell in monoclonal gammopathy of undetermined signif-icance. J. Clin. Pathol. 48, 548 –552.
77. Van Camp, B., Durie, N. G. M., Spier, C., et al. (1990) Plasma cells in multiple myeloma express a natural-killer cell-associated antigen: CD56 (NKH-1; Leu-19). Blood 76, 377–382.
78. Vescio, R. A., Hong, C. H., Cao, J., et al. (1994) The hematopoietic stem cell antigen CD34, is not ex-pressed on the malignant cells in multiple myeloma.
Blood 84, 3283–3290.
79. Kimlinger, T., and Witzig, T. E. (1997) Expression of the hematopoietic stem cell antigen CD34 on blood and marrow monoclonal plasma cell from pa-tients with multiple myeloma. Bone Marrow
80. Ocqueteau, M., Orfao, A., Garcia-Sanz, R., et al. (1996) Expression of the CD117 antigen (c-Kit) on normal and myelomatous plasma cells. Br. J.
Haematol. 95, 489 – 493.
81. Durie, B. G. M., and Grogan, T. M. (1985) CALLA-positive myeloma: An aggressive subtype with poor survival. Blood 66, 229 –232.
82. Warburton, P., Joshua, D. E., Gibson, J., et al. (1989) CD10 (CALLA) positive lymphocytes in myeloma: Evidence that they are a malignant precursor popu-lation and are of germinal center origin. Leuk.
Lym-phoma 1, 11–20.
83. Pellat-Deceunyninck, C., Bataille, R., Robillard, N.,
et al. (1994) Expression of CD28 and CD40 in
hu-man myeloma cells: A comparative study with nor-mal plasma cells. Blood 84, 2597–2603.
84. Robillard, N., Jego, G., Pellat-Deceunynck, C., et al. (1998) CD28, a marker associated with tumoral ex-pansion in multiple myeloma. Clin. Cancer Res. 4, 1521–1526.
85. Westendorf, J. J., Ahmann, G. I., Lust, J. A., et al. (1994) Molecular and biological role of CD40 in multiple myeloma. Curr. Top. Microbiol. Immunol.
194, 63–72.
86. Grogan, T. M., Durie, B. G. M., Spier, C., et al. (1989) Myelomonocytic antigen positive multiple myeloma. Blood 73, 763–769.
87. Epstein, J., Huiquing Xiao, M. D., and Xiao-Yan, H. (1990) Markers of multiple hematopoietic-cell lin-eages in multiple myeloma. N. Engl. J. Med. 322, 664 – 668.
88. Drach, J., Gattringer, C., and Huber, H. (1990) Mul-tiple myeloma with coexpression of myeloid and natural-killer antigens. Blood 76, 265.
89. Drew, M., Barker, H. F., Ball, J., et al. (1996) Very late antigen (VLA) expression by normal and neo-plastic human plasma cells; Including an assessment of antibodies submitted to the Vth International Workshop on Leucocyte Differentiation Antigens us-ing human myeloma cell lines. Leuk. Res. 20, 619 – 624.
90. Hamilton, M. S., Ball, J., Bromidge, E., and Franklin, I. M. (1991) Surface antigen expression of human neoplastic plasma cell includes molecules associated with lymphocyte recirculation and adhesion. Br. J.
Haematol. 78, 60 – 65.
91. Kawano, M. M., Mahmoud, M. S., Huang, N., et al. (1995) High proportions of VLA-5-immature my-eloma cells correlated well with poor response to treatment in multiple myeloma. Br. J. Haematol. 91, 860 – 864.
92. Pellat-Deceunynck, C., Barille, S., Puthier, D., et al. (1995) Adhesion molecules on human myeloma cells: Significant changes in expression related to
malignancy, tumor spreading, and immortalization.
Cancer Res. 55, 3647–3653.
93. Pellat-Deceunynck, C., Barille, S., Jego, G., et al. (1998) The absence of CD56 (NCAM) on malignant plasma cell is a hallmark of plasma cell leukemia and of a special subset of multiple myeloma. Leukemia
121, 1977–1982.
94. Ishikawa, H., Mahmoud, M. S., and Fujii, R. (2000) Proliferation of immature myeloma cells by interleu-kin-6 is associated with CD45 expression in human multiple myeloma. Leuk. Lymphoma 39, 51–55. 95. Sakai, A., Fujii, T., Noda, M., et al. (1996) Plasma
cells composing plasmacytoma have phenotypes dif-ferent from those of myeloma cells. Am. J. Hematol.
53, 251–253.
96. Shimazaki, C., Gotoh, H., Ashihara, E., et al. (1992) Immunophenotype of DNA contents of myeloma cells in primary plasma cell leukemia. Am. J.
Hema-tol. 39, 159 –162.
97. Urashima, M., Chauhan, D., Uchiyama, H., et al. (1995) CD40 ligand triggered interleukin-6 secretion in multiple myeloma. Blood 85, 1903–1912. 98. Lemoli, R. M., Fortuna, A., Grande, A., et al. (1994)
Expression and functional role of c-kit ligand (SCF) in human multiple myeloma cells. Br. J. Haematol.
88, 760 –769.
99. Pope, B., Brown, R. D., Gibson, J., et al. (1997) The functional phenotype of the primitive plasma cell 98in patients with multiple myeloma correlates with the clinical state. Leuk. Lymphoma 27, 83–91. 100. Kawano, M. M., Huang, N., Harada, H., et al. (1993)
Identification of immature and mature myeloma cells in the marrow of human myelomas. Blood 82, 564 – 570.
101. Mathew, P., Ahmann, G. J., Witzig, T. E., et al. (1995) Clinicopathological correlates of CD56 ex-pression in multiple myeloma: A unique entity?
Br. J. Haematol. 90, 459 – 461.
102. Orfa˜o, A., Garcia-Sanz, R., Lopez-Berges, M. C., et
al. (1994) A new method for the analysis of plasma
cell DNA content in multiple myeloma samples us-ing a CD38/propidium iodide double stainus-ing tech-nique. Cytometry 17, 332–339.
103. Gomez-Arbone´s, X., Gallart, M. A., and Macia`, J. (1996) Dual CD38 and DNA staining of plasma cell in monoclonal gammapathies attained by a rapid non-wash and automated method. Clin. Lab. Med.
18, 95–97.
104. Latreille, J., Barlogie, B., Dosik, G., et al. (1980) Cellular DNA content as a marker of human multiple myeloma. Blood 55, 403– 408.
105. Latreille, J., Barlogie, B., Disik, G., et al. (1982) Ploidy and proliferative characteristics in monoclo-nal gammopathies. Blood 59, 43–51.
(1985) Flow cytometric analysis of DNA content of marrow cells in patients with plasma cell myeloma. Clinical implications. Blood 59, 528 –535.
107. Smith, L., Barlogie, B., and Alexaninan, R. (1986) Biclonal and hipoploid multiple myeloma. Am. J.
Med. 80, 841– 843.
108. Morgan, R. J., Jr., Gonchoroff, N. J., Katzmann, J. A., et al. (1989) Detection of hypodiploidy using multi-parameter flow cytometric analysis: A prog-nostic indicator in multiple myeloma. Am. J.
Hema-tol. 30, 195–200.
109. Tafuri, A., Meyers, J., Lee, B. J., et al. (1991) DNA and RNA flow cytometric study in multiple my-eloma. Clinical correlations. Cancer 67, 449 – 454. 110. Garcia-Sanz, R., Orfa˜o, A., Gonzalez, M., et al.
(1995) Prognostic implications of DNA aneuploidy in a series of 156 untreated myeloma patients. Br. J.
Haematol. 90, 106 –112.
111. Barlogie, B., Alexanxian, R., Smith, L., et al. (1985) Prognostic implications of tumor cell DNA and RNA content in multiple myeloma. Blood 66, 338 –341. 112. Greipp, P. R., Trendle, M. C., Leong, T., et al. (1999)
Is flow cytometric DNA content hypodiploidy prog-nostic in multiple myeloma? Leuk. Lymphoma 35, 83– 89.
113. San Miguel, J. F., Garcia-Sanz, R., Gonzalez, M., et
al. (1995) A new staging system for multiple
my-eloma based on the number of S-phase plasma cells.
Blood 85, 448 – 455.
114. Trendle, M. C., Leong, T., Kyle, R. A., et al. (1999) Prognostic significance of the S-phase fraction of light-chain-restricted cytoplasmic immunoglobulin (cIg) positive plasma cell in patients with newly diagnosed multiple myeloma enrolled on Eastern Co-operative Oncology Group treatment trial E9486.
Am. J. Hematol. 61, 232–237.
115. Kyle, R. A. (1994) Multiple myeloma: How did it begin? Mayo Clin. 69, 680 – 683.
116. Greipp, P. R., and Lust, J. A. (1997) Pathogenetic relation between monoclonal gammopathies of unde-termined significance and multiple myeloma. Stem
Cells 13(Suppl. 2), 10 –21.
117. Bataille, R. (1997) New insights in the clinical biol-ogy of multiple myeloma. Semin. Hematol. 34, 23– 28.
118. Pico, J. L., Castagna, L., and Bourhis, J. H. (1998) Recent progress in the biology of multiple myeloma and future directions in the treatment. Hematol. Cell
Ther. 40, 45– 61.
119. Bakkus, M. H., Van Riet, I., De Greef, C., et al. (1995) The clonogenic precursor cell in multiple myeloma. Leuk. Lymphoma 18, 221–229.
120. Zandecki, M., Lai, J. L., Genevieve, F., et al. (1997) Several cytogenetic subclones may be identified within plasma cell from patients with monoclonal gammopathy of undetermined significance, both at diagnosis and during the indolent course of this con-dition. Blood 90, 3682–3690.
121. Helfrich, M. H., Livingston, E., Franklin, I. M., et al. (1997) Expression of adhesion molecules in malig-nant plasma cell in multiple myeloma: Comparison with normal plasma cell and functional significance.
Blood Rev. 11, 28 –38.
122. Anderson, K. C., and Lust, J. A. (1999) Role of cytokines in multiple myeloma. Semin. Hematol. 36, 14 –20.
123. Lust, J. A. (1994) Role of cytokines in the pathogen-esis of monoclonal gammopathies. Mayo Clin. Proc.
69, 691– 697.
124. Klein, B., Zhang, X. G., Lu, Z. Y., and Bataille, R. (1995) Interleukin 6 in multiple myeloma. Blood 85, 863– 872.
125. Lust, J. A., and Donovan, K. A. (1999) The role of interleukin-1 beta in the pathogenesis of multiple myeloma. Hematol. Oncol. Clin. North Am. 13, 1117–1125.
126. Rajkumar, S. V., and Witzig, T. E. (2000) A review of angiogenesis and antiangiogenic therapy with tha-lidomide in multiple myeloma. Cancer Treat. 26, 351–362.
127. Sjak-Shie, N. N., Vescio, R. A., and Berenson, J. R. (1999) HHV-8 infection and multiple myeloma.