www.atmos-chem-phys.org/acp/5/2561/ SRef-ID: 1680-7324/acp/2005-5-2561 European Geosciences Union
Chemistry
and Physics
CCN activation and cloud processing in sectional aerosol models
with low size resolution
H. Korhonen1, V.-M. Kerminen1, K. E. J. Lehtinen2, and M. Kulmala3
1Climate and Global Change, Finnish Meteorological Insitute, P.O. Box 503, FI-00101 Helsinki, Finland
2University of Kuopio and Finnish Meteorological Institute, Department of Applied Physics, P.O. Box 1627, FI-70211 Kuopio, Finland
3Department of Physical Sciences, University of Helsinki, P.O.Box 64, FI-00014 Helsinki, Finland Received: 25 May 2005 – Published in Atmos. Chem. Phys. Discuss.: 14 July 2005
Revised: 22 September 2005 – Accepted: 22 September 2005 – Published: 27 September 2005
Abstract. We investigate the influence of low size resolu-tion, typical to sectional aerosol models in large scale ap-plications, on cloud droplet activation and cloud processing of aerosol particles. A simplified cloud model with five ap-proaches to determine the fraction of activated particles is compared with a detailed reference model under different atmospheric conditions. In general, activation approaches which assume a distribution profile within the critical model size sections predict the cloud droplet concentration most ac-curately under clean and moderately polluted conditions. In such cases, the deviation from the reference simulations is below 15% except for very low updraft velocities. In highly polluted cases, the concentration of cloud droplets is signif-icantly overestimated due to the inability of the simplified model to account for the kinetic limitations of the droplet growth. Of the profiles examined, taking into account the local shape of the particle size distribution is the most accu-rate although in most cases the shape of the profile has little relevance. While the low resolution cloud model cannot re-produce the details of the out-of-the-cloud aerosol size dis-tribution, it captures well the amount of sulphate produced in aqueous-phase reactions as well as the distribution of the sulphate between the cloud droplets. Overall, the simpli-fied cloud model with low size resolution performs well for clean and moderately polluted regions that cover most of the Earth’s surface and is therefore suitable for large scale mod-els. It can, however, show uncertainties in areas with strong pollution from anthropogenic sources.
Correspondence to:H. Korhonen ([email protected])
1 Introduction
Clouds affect the climate system of the Earth in many im-portant ways. They are a major component in the hydrolog-ical cycle and therefore partly control the atmospheric con-centration of the most important greenhouse gas, water (Ra-manathan et al., 2001). Clouds and precipitation are also very important for atmospheric budgets of many reactive and cli-matically relevant trace gases. In addition, clouds reduce the amount of sunlight that reaches the Earth’s surface, thus cool-ing the climate, while at the same time they absorb outgo-ing long-wave radiation resultoutgo-ing in a positive climate forc-ing. They also modify the size distribution and composition of atmospheric aerosol particles e.g. through chemical reac-tions taking place in cloud water. Furthermore, precipitating clouds are an effective removal mechanism of atmospheric particles (Andronache, 2004).
Aerosol particles, in their part, act as cloud condensa-tion nuclei (CCN) and can thus greatly influence the cli-matic properties of the clouds, such as albedo and lifetime. However, the global climate forcing resulting from aerosol-cloud interactions, also called the indirect aerosol effect, re-mains poorly quantified (Lohmann and Feichter, 2005; Rot-stayn and Liu, 2005; Sekiguchi et al., 2003). Some of the uncertainty surrounding the magnitude of the indirect effect rises from inadequate understanding of the complex relation-ship between aerosol and droplet concentrations. However, also the great computational expense associated with detailed simulations of relevant phenomena prevents reliable assess-ments of the forcing with regional and global atmospheric models.
0 0.1 0.2 0.3 0.4 0.5 0.6 0
0.1 0.2 0.3 0.4 0.5 0.6 0.7
Time (h)
LWC (g/m
3)
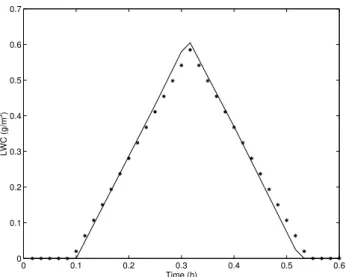
Fig. 1. Liquid water content profile inside the cloud as predicted by the approximate scheme (stars) and by detailed reference cloud model for constant updraft velocity and downdraft with the same speed (solid line).
clouds from the first principles but have to resort to simpli-fied parameterizations. One example of such simplifications is that the models do not typically solve the profile of the cloud supersaturation, S, resulting from cooling of the rising air parcel on one hand and from condensation loss of wa-ter onto activated droplets on the other, from first principles. Instead, it is customary to diagnose the number of activated particles from the maximum supersaturation,Smax, reached during the cloud cycle, i.e. to assume that all particles whose critical supersaturation,Scrit, is lower thanSmaxwill activate. For this purpose, several parameterizations have been devel-oped to link the aerosol distribution to the value of maximum supersaturation reached inside the cloud (e.g. Nenes and Se-infeld, 2003; Abdul-Razzak and Ghan, 2002; Abdul-Razzak et al, 1998).
Another important source of uncertainty in large scale sim-ulations of aerosol-cloud interactions stems from the simpli-fied representation of the aerosol size distribution. In sec-tional aerosol modules for 3D models, the number of par-ticle size sections is typically limited to below or around 20 (Spracklen et al., 2005; Rodriguez and Dabdub, 2004; Zhang et al., 2004; Bessagnet et al., 2004). Such a poor size reso-lution can capture only the general features of the particle distribution; consequently e.g. the concentration of cloud droplets or the mass and surface area of cloud processed aerosol can differ notably from a detailed solution (Zhang et al., 2002).
In this study, we will further investigate the effect that a low sectional size resolution in models has on CCN activa-tion and cloud processing of aerosol particles. In particu-lar, we introduce a simplified cloud model and compare five ways to determine the fraction of particles that activate to
cloud droplets under different atmospheric conditions. These five activation schemes are evaluated against a detailed adi-abatic cloud model based on the prediction of cloud droplet concentration and aerosol distribution after one and several cloud cycles.
2 Model description
An existing sectional multicomponent aerosol model UHMA (Korhonen et al., 2004) was extended with a cloud scheme that resembles in complexity those used in large scale mod-els. This scheme does not solve the growth of the cloud droplets from first principles but instead it diagnoses the number and size of activated droplets from three prescribed input parameters: maximum supersaturation reached inside the cloud (Smax), time the air parcel spends inside the cloud (1tcloud)and the average liquid water content of the cloud (LWC). The three input parameters were used to diagnose the cloud properties in the following way: The number of activated droplets was determined fromSmaxindividually for each aerosol size section. Treating each section separately is necessary since the chemical composition of the particles can differ between the sections. Instead of assuming that the cloud liquid water content is a constant function of height, we assumed that the profile increases linearly from the bot-tom to the top of the cloud. An example of the resulting profile, which can be calculated from the average LWC and the time inside the cloud,1tcloud, is shown in Fig. 1 against a reference model simulation with a constant updraft. It can be seen that the simple profile corresponds to a good accuracy to cases when the updraft velocity is constant. Furthermore, several observations support our choice of a linear increase of cloud liquid water content as a function of height (e.g. Brenguir et al., 2000). With a further assumption that all the activated particles grow to same droplet size, we can use the liquid water content profile to calculate the size of the cloud droplets as a function of height from the cloud base as well as the amount of sulphate produced in aqueous phase reactions during the cloud cycle.
The three prescribed parameters, namelySmax, LWC and
i−1 i i+1 Approach 1
i−1 i i+1
Approach 2
i−1 i i+1
Approach 3
i−1 i i+1
Approach 4
i−1 i i+1
Approach 5
Dcrit Dcrit
D
crit Dcrit Dcrit
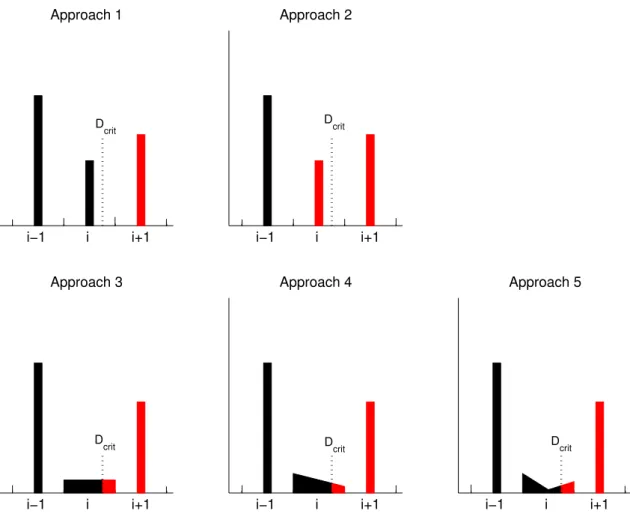
Fig. 2.Schematic figure of CCN activation approaches used. For each approach, the sections and fractions of sections in red are activated while the sections and fractions of sections in black remain as interstitial. The dotted vertical line corresponds to the critical activation diameter. For approaches 3, 4 and 5, the slopes and the height of the particle distribution profile in the critical section are exaggerated.
Aerosol model UHMA offers several ways to describe the particle size distribution. The simulations presented here were conducted with three sectional descriptions: with fixed sections, with full-moving sections, and with moving-center approach (Jacobson, 1997). In all these descriptions the size sections are spaced according to particle dry size, and thus particles do not move between sections due to water conden-sation. All the particles in a section are internally mixed and have the same size which is called the characteristic size of the section. For fixed and moving center descriptions, the lower and upper boundaries of the sections are fixed in lo-cation and spaced logarithmically around theinitial charac-teristic size. For full-moving description the boundaries are determined separately for each cloud cycle from spacing of the characteristic sizes at that moment.
In most of the simulations the model was run in dry parti-cle diameter range 10 nm–1.5µm with 10 size sections, a res-olution that roughly corresponds to or exceeds that of most current global or regional scale models. With such sparse spacing, special attention must be paid to the critical
sec-tion(s), i.e. size section(s) into which a minimum activation diameter falls. In this study, we tested five approaches to de-termine the fraction of particles activated in a critical section (Fig. 2):
1. all particles in section activate ifSmaxlarger thanScrit of the characteristic size of the section
2. all particles in section activate ifSmaxlarger thanScrit of the upper boundary size of the section
3. uniform distribution profile within section that con-serves particle number; particles whose Scrit smaller thanSmaxactivate
4. linear distribution profile within section that conserves particle number and volume; particles whose Scrit smaller thanSmaxactivate
particle number; particles whoseScritsmaller thanSmax activate.
As shown in Fig. 2, approaches 3, 4 and 5 typically acti-vate only a part of the particles in a critical section. In such sections, the particles are split into activated and interstitial subgroups in a mass-conservative way and the two subgroups are treated separately for the duration of the cloud cycle.
In summary, the simplified cloud model described above represents the cloud with three prescribed parameters and the aerosol particle size distribution with only 10 size sections. The results from the this model were compared against a dy-namic adiabatic cloud model (used as a reference model in this study) which solves explicitly for the saturation and liq-uid water content profiles inside the cloud, as well as for the condensation of water onto the cloud droplets. This cloud scheme was adapted from Kerminen (2001) and run inter-actively with the same aerosol dynamics as the simplified model.
One should also note that many large scale models ap-ply modal (typically log-normal) rather than sectional rep-resentation of the particle size distribution. Due to the differ-ent philosophy behind these two represdiffer-entations, the activa-tion approaches and sulphate formaactiva-tion in the aqueous phase used in this study cannot be generalized to modal models in a straightforward way. However, several activation con-cepts have been suggested for modal models in earlier work, ranging from detailed parameterizations (e.g. Fountoukis and Nenes, 2005; Abdul-Razzak et al., 1998) to simple treatment of cloud processing only for water-soluble accumulation and coarse mode particles (Stier et al., 2005).
3 Simulation design
We evaluated the five activation approaches in the simplified model against the reference model with 500 size sections. The three prescribed cloud properties needed for the simpli-fied model, namelySmax,1tcloudand LWC, were taken from the reference simulations for each cloud cycle. Although in the simulations presented in this study we run the mod-els only for condensation, activation of CCNs and aqueous-phase sulphate formation, the simulations can be easily ex-tended to other relevant aerosol processes.
Ideally, the simplified model should reproduce the refer-ence results in three respects: Firstly, the number of activated particles should be resolved accurately. Secondly, the forma-tion and distribuforma-tion of sulphate in aqueous phase reacforma-tions should be described correctly. Thirdly, the simplified model with low resolution in size distribution description should re-produce the aerosol particle distribution after several succes-sive cloud cycles with different saturation conditions.
We performed simulations of single and several successive cloud cycles with typical marine, rural, and urban aerosol distributions taken from Jaenicke (1993) and presented in Ta-ble 1. For simplicity, the particles were initially assumed
to consist of ammonium sulphate and slightly water-soluble organics in a ratio of 1:1. During the simulations the par-ticle composition changed due to condensation of sulphuric acid and due to aqueous-phase oxidation of SO2with H2O2. Only this oxidation reaction was considered as it is clearly the dominant one in acidic cloud droplets which would form from the assumed dry aerosol. Although our description of aerosol distribution and interaction with the gas phase is highly idealized, using different initial composition or more detailed condensation and sulphate formation mechanisms would not change the main conclusions of the study. It could, however, affect the magnitude of the results at least to some extent and thus the results should be considered relative to the reference model.
In all the simulations presented below, the initial concen-tration of H2O2 was set to 500 ppt (Seinfeld and Pandis, 1998). On the other hand, the initial concentration of SO2 was adjusted to a typical pollution level of the simulated en-vironment, i.e. 70 ppt for marine conditions, 500 ppt for rural conditions, and 2500 ppt for urban conditions (Seinfeld and Pandis, 1998). The concentration of OH, which was respon-sible for gas-phase oxidation of SO2 to sulphuric acid, fol-lowed a semisinusoidal pattern starting at 2×106cm−3 and peaking at 5×10⁶molecules/cm3after 9 h (Seinfeld and Pan-dis, 1998). The maximum height that the ascending air par-cel reached and the updraft velocity were varied between the cloud cycles.
All the model runs begun close to the ground with initial relative humidity and temperature of 63.5% and 293 K. Par-ticle activation was assumed to start in the simplified model once the relatively humidity rose above 99.9%, and the cloud was assumed to evaporate once the prescribed time inside the cloud had passed. Both models simulated also the descent of the air parcel from the cloud top and let the relevant physical and chemical processes modify the aerosol distribution in the downdraft (inside the cloud as well as below the cloud base). The simulation of each cloud cycle ended when the air parcel reached its starting height close to the ground. In the simula-tions of successive cloud cycles the aerosol distribution from the previous cycle was used as input for the next cycle.
4 Results and discussion
4.1 Single cloud cycle
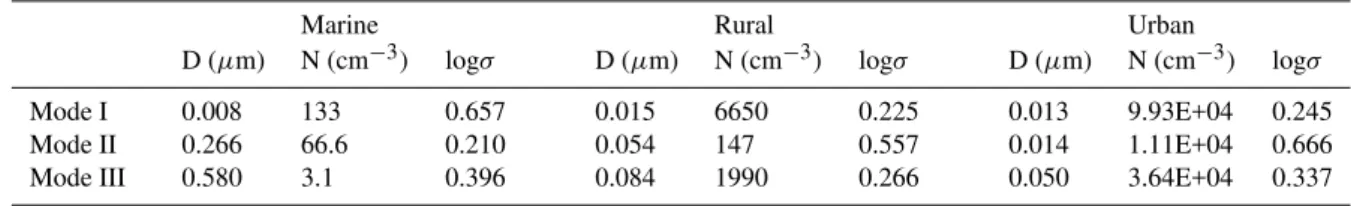
Table 1.Initial particle size distributions used in the simulations. Values have been taken from Jaenicke (1993).
Marine Rural Urban
D (µm) N (cm−3) logσ D (µm) N (cm−3) logσ D (µm) N (cm−3) logσ
Mode I 0.008 133 0.657 0.015 6650 0.225 0.013 9.93E+04 0.245
Mode II 0.266 66.6 0.210 0.054 147 0.557 0.014 1.11E+04 0.666
Mode III 0.580 3.1 0.396 0.084 1990 0.266 0.050 3.64E+04 0.337
0.2 0.4 0.6 0.8 1
0.5 1 1.5 2
N D,simp
/ N
D,dyn
Rural
0.2 0.4 0.6 0.8 1
0.9 1 1.1 1.2 1.3
ND,simp
/ N
D,dyn
Rural
0.2 0.4 0.6 0.8 1
0 2 4 6 8
N D,simp
/ N
D,dyn
Updraft velocity (m/s) Urban
0.2 0.4 0.6 0.8 1
1 1.5 2 2.5 3 3.5
ND,simp
/ N
D,dyn
Urban
Updraft velocity (m/s)
0.2 0.4 0.6 0.8 1
0.95 1 1.05 1.1 1.15
N D,simp
/ N
D,dyn
Marine Approach 1
Approach 2 Approach 3
0.2 0.4 0.6 0.8 1
0.995 1 1.005 1.01 1.015 1.02 1.025
N D,simp
/ N
D,dyn
Marine Approach 3
Approach 4 Approach 5
Fig. 3.Predictions of cloud droplet concentrations from 5 activation schemes normalized with results from the reference cloud model. All
simulations with the simplified model have been made independently of each other with 10 size sections in size range 10 nm–1.5µm and
with moving center description. Note that the scale of the y-axis is different in each subplot.
Firstly, it is evident that the performance of the sim-plest approaches which assume that either all or none of the particles in each section activate, i.e. approaches 1 and 2, varies greatly over the simulated updraft range (Fig. 3, left panel). These two approaches predict exactly the same droplet concentration at times when the maximum supersat-uration reached in the cloud falls in the critical section be-tween the critical supersaturation of the lower boundary size
and that of the characteristic particle size. For a large major-ity of the simulated cloud cycles, however, approach 2 gen-erates the greatest deviation from the reference results. This is because it activates all the particles in a section as soon as
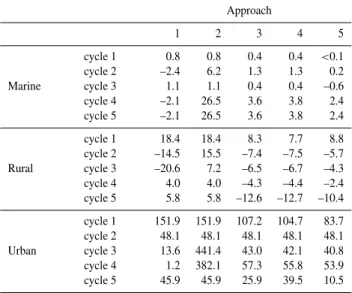
Table 2.Percent error in cloud droplet concentrations from the ref-erence model values in a simulation of five successive cloud cycles. Results for the simplified model have been obtained with 10 size
sections in size range 10 nm–1.5µm and with moving center
de-scription.
Approach
1 2 3 4 5
cycle 1 0.8 0.8 0.4 0.4 <0.1
cycle 2 –2.4 6.2 1.3 1.3 0.2
Marine cycle 3 1.1 1.1 0.4 0.4 –0.6
cycle 4 –2.1 26.5 3.6 3.8 2.4
cycle 5 –2.1 26.5 3.6 3.8 2.4
cycle 1 18.4 18.4 8.3 7.7 8.8
cycle 2 –14.5 15.5 –7.4 –7.5 –5.7
Rural cycle 3 –20.6 7.2 –6.5 –6.7 –4.3
cycle 4 4.0 4.0 –4.3 –4.4 –2.4
cycle 5 5.8 5.8 –12.6 –12.7 –10.4
cycle 1 151.9 151.9 107.2 104.7 83.7
cycle 2 48.1 48.1 48.1 48.1 48.1
Urban cycle 3 13.6 441.4 43.0 42.1 40.8
cycle 4 1.2 382.1 57.3 55.8 53.9
cycle 5 45.9 45.9 25.9 39.5 10.5
On the other hand, the results for approaches 3, 4 and 5 – all of which assume a continuous distribution profile within the critical size section – are very similar (Fig. 3, right panel). Only approach 5, which calculates the profile by taking into account the particle concentration in neighbouring sections, systematically predicts slightly more accurate results than its counterparts. However, even these three approaches perform poorly in some simulations, most notably under urban con-ditions and with low updraft velocities. Under these condi-tions, kinetic limitations of droplet formation are often sig-nificant, as discussed in detail by Nenes et al. (2001) and Kul-mala et al. (1993). For some particles, situations may arise when the particles activate at first as the saturation of water in the air parcel rises above their critical supersaturation. If con-densation onto the forming cloud droplets becomes very fast, however, the supersaturation of the parcel may drop below the equilibrium saturation level of these particles and they de-activate to become interstitial particles. This effect cannot be described in simplified cloud schemes, such as ours, which assume instantaneous response of particles to supersaturation changes and calculate the number of activated droplets di-rectly from the maximum saturation reached during the cloud cycle. Therefore, simplified schemes regardless of their ac-tivation approach tend to overestimate the number of cloud droplets under conditions when the supersaturation increases slowly compared to the loss of water by condensation.
4.2 Several successive cloud cycles
A second set of simulations compared the activation ap-proaches in terms of cloud droplet concentration, out-of-cloud size distribution and production of aqueous-phase sul-phate over five successive cloud cycles. The boundary layer depth and updraft velocity were varied between the five cloud cycles and set to 1000, 1200, 1200, 1500 and 1000 m, and to 0.2, 0.5, 0.8, 1.0 and 0.4 m/s, respectively. The chang-ing conditions reflect qualitatively the cyclchang-ing of the aerosol particles in real cloudy atmosphere in which particles expe-rience variant updraft and cloud thickness. Moreover, the variation between the cloud cycles puts the cloud activation and cloud processing schemes to a more stringent test than several cloud cycles with same maximum supersaturations would. Again, the three prescribed cloud properties for the simplified model were taken from the reference simulations. The results presented below are for moving center descrip-tion of the size distribudescrip-tion unless stated otherwise.
Table 2 summarizes the results from the simplified model regarding the predicted concentration of cloud droplets. The values given are percent differences from the reference model results. In general, this set of simulations confirms the conclusions presented for a single cloud cycle: The number of activated particles is most accurately reproduced by as-suming a particle profile inside the size sections, approach 5 yielding slightly better results than the two other profiles. Overall, the deviation of these three approaches from refer-ence model under rural and marine conditions is always less than 13%, which can be considered very satisfactory for a simplified low-resolution model. For urban conditions the ostensibly good results of approach 1 during some of the cloud cycles stem from the overall poor performance of the simplified cloud model. As explained above, the neglect of kinetic limitations leads the simplified model to overestimate the number of cloud droplets. At the same time, approach 1 tends to underestimate the droplet concentration because it assumes that no activation occurs in a section unlessSmaxis larger thanScritfor the characteristic size of that section.
the fixed and moving center methods are often preferable over the full-moving one because of their more advantageous description of particle transport, emissions and nucleation. It is also worth note that although doubling the particle size res-olution improved the results significantly under marine and rural cases, the deviation from the reference simulations in fact slightly increased under urban conditions for which the kinetic limitations of droplet growth are important.
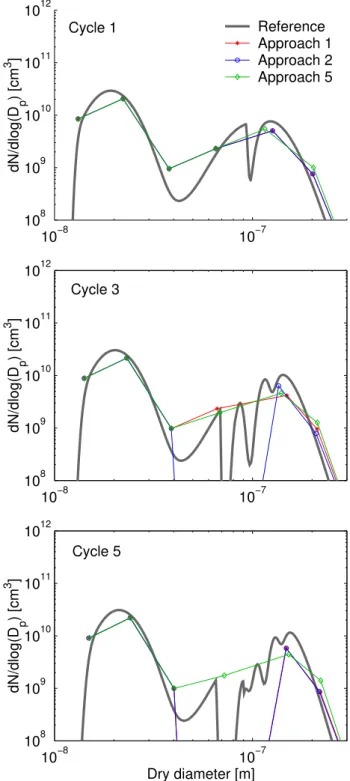
Figure 4 illustrates that the simplified model reproduces the general features of the cloud processed aerosol size bution fairly well but cannot capture the details of the distri-bution due to the low resolution, as reported earlier by Zhang et al. (2002). For example, the approaches which assume a distribution profile within the critical diameter (here repre-sented by approach 5) do not show Hoppel minimum (Hop-pel et al., 1994) at all since they activate only some of the particles in the critical sections. At the same time the sim-pler approaches 1 and 2 predict a much too wide minimum after several cloud cycles.
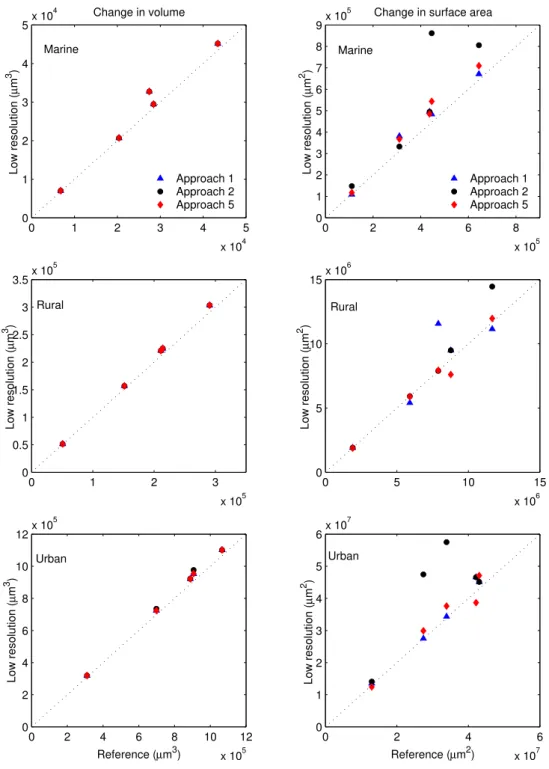
All the activation approaches predict the amount of sul-phate formed in the cloud droplets, i.e. the total dry mass change during each cloud cycle, very well (Fig. 5). This is not surprising since the oxidation rate of SO2is highly de-pendent on the liquid water content of the cloud whose aver-age value is a prescribed parameter in our simplified model and whose profile is well captured for constant updraft veloc-ities. On the other hand, distribution of the formed sulphate onto the droplets, represented in Fig. 5 through the change in total dry surface area during each cloud cycle, shows some variation between the activation approaches. Especially ap-proach 2, which often overestimates the number of activated particles (Fig. 3), tends to overestimate the formed surface area. Approaches 1 and 5 both reproduce the results from the reference simulation relatively well. On average, how-ever, approach 1 performs slightly more accurately in this respect under the simulated conditions.
The results shown in Figs. 4 and 5 are for moving center description. The other two descriptions predict nearly iden-tical dry mass increase as the moving center method (no fig-ure). The fixed description, however, clearly overestimates the dry surface area increase during the cloud cycles. This is due to numerical diffusion which originates from splitting the droplet core material between fixed size sections when sulphate formed in the cloud is added to the droplets (Korho-nen et al., 2003).
Regarding the mass of sulphate produced in the cloud, it is important to note that the good agreement with the reference model can be partly due to the assumption made about the aerosol dry composition. In the real atmosphere, the compo-sition of the effective CCN often is a function of size (Moore et al., 2004). In the simulations presented above, the dry particles consisted only of ammonium sulphate and slightly soluble organic matter. The cloud droplets forming on such particles are acidic and thus the dominant oxidation path of SO2in the droplets is with H2O2, a reaction that is only very
10−8 10−7
108 109 1010 1011 1012
dN/dlog(D
p
) [cm
3 ]
Cycle 1 Reference
Approach 1 Approach 2 Approach 5
10−8 10−7
108 109 1010 1011 1012
dN/dlog(D
p
) [cm
3 ]
10−8 10−7
108 109 1010 1011 1012
Dry diameter [m]
dN/dlog(D
p
) [cm
3 ]
Cycle 3
Cycle 5
Fig. 4.Dry aerosol size distribution under rural conditions after 1, 3 and 5 cloud cycles. Activation approaches 3, 4 and 5 give almost identical results and thus only results for approach 5 are shown. All simulations with the simplified model have been made with 10
size sections in size range 10 nm–1.5µm and with moving center
description.
0 1 2 3 4 5
x 104 0
1 2 3 4 5x 10
4
Low resolution (
µ
m
3)
Change in volume
Approach 1 Approach 2 Approach 5
0 2 4 6 8
x 105 0
1 2 3 4 5 6 7 8 9x 10
5
Low resolution (
µ
m
2)
Change in surface area
Approach 1 Approach 2 Approach 5
0 1 2 3
x 105 0
0.5 1 1.5 2 2.5 3 3.5x 10
5
Low resolution (
µ
m
3 )
Rural
0 5 10 15
x 106 0
5 10 15x 10
6
Low resolution (
µ
m
2)
Rural
0 2 4 6 8 10 12
x 105 0
2 4 6 8 10 12x 10
5
Low resolution (
µ
m
3)
Urban
Reference (µm3)
0 2 4 6
x 107 0
1 2 3 4 5 6x 10
7
Low resolution (
µ
m
2 )
Urban
Reference (µm2) Marine
Marine
Fig. 5. Change of total dry mass and total dry surface area during individual cloud cycles. Activation approaches 3, 4 and 5 give almost identical results and thus only results for approach 5 are shown. All simulations with the simplified model have been made with 10 size
sections in size range 10 nm–1.5µm and with moving center description.
strongly on the pH, such as the reaction of SO2with O3, be-come important. It is then advantageous to use size-resolving cloud models which calculate the size and pH distribution of cloud droplets dynamically taking into account the dilution factors and initial dry composition of different sized parti-cles (Kreidenweis et al., 2003; Gurciullo and Pandis, 1997).
5 Conclusions
We have evaluated the impact that a low size resolution in sectional aerosol models and a simple cloud scheme have on simulated cloud droplet number and cloud processing of aerosol particles. Our simplified model used diagnoses of the properties of the cloud from only three input parameters: maximum supersaturation reached inside the cloud, time the air parcel spends in the cloud and average cloud liquid wa-ter content. Five approaches to dewa-termine the activated frac-tion of CCN were incorporated into this simplified model and compared in their ability to predict the concentration of droplets, sulphate formed in aqueous phase reactions and out-of-cloud dry particle size distribution over one or more cloud cycles.
Overall, the simplified low resolution model agreed fairly well with the reference model under marine and rural condi-tions. In the polluted urban case, the simplified model, which cannot resolve the kinetic effects of cloud droplet growth, was not able to predict the cloud droplet number accurately. For marine and rural conditions, the assumption of a distri-bution profile inside the critical size section(s) clearly im-proved the prediction of the cloud droplet concentration. In most cases simulated here, however, the shape of the profile was almost irrelevant as a flat profile (approach 3), a tilted linear profile (approach 4) and a profile which in a crude way takes into account the local shape of the particle dis-tribution (approach 5) produced nearly identical results. Ap-proach 5 still performed slightly better than its counterparts, and would be advantageous especially in situations when the aerosol size distribution shows steep local slopes in particle concentration in the CCN size range. Although the low reso-lution scheme cannot reproduce the small details of the cloud processed particle size distribution, it predicted the changes of total dry mass and surface area during the cloud cycles to a good accuracy. Only one of the activation approaches (approach 2) was clearly inferior to the others in this respect. The simulations show that a simplified cloud model with a size resolution typical to large scale models can describe the CCN activation and cloud processing of aerosol particles fairly accurately. Only under conditions for which the ki-netic limitations of the droplet growth are significant, i.e. es-sentially urban and other highly polluted environments, the simplified model clearly overestimates the concentration of forming cloud droplets. Since the vast majority of the Earth’s surface is covered by marine, remote or rural environment, for which the tested scheme agrees well with reference simu-lations, a simplified low-resolution cloud model is in general suited for large scale modelling purposes. It can, however, show uncertainties in areas with strong pollution from an-thropogenic sources.
Acknowledgements. This work has been supported by Academy of Finland (projects 205798 and 208208).
Edited by: B. K¨archer
References
Abdul-Razzak, H., Ghan, S. J., and Rivera-Carpio, C.: A parameter-ization of aerosol activation, 1. Single aerosol type, J. Geophys. Res., 103, 6123–6131, 1998.
Abdul-Razzak, H. and Ghan, S. J.: A parameterization of
aerosol activation, 3. Sectional representation, J. Geophys. Res., 107(D3), 4026, doi:10.1029/2001JD000483, 2002.
Andronache, C.: Precipitation removal of ultrafine aerosol parti-cles from the atmospheric boundary layer, J. Geophys. Res., 109, D16S07, doi:10.1029/2003JD004050, 2004.
Bessagnet, B., Hodzic, A., Vautard, R., Beekman, M., Cheinet, S., Honor´e, C., Liousse, C., and Rouil, L.: Aerosol modeling with CHIMERE – preliminary evaluation at the continental scale, At-mos. Environ., 38, 2803–2817, 2004.
Brenguier, J.-L., Pawlowska, H., Schuller, L., Preusker, R., Fis-cher, J., and Fouquart, Y.: Radiative properties of boundary layer clouds: droplet effective radius versus number concentration, J. Atmos. Sci., 57, 803–821, 2000.
Fountoukis, C. and Nenes, A.: Continued development of a cloud droplet formation parameterization for global climate models, J. Geophys. Res., 110, D11212, doi:10.1029/2004JD005591, 2005. Gurciullo, C. S. and Pandis, S. N.: Effect of composition varia-tions in cloud droplet populavaria-tions on aqueous-phase chemistry, J. Geophys. Res., 102, 9375–9385, 1997.
Hoppel, W. A., Frick, G. M., Fitzgerald, J., and Larson, R. E.: Ma-rine boundary layer measurements of new particle formation and the effects non-precipitating clouds have on aerosol size distribu-tion, J. Geophys. Res., 99, 14 443–14 459, 1994.
Jacobson, M. Z.: Development and application of a new air pollu-tion modeling system – II. Aerosol module structure and design, Atmos. Environ., 31, 131–144, 1997.
Jaenicke, R.: Tropospheric aerosols, in: Aerosol-cloud-climate in-teractions, edited by: Hobbs, P. V., Academic Press, San Diego, 1–31, 1993.
Kerminen, V.-M.: Relative roles of secondary sulfate and organ-ics in atmospheric cloud condensation nuclei production, J. Geo-phys. Res., 106(D15), 17 321–17 333, 2001.
Korhonen, H., Lehtinen, K. E. J., Pirjola, L., Napari, I., Vehkam¨aki, H., Noppel, M., and Kulmala, M.: Simulation of atmospheric nucleation mode: A comparison of nucleation models and size distribution descriptions, J. Geophys. Res., 108(D15), 4471, doi:10.1029/2002JD003305, 2003.
Korhonen, H., Lehtinen, K. E. J., and Kulmala, M.: Aerosol dy-namic model UHMA: Model development and validation, At-mos. Chem. Phys., 4, 757–771, 2004,
SRef-ID: 1680-7324/acp/2004-4-757.
Kreidenweis, S. M., Walcek, C. J., Feingold, G., Gong, W., Ja-cobson, M. Z., Kim, C.-H., Liu, X., Penner, J. E., Nenes, A., and Seinfeld, J. H.: Modification of aerosol mass and size
dis-tribution due to aqueous-phase SO2oxidation in clouds:
Com-parisons of several models, J. Geophys. Res., 107(D7), 4213, doi:10.1029/2002JD002697, 2003.
Lohmann, U. and Feichter, J.: Global indirect aerosol effects: a review, Atmos. Chem. Phys., 5, 715–737, 2005,
SRef-ID: 1680-7324/acp/2005-5-715.
Moore, K. F., Sherman, D. E., Reilly, J. E., and Collett Jr., J. L. : Drop size-dependent chemical composition in clouds and fogs, Part I, Observations, Atmos. Environ., 38, 1389–1402, 2004. Nenes, A. and Seinfeld, J. H.: Parameterization of cloud droplet
formation in global climate models, J. Geophys. Res., 108(D14), 4415, doi:10.1029/2002JD002911, 2003.
Nenes, A., Ghan, S., Abdul-Razzak, H., Chuang, P. Y., and Seinfeld, J. H.: Kinetic limitations on cloud droplet formation and impact on cloud albedo, Tellus, 53B, 113–149, 2001.
Ramanathan, V., Crutzen, P. J., Kiehl, J. T., and Rosenfeld, D.: Aerosols, climate and the hydrological cycle, Science, 294, 2119–2124, 2001.
Rodriguez, M. A. and Dabdub, D.: IMAGES-SCAPE2: A mod-elling study of size- and chemically resolved aerosol thermody-namics in a global chemical transport model, J. Geophys. Res., 109, D02203, doi:10.1029/2003JD003639, 2004.
Rotstayn, L. D. and Liu, Y.: A smaller estimate of the sec-ond indirect aerosol effect, Geophys. Res. Lett., 32, L05708, doi:10.1029/2004GL021922, 2005.
Seinfeld, J. H. and Pandis, S. N.: Atmospheric chemistry and physics, John Wiley & Sons, New York, 1998.
Sekiguchi, M., Nakajima, T., Suzuki, K., Kawamoto, K., Higurashi, A., Rosenfeld, D., Sano, I., and Mukai, S.: A study of the direct and indirect effects of aerosols using global satellite data sets of aerosol and cloud parameters, J. Geophys. Res., 108(D22), 4699, doi:10.1029/2002JD003359, 2003.
Spracklen, D. V., Pringle, K. J., Carslaw, K. S., Chipperfield, M. P., and Mann, G. W.: A global off-line model of size-resolved aerosol microphysics: I. Model development and prediction of aerosol properties, Atmos. Chem. Phys., 5, 2227–2252, 2005,
SRef-ID: 1680-7324/acp/2005-5-2227.
Stier, P., Feichter, J., Kinne, S., Kloster, S., Vignati, E., Wilson, J., Ganzeveld, L., Tegen, I., Werner, M., Balkanski, Y., Schulz, M., Boucher, O., Minikin, A., and Petzold, A.: The aerosol-climate model ECHAM5-HAM, Atmos. Chem. Phys., 5., 1125–1156, 2005.
Zhang, Y., Easter, R. C., Ghan, S. H., and Abdul-Razzak,
H.: Impact of aerosol size distribution on modelling
aerosol-cloud interactions, J. Geophys. Res., 107(D21), 4558, doi:10.1029/2001JD001549, 2002.